Sales Metrics & KPIs
Metrics & KPIs for modern sales teams.
Track all your Sales KPIs in one place
Sign up for free and start making decisions for your business with confidence.
Understanding and leveraging sales metrics can be the difference between building a top-performing sales team or wasting your resources. The strategic use of these metrics can shed light on your sales strategies and identify areas that you can improve.
These metrics offer insights into customer behaviors and market trends, which enable you to tailor your approach to meet evolving demands. They also help in setting realistic targets and benchmarks, which are essential for motivating your team and measuring success.
In this guide, we’ll go through the importance of sales metrics and the tools necessary to track and analyze these key performance indicators (KPIs) and metrics.
Why Do You Need to Track Sales Metrics?
Knowing your business's performance will give you a clear perspective on the strategies that are working or not. Here's why tracking them is essential:
Clear performance overview
If you monitor sales metrics, you can see how well your team is performing. Are they meeting targets? Are certain products selling better than others? Data offers a snapshot of where things stand.
Identifying strengths and weaknesses
Sales metrics can highlight areas where your sales team excels and where they might need additional training or resources. For example, if one product is selling much better than others, it might be worth investing more in its promotion.
Informed decision-making
Whether it's setting future sales targets, allocating budgets, or launching new products, sales metrics provide the insights needed to choose the best course of action for your leads. With more accurate sales data, you can make better decisions.
Spotting trends
Sales metrics can help you identify patterns over time. Sales dip during certain months or spike during specific seasons. Recognizing these trends will allow you to plan and strategize for your company’s growth.
Enhancing team motivation and focus
Tracking sales metrics lets your team see the direct impact of their efforts. This transparency drives them to achieve their targets and fosters a sense of accomplishment and purpose.
When every team member understands their contribution to the company's success, they are more motivated to push boundaries.
Top Sales Metrics Your Team Should Be Tracking
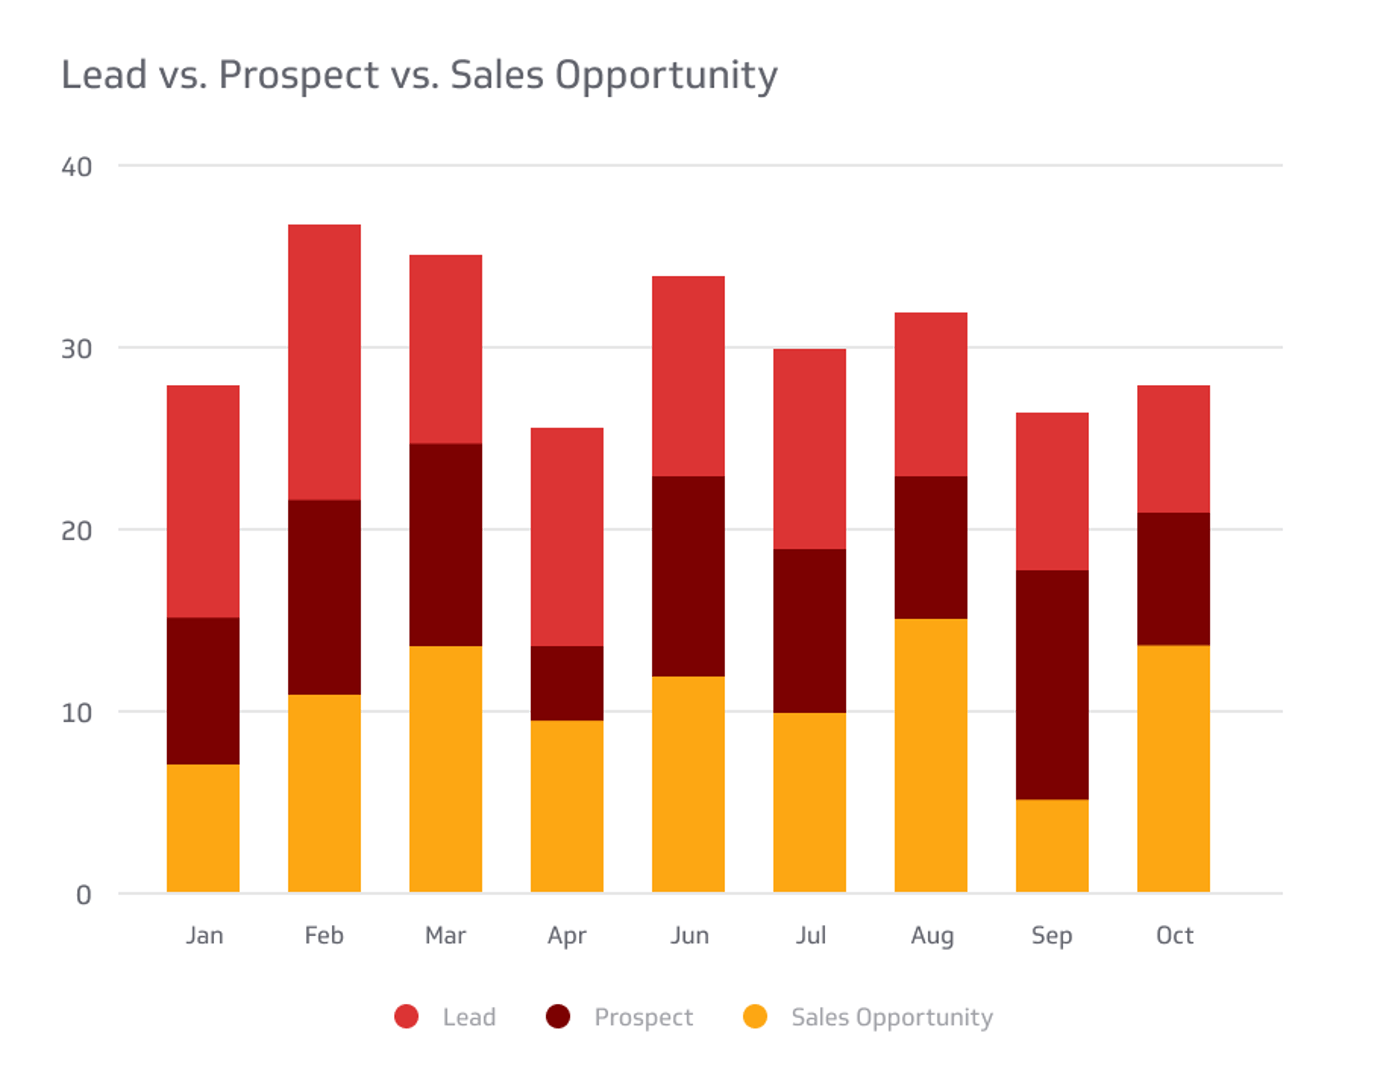
From discovering a prospective client to following leads and making sales, every step is vital to achieving your quotas. Below are some of the most important sales metrics that will keep your processes all on track.
Total Sales Revenue
One of many good indicators of your sales performance is your company’s total revenue.
Total revenue, also known as gross sales, refers to all the income your business generates. It encompasses all your products and services over a set length of time. You can calculate it by multiplying the quantity of all products or services sold by its price.
This sales metric provides a clear and broad view of your overall performance by showing you exactly how much you’re making. It is also important because sales teams can’t come up with or track goals if you don’t know the bottom line of how you’re doing.
Revenue by Product or Service
Revenue by product or service is a sales metric that shows you how much revenue each product or service generates. It identifies the products or services that earn the most sales, proving their value and importance to the company. It will also point out which products or services aren’t getting much revenue.
With this information, you can decide if any of your services or products must be discontinued, marketed, or upsold more effectively.
Monthly Recurring Revenue Growth
The Monthly Recurring Revenue (MRR) Growth Rate gauges the rate of your regular income, whether it’s growing or shrinking each month. It’s calculated by comparing the MRR at the end of a defined period with the MRR at the beginning of that same period.
For example, if your MRR at the start of June is $10,000 and by the end of June, it's $12,000, your MRR growth for the month is calculated as follows:
MRR Growth = (End of Month MRR−Start of Month MRR/Start of Month MRR)×100
MRR Growth=(12,000−$10,000/$10,000)×100=20%
This means your monthly recurring revenue grew by 20% in June.
The MRR helps you understand two crucial aspects of your business: how effective you are at acquiring new customers and holding onto the ones you already have.
In terms of acquiring new customers, the metric shows whether your marketing and outreach efforts are bringing in a steady stream of new business.
On the other hand, when it comes to retaining existing customers, this benchmark indicates the strength of your customer relationships and the effectiveness of your customer service. Getting high numbers consistently suggests that your current customers are satisfied and loyal, which is key for sustainable business growth.
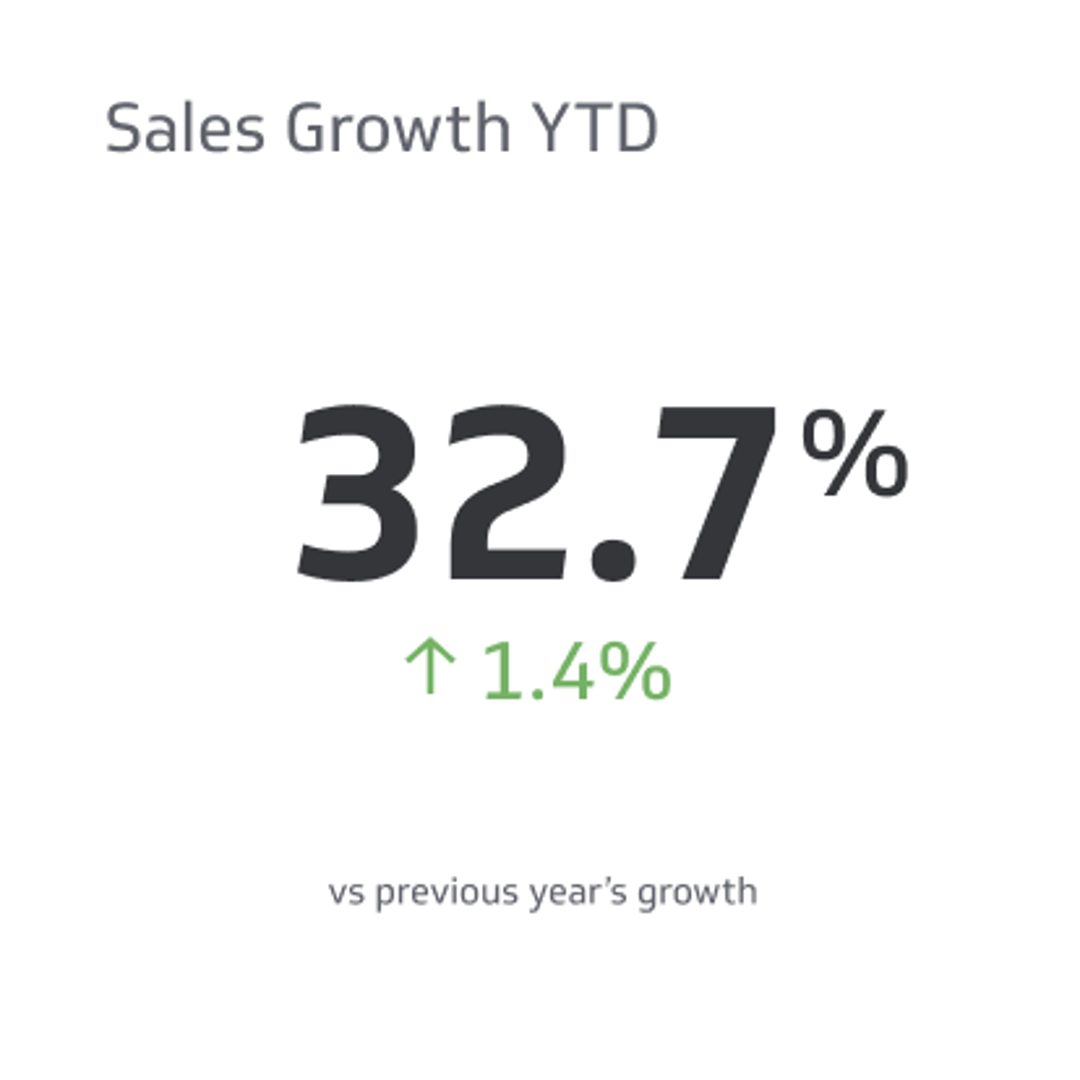
Year-Over-Year Growth
Year-over-year growth provides information on how your total revenue stacks up from one year to the next, or even across multiple years. It's a simple way to see if your business is moving forward, standing still, or needing a boost.
For example, after figuring out how much your total revenue is for the two years you’re comparing, subtract the amount of the previous year’s revenue from the current year’s income, then multiply that number by 100.
You can compare this number to your goals and use it to project and set new ones for future years.
YOY growth should show you clearly if your business is on the right track and where there's potential for more growth.
Average Revenue
Knowing the average revenue generated by a single customer, account, or product will show how your business is weighted—or where the bulk of your money comes from. Is it spread out evenly across different sources, or is most of it coming from just a few big players?
The average revenue metric gives you a good idea of where to spend your attention and resources. As a result, you can nurture and grow your most profitable relationships or products.
Plus, you get to learn from what's working well and apply those successes elsewhere!
Annual Contract Value (ACV)
ACV, or annual contract value, refers to a multi-year contract’s yearly revenue, allowing you to see which accounts generate the most income. It’s also helpful information to have when re-negotiating or re-signing contracts.
To calculate your ACV, divide the total contract value by the number of years in the contract. For example, if you have a contract worth $60,000 that spans over 3 years, the ACV would be:
ACV = $60,000/3 = $20,000
So, the ACV for this contract is $20,000 per year.
Average Customer Lifetime Value
Average customer lifetime value calculates how much a single customer is likely to spend with your business over time.
This metric is a key indicator of how well you're connecting with your customers and meeting their needs over time. For instance, if your Average Customer Lifetime Value is on the rise, it's a good sign that your customers are sticking around and really liking what you offer.
To get this number, look at how often they buy from you and how much they spend on average.
Sales Expense Ratio
While you have to spend money to make money, it’s all about balance. Your sales expense ratio will show how much you spend to acquire customers in relation to revenue.
To figure out this percentage, just take your net sales and divide them by your operating expenses. After that, multiply the result by 100.
Market Penetration
Market penetration gauges how much of the market you've successfully tapped into and helps you identify where you are with your sales-related goals. If your percentage is low, it may indicate a need to go over your strategies.
To calculate it, you first need to determine your target market size. From there, divide your total customers by your target market size and multiply by 100 for your percentage.
Percentage of Business from New Customers
The percentage of business from new customers metric shows you how much of your revenue is coming from first-time buyers. It shows your growth from acquiring new customers, letting you determine if your customer acquisition strategies are working and adding to revenue.
To calculate it, divide sales earned from new customers by your total revenue. Then, multiply that number by 100 to get the percentage.
Percentage of Revenue from Existing Customers
Retaining customers is more cost-effective than acquiring new ones. It's also an indicator of how fit your product or service is at attracting repeat sales or upgrades.
This sales metric determines how much of your total revenue comes from existing customers through repeat sales, cross-selling, or upselling.
Following the above example, divide all sales earned from existing customers by your total revenue and multiply it by 100.
Percentage of Revenue from New & Existing Customers
Once you’ve calculated your percentages of revenue from both new and existing customers, compare these percentages and see what they tell you. This sales metric shows you how well you attract new customers and how well you are at keeping existing ones. This way, you know which areas to focus your efforts on.
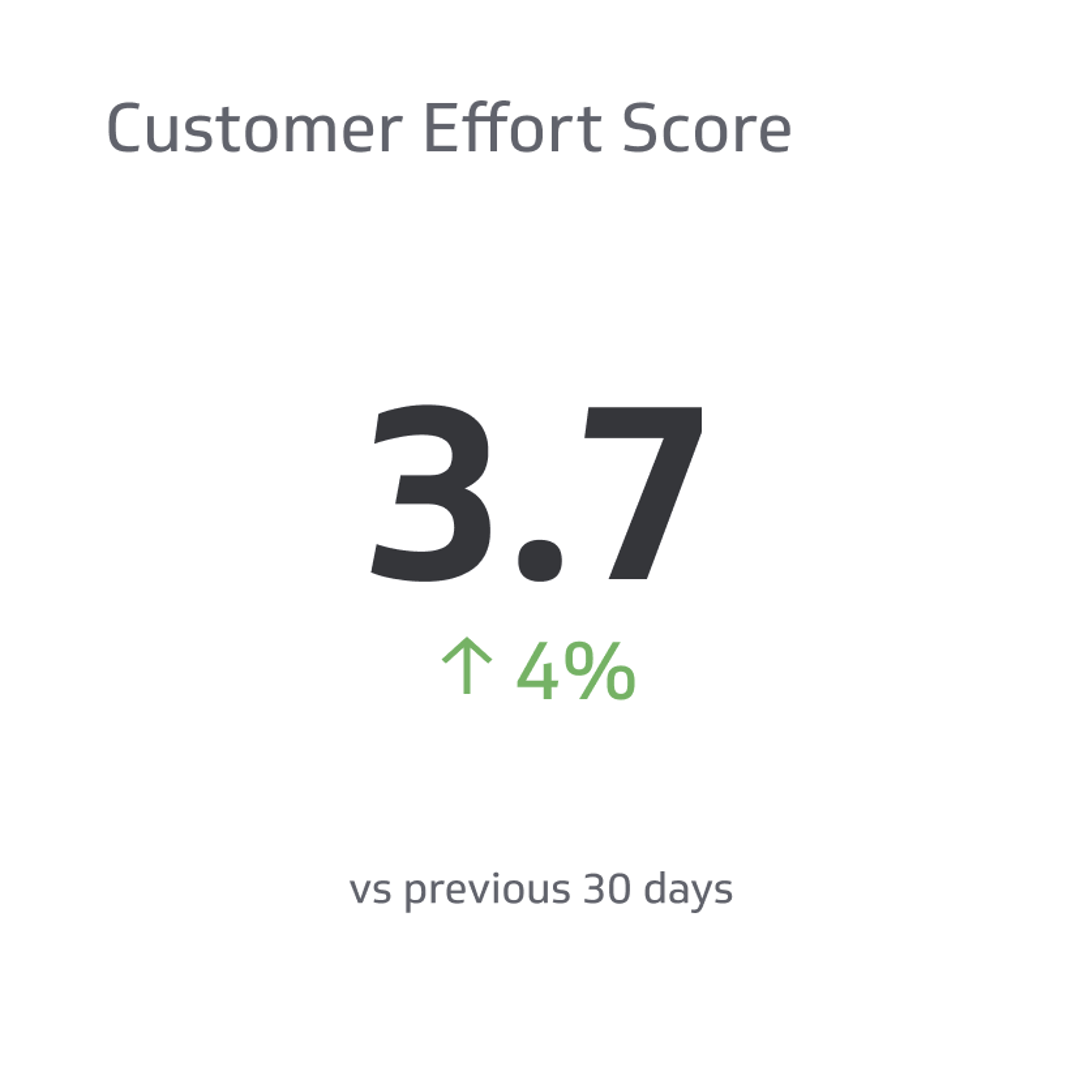
Net Promoter Score
Are customers happy enough to tell their friends about you? The net promoter score gives you a clear idea of customer loyalty and satisfaction, which are key drivers for your business's growth.
Churn Metrics
Churn rate refers to the number of customers who cancel or choose not to renew their subscription within a time period. If your company relies on a subscription model, you must ensure you’re not losing customers as fast as you’re gaining them, which churn rate can help with.
To calculate it, find the number of “churned” customers, or those who have stopped using your services or canceled their subscriptions, and divide that by your total number of customers. It lets you see your revenue and growth and will also point out problems that you have with retaining subscribers.
Sales Quota Attainment
Sales quota attainment will tell you if a sales rep has made their quota and what percentage of that quota they’ve attained. It’s especially helpful when evaluating issues with the sales team, including poor training, coaching, and communication, among others.
We recommend tracking this metric since it also helps you spot your top-performing salespeople.
Average Length of a Sales Cycle
The average length of a sales cycle is the time it takes for potential customers to start considering your product or service before finally making a purchase. The typical stages of the sales cycle include:
- Prospect
- Connect
- Research
- Present
- Close
Knowing this average time guides you in streamlining your sales process. As a result, it can make your team quicker and more efficient, especially when you're aiming to boost your revenue and grow your customer base.
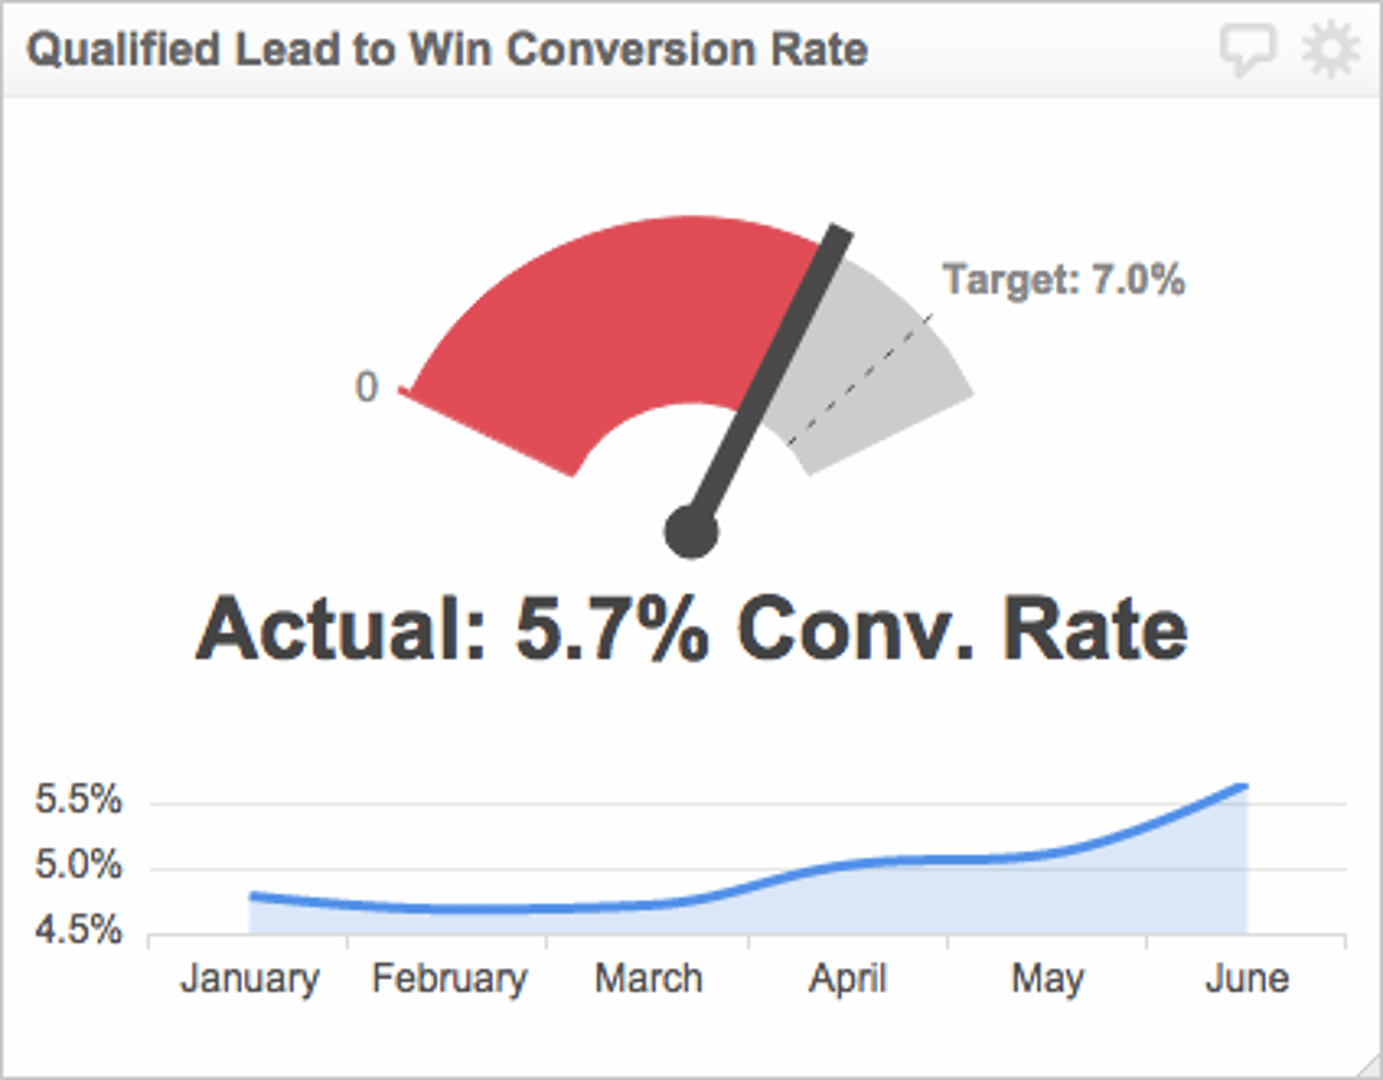
Win Rate
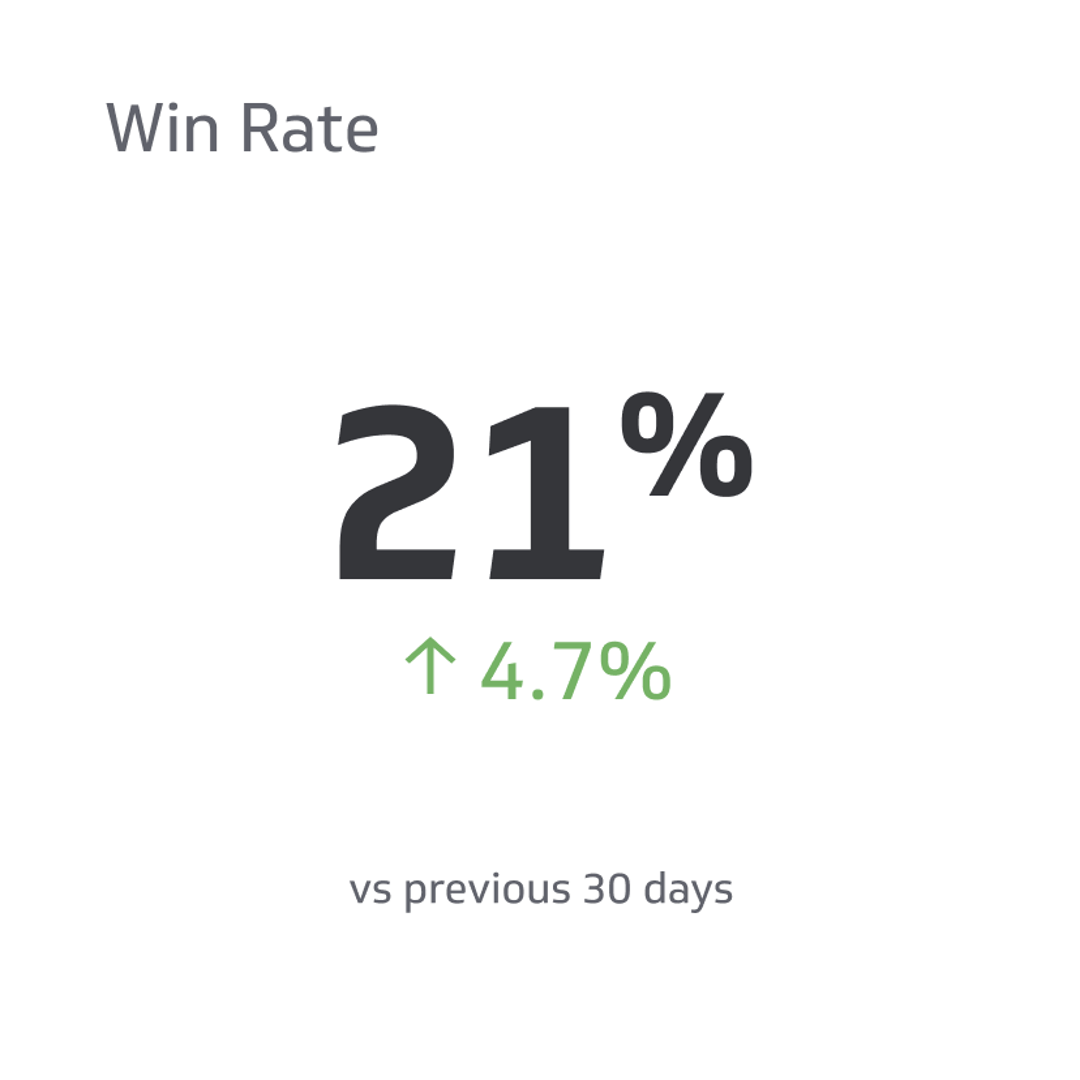
Win rate refers to the number of successful sales out of the total number of deal opportunities in the pipeline. The win rate shows sales reps their chances of success in each deal and sheds light on the team's overall performance.
It can be calculated and evaluated at both the team and an individual sales rep level—simply divide the number of closed deals by the total number of opportunities.
With metric, you can identify areas to improve and make sure your sales process is as effective as possible.
Deal Slippage
Your average deal slippage measures the number of sales that don’t close in the forecasted period. For example, a deal might be committed for Q1 but has to be pushed back to Q2 for some reason (like a delayed payment).
It allows you to track your performance more accurately and prepare for potential delays in the pipeline.
Weighted Value of Pipeline
Lastly, knowing the weighted value of the pipeline can help you project your generated sales revenue and cash flow. It determines the average deal value as it moves through the sales pipeline.
Plus, it can show you which types of sales are most important and those that need more attention.
You can calculate it by multiplying the probability of a deal closing by the value amount. For example, if you have a deal worth $10,000 and it's 60% likely to close, the weighted value is:
Weighted Value = Deal Value × Probability of Closing
Weighted Value = $10,000 × 60% = $6,000
It means that you’re most likely to generate this amount from this particular deal.
Sales Metrics Tools
With the right tools and systems, you can track your business’ performance and predict future trends. Here are four tools and systems you can use to monitor your sales metrics:
Data analytics tools
When you present data in visual formats like charts and graphs, you pave the way for quicker and more accurate interpretations. The right visual representation can make it easier to spot trends and show areas of concern for better decision-making.
Data analytics tools can also offer recommendations. For example, if a particular product is showing a decline in sales, the tool can suggest strategies to boost its performance and average revenue based on historical data and market trends.
Sales automation platforms
Having a system to take care of these routine tasks allows you and your sales team to focus on building relationships and closing deals. Sales automation platforms, such as Pipedrive or Salesloft, streamline and automate sales tasks and workflows. As a result, you do less manual work and reduce the chances of errors.
For instance, these platforms can automatically send follow-up emails to leads, schedule calls, or even rank leads based on their likelihood to convert.
Cloud-based collaboration tools
Cloud-based collaboration tools break down distance barriers, allowing your sales teams to work together wherever they are. They can quickly share customer feedback, update sales records in real-time, and jump on virtual meetings to strategize their next move.
Plus, with everything stored in the cloud, everyone has access to the latest information to keep the whole team aligned.
Tools like Google Workspace, Microsoft Teams, and Slack are perfect since they offer features specifically useful for sales. You can share sales documents, send instant updates, host strategy video calls, and manage tasks efficiently using all these platforms.
Artificial intelligence
Artificial intelligence, or AI, is helping sales teams in big ways. Take Salesforce Einstein, for example.
This AI tool can analyze past customer interactions and sales data to predict future buying behaviors. As such, you can identify which customers are most likely to buy again or which products they might be interested in. This kind of insight helps sales reps make smarter, more targeted pitches.
Similarly, tools like Conversica and Clara use AI to automate and streamline tasks. They can handle initial customer inquiries, schedule meetings, and even follow up on leads. With them, sales reps can focus more on closing deals rather than getting bogged down with routine tasks.
How to Effectively Integrate Sales Metrics Into Your Business Strategy
Now that you've equipped your sales team with the right strategies and tools, it's important to use those resources effectively to reach your goals. Here are eight tips to keep in mind:
1. Set clear sales objectives
Whether it's increasing sales by 20% or acquiring 50 new clients in a month, having a clear target will guide your efforts. Clear objectives act as indicators for your revenue team to understand what's expected of them.
2. Check each metric for relevance
Not every metric will be useful for achieving your goals. Sales analytics can help you determine which metrics your teams should prioritize. For example, if you're looking to boost customer retention, focus on metrics like customer satisfaction scores and churn rates.
3. Monitor sales regularly
Don't just set and forget. Regularly check your metrics and sales to see if you're on track. It helps in making timely adjustments to your strategies. Using a platform that provides real-time sales analytics can be beneficial in this aspect.
4. Act on product and sales insights
Sales metrics provide insights, but they're useless if not acted upon. If data shows a product isn't selling well, brainstorm ways to improve its marketing or consider discontinuing it. Remember, every metric is an indicator of some aspect of your business.
5. Train your sales team periodically
Continuous training can keep your sales team aligned with the company’s goals. Gaining additional knowledge and skills can also equip them with strategies to perform effectively and bring in revenue from their leads.
6. Stay flexible
If a strategy isn't working, be ready to pivot. Sales metrics will show trends over time, and it's essential to adapt based on what the data is telling you. For instance, if the average revenue is declining towards the end of a quarter, it's a sign to re-evaluate your strategies.
7. Seek feedback
Sometimes, the best insights come from your team, who face customers daily. Ask for feedback regularly and incorporate it into your strategies. It helps improve your strategies and ensures your sales teams feel valued and heard.
8. Review and adjust
At regular intervals, review your goals and the metrics you're using. Adjust based on what's working and what's not to ensure you're always moving in the right direction. If a rep is struggling to ramp up their sales, it might be time to offer additional training or resources.
Use The Right Metrics To Generate More Leads And Streamline Your Sales Process
Sales metrics can help you identify areas of opportunity in your revenue operations and drive more sales for the business. It can point out what’s working well, such as high-performing products or effective sales channels, so you can capitalize on these successes.
Moreover, these metrics can uncover areas in need of improvement, whether it's underperforming products, inefficient sales processes, or missed market opportunities. By doing so, you can drive substantial growth in your business to optimize every aspect of your sales pipeline.
FAQs
How do you monitor sales performance?
Monitoring sales performance involves tracking various sales metrics, like total sales revenue, average deal size, win rate, and sales cycle length, to assess the effectiveness of your sales strategies.
Maximizing analytics platforms can provide real-time insights into these metrics, which enable you to gauge your team's performance accurately. Reviewing these metrics regularly helps in identifying trends and making informed decisions to improve sales processes and strategies.
How do I keep track of sales reps?
Keeping track of sales representatives involves tracking their sales quota attainment, deal closure rate, and customer interactions. With sales automation tools, you can streamline this process for efficient tracking of each rep's activities and performance.
Regular one-on-one meetings and performance reviews based on these metrics can also provide valuable feedback and guidance to your sales reps.
Why is sales per hour important?
Sales per hour is an important metric as it measures the efficiency and productivity of your sales team. It helps in understanding how effectively they use their time to generate revenue for your business.
Sales per hour can highlight areas where sales processes can be optimized for better time management. As a result, you can increase your overall efficiency and profitability.
How should sales reps spend their time?
Sales reps should spend their time focusing on activities that directly contribute to closing deals and generating revenue. Your sales rep can do prospecting, nurture leads, present proposals to potential clients, and follow up on opportunities.
Time management is key, and reps should prioritize tasks based on their potential impact on sales. Using sales automation tools can help reduce time spent on administrative tasks. With this, reps can focus more on sales-generating activities.
What is the ideal sales process?
The ideal sales process is a structured and efficient series of steps that guide a potential customer from initial contact to closing a deal. It typically includes stages like prospecting, qualification, needs assessment, solution presentation, objection handling, closing, and follow-up.
The process should be customer-centric, flexible, and adaptable to different sales scenarios. Regular analysis and refinement of the sales process, based on performance metrics and feedback, are essential for continuous improvement and success in sales.