Social Media Performance Dashboard
Unify your social channels and track what matters most.
What is a social media performance dashboard?
A social media performance dashboard is a reporting tool that centralizes your marketing campaign results in one real-time view.
Instead of pulling reports manually from Facebook, Instagram, LinkedIn, and X, your dashboard connects directly to each platform and surfaces the metrics that matter. You get a single, always-current picture of how your campaigns are performing, who your content is reaching, and what's driving results.
For growing businesses, that visibility is the difference between reacting to data and acting on it.
Key metrics for your social media dashboard
Measuring social media performance means tracking a mix of metrics that tell the complete story of your efforts. Likes and follows are a starting point, but the metrics that move the business are the ones tied to engagement, reach, and return on investment.
Here are the essential metrics to monitor:
Engagement Rate: Your pulse check for audience connection. Track total likes, comments, shares, and clicks relative to your follower count. A high engagement rate signals that your content is resonating — a leading indicator of brand loyalty.
Impressions and Reach: Reach tells you how many unique people saw your content; impressions count the total number of times it was displayed. Together, these metrics measure brand awareness and overall visibility across platforms.
Click-Through Rate (CTR): The percentage of people who saw your post and clicked the call-to-action link. A strong CTR confirms your messaging and creative are working.
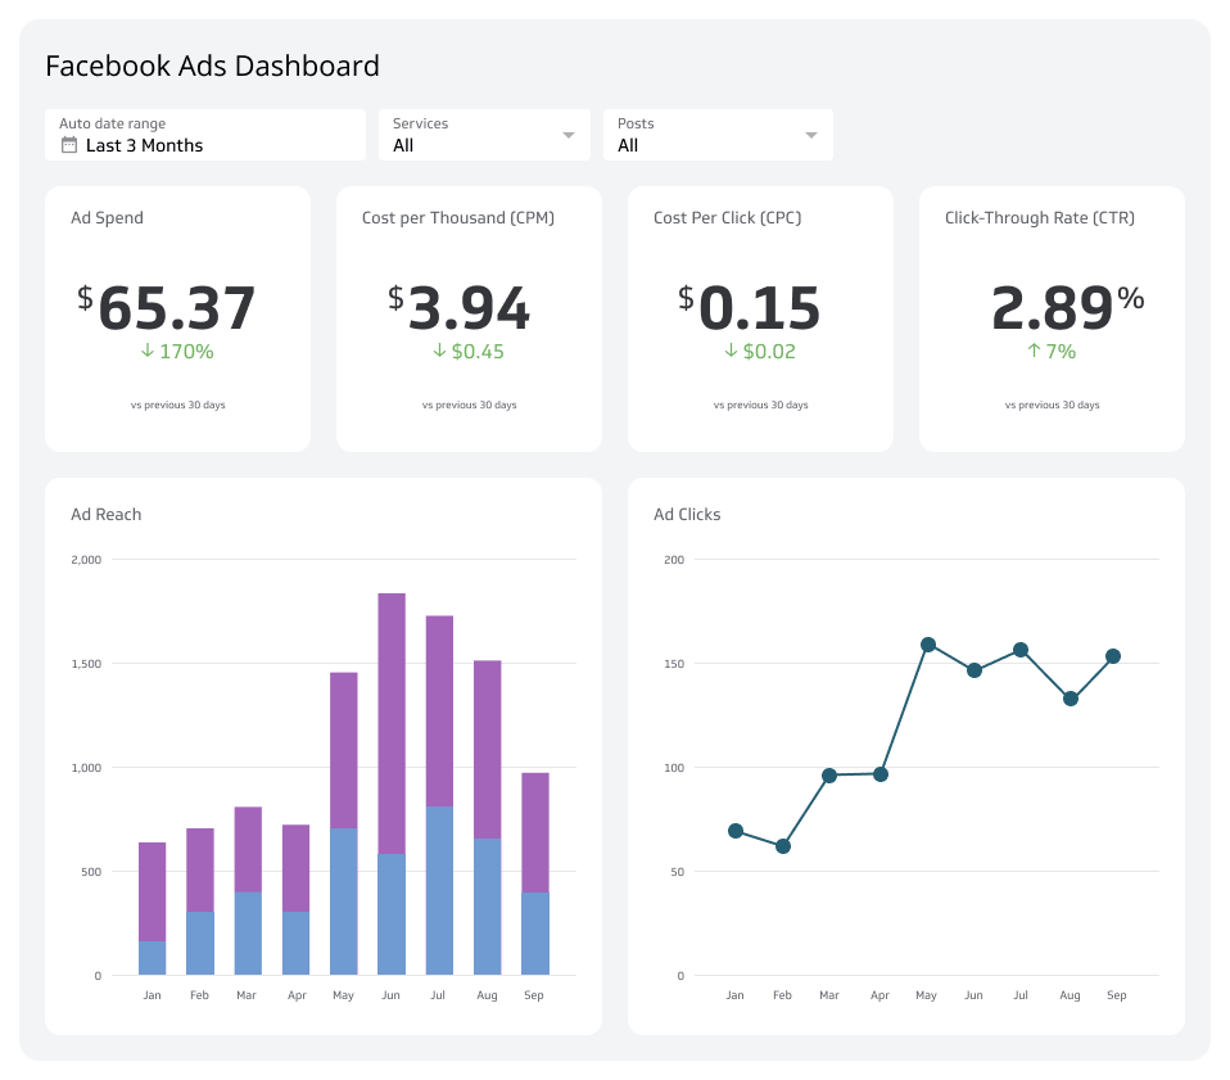
Ad Spend and Return on Investment (ROI): Connect ad spend data to track conversions, cost per acquisition (CPA), and return on marketing investment (ROMI). This is the data that justifies your budget and demonstrates social media's value to leadership.
Bringing these social media KPIs together in one dashboard means your team stops chasing data and starts focusing on growth.
Why use a social media performance dashboard?
Manual reporting across multiple platforms is slow and error-prone. A dashboard eliminates that friction by automating data retrieval and keeping every metric current.
The practical benefits are straightforward:
- Save time: No more exporting CSVs or copying numbers between spreadsheets. Your data refreshes automatically on a schedule you control.
- Spot trends faster: When all your channels appear side by side, patterns become obvious. You can see which platform is outperforming, which campaign is stalling, and where to shift budget.
- Align your team: Shared dashboards give everyone — from social media managers to executives — the same view of performance. Fewer meetings, fewer misunderstandings.
- Prove impact: When leadership asks whether social media is working, you have a clear, data-backed answer ready.
How to build a social media performance dashboard
Before you start building, answer a few questions to scope the dashboard correctly:
- Who is the primary audience — a social media manager, a marketing director, or an executive team?
- What decisions will this dashboard inform?
- Which platforms and campaigns need to be represented?
- How often does the audience need to review this data?
Your answers will shape the layout, the metrics you include, and the level of detail required. A dashboard built for a social media manager will look different from one designed for a weekly executive review.
Once you've defined the scope, connect your data sources, select your visualizations, and organize metrics by theme — awareness, engagement, conversion. Keep the layout clean and prioritize the metrics your audience acts on.
What to include in a social media dashboard
A well-built social media dashboard covers metrics across the full funnel:
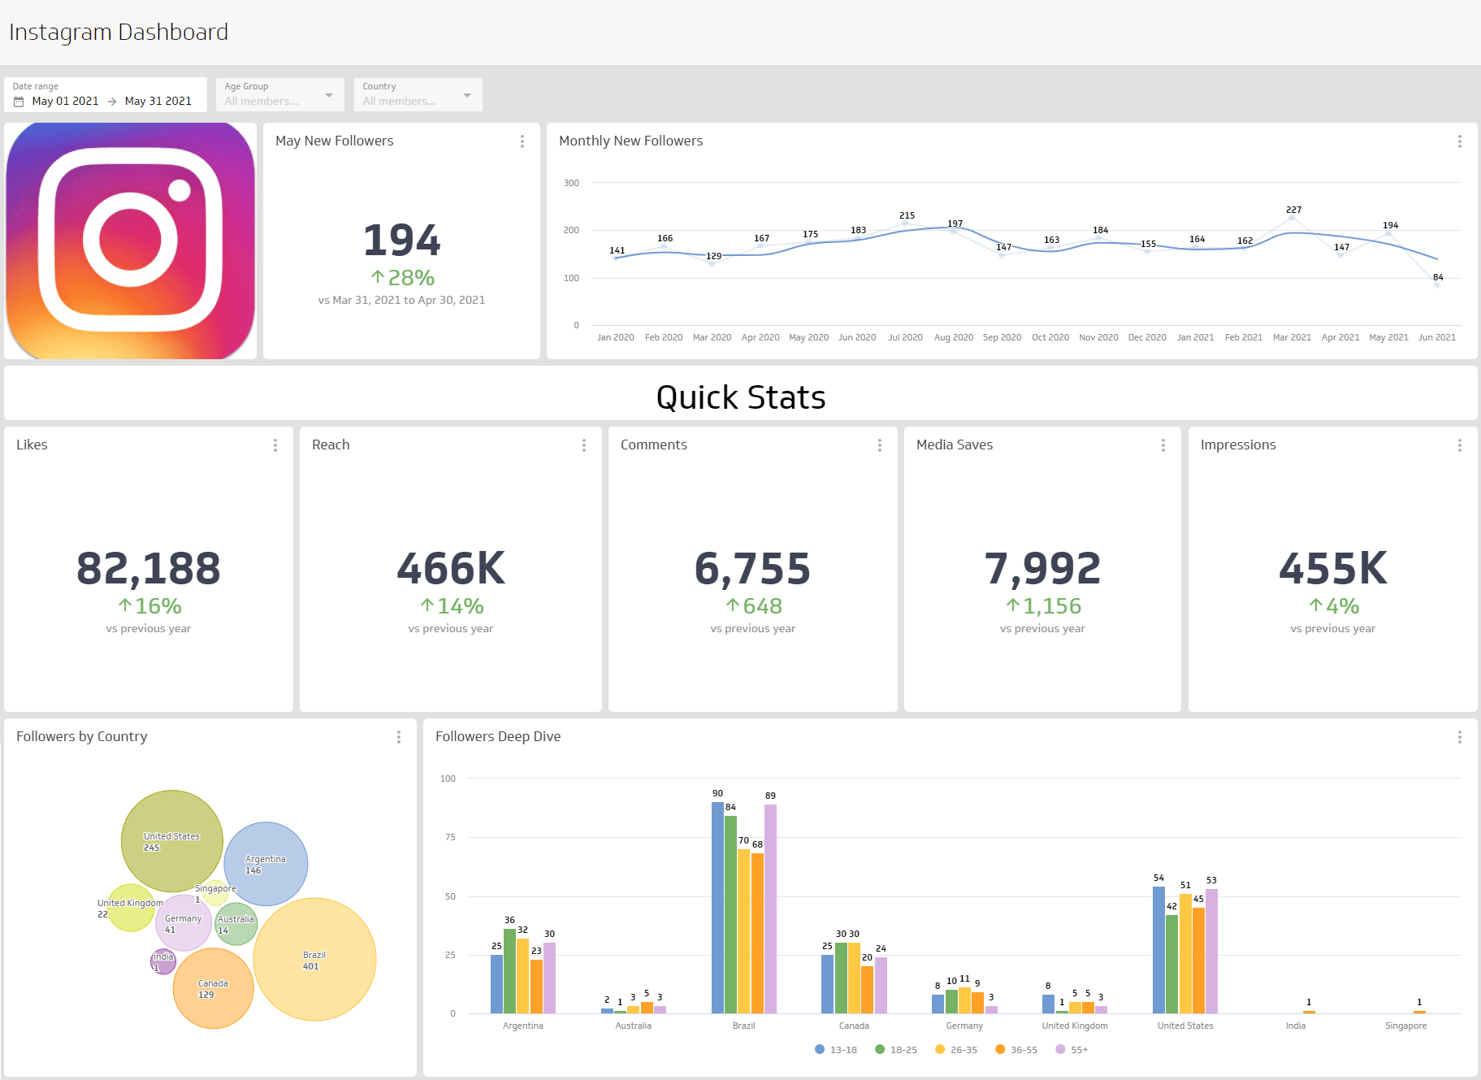
- Audience growth: Follower count and net new followers over time
- Content engagement: Likes, comments, shares, saves, and mentions
- Reach and impressions: Unique viewers and total content displays
- Post performance: Click-through rate and post clicks by content type
- Video metrics: Average watch time and completion rate
- Paid performance: Ad spend, CPA, and ROMI
The right mix depends on your goals. A brand awareness campaign prioritizes reach and impressions. A direct response campaign focuses on CTR, conversions, and cost per acquisition.
Tips for a more effective social media dashboard
A few additions can make your dashboard significantly more useful:
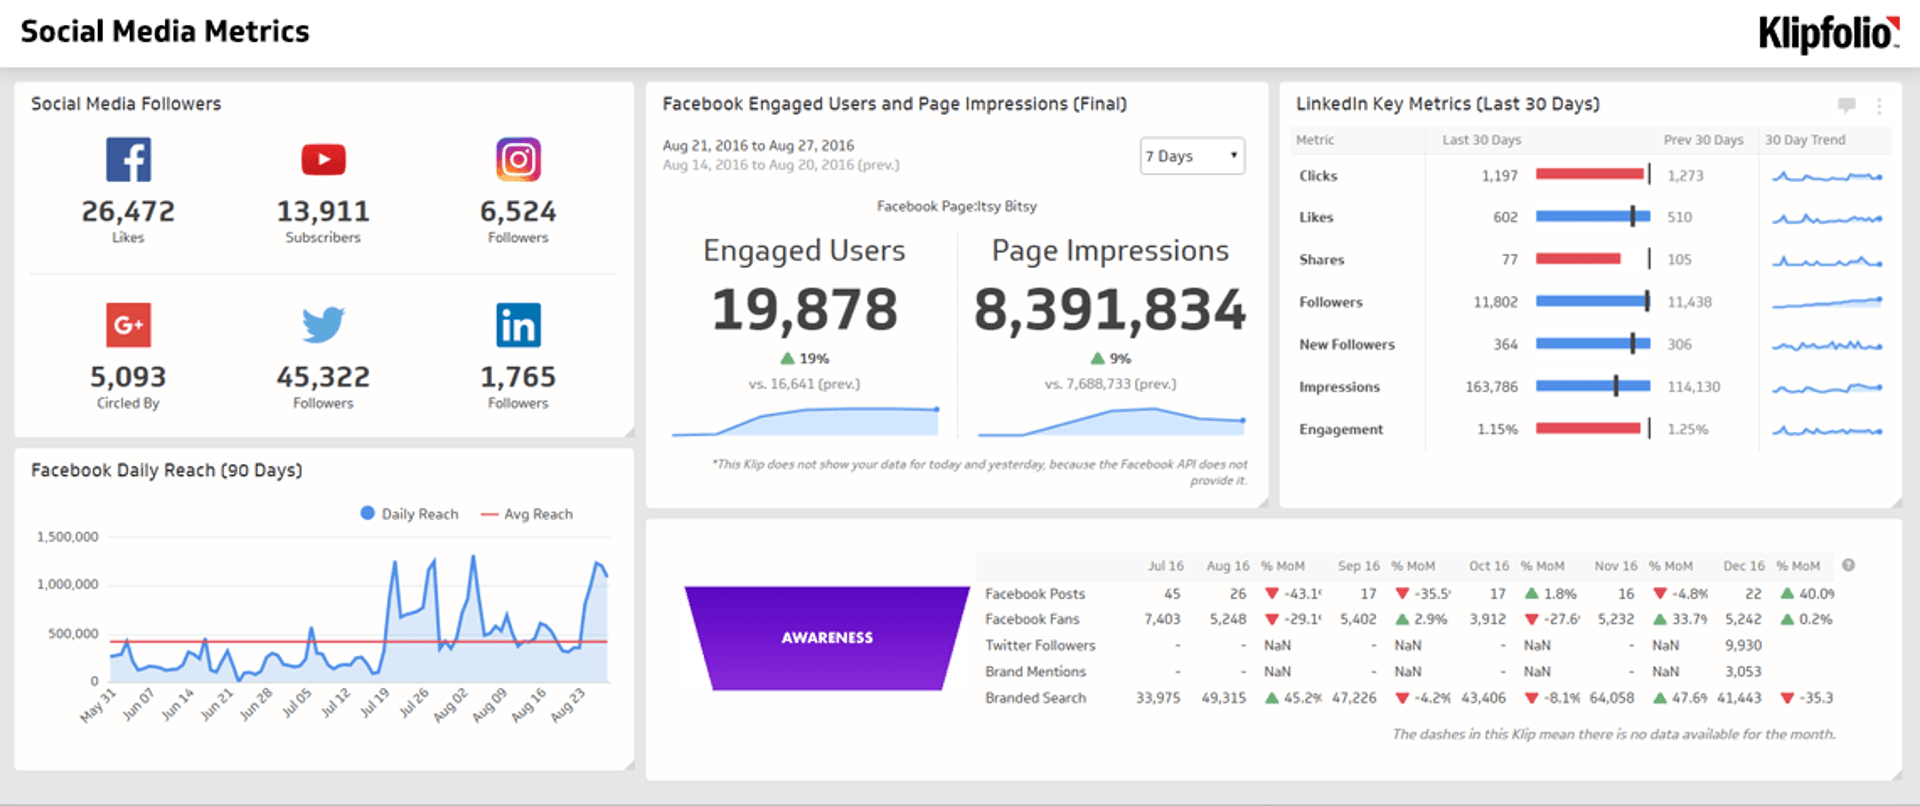
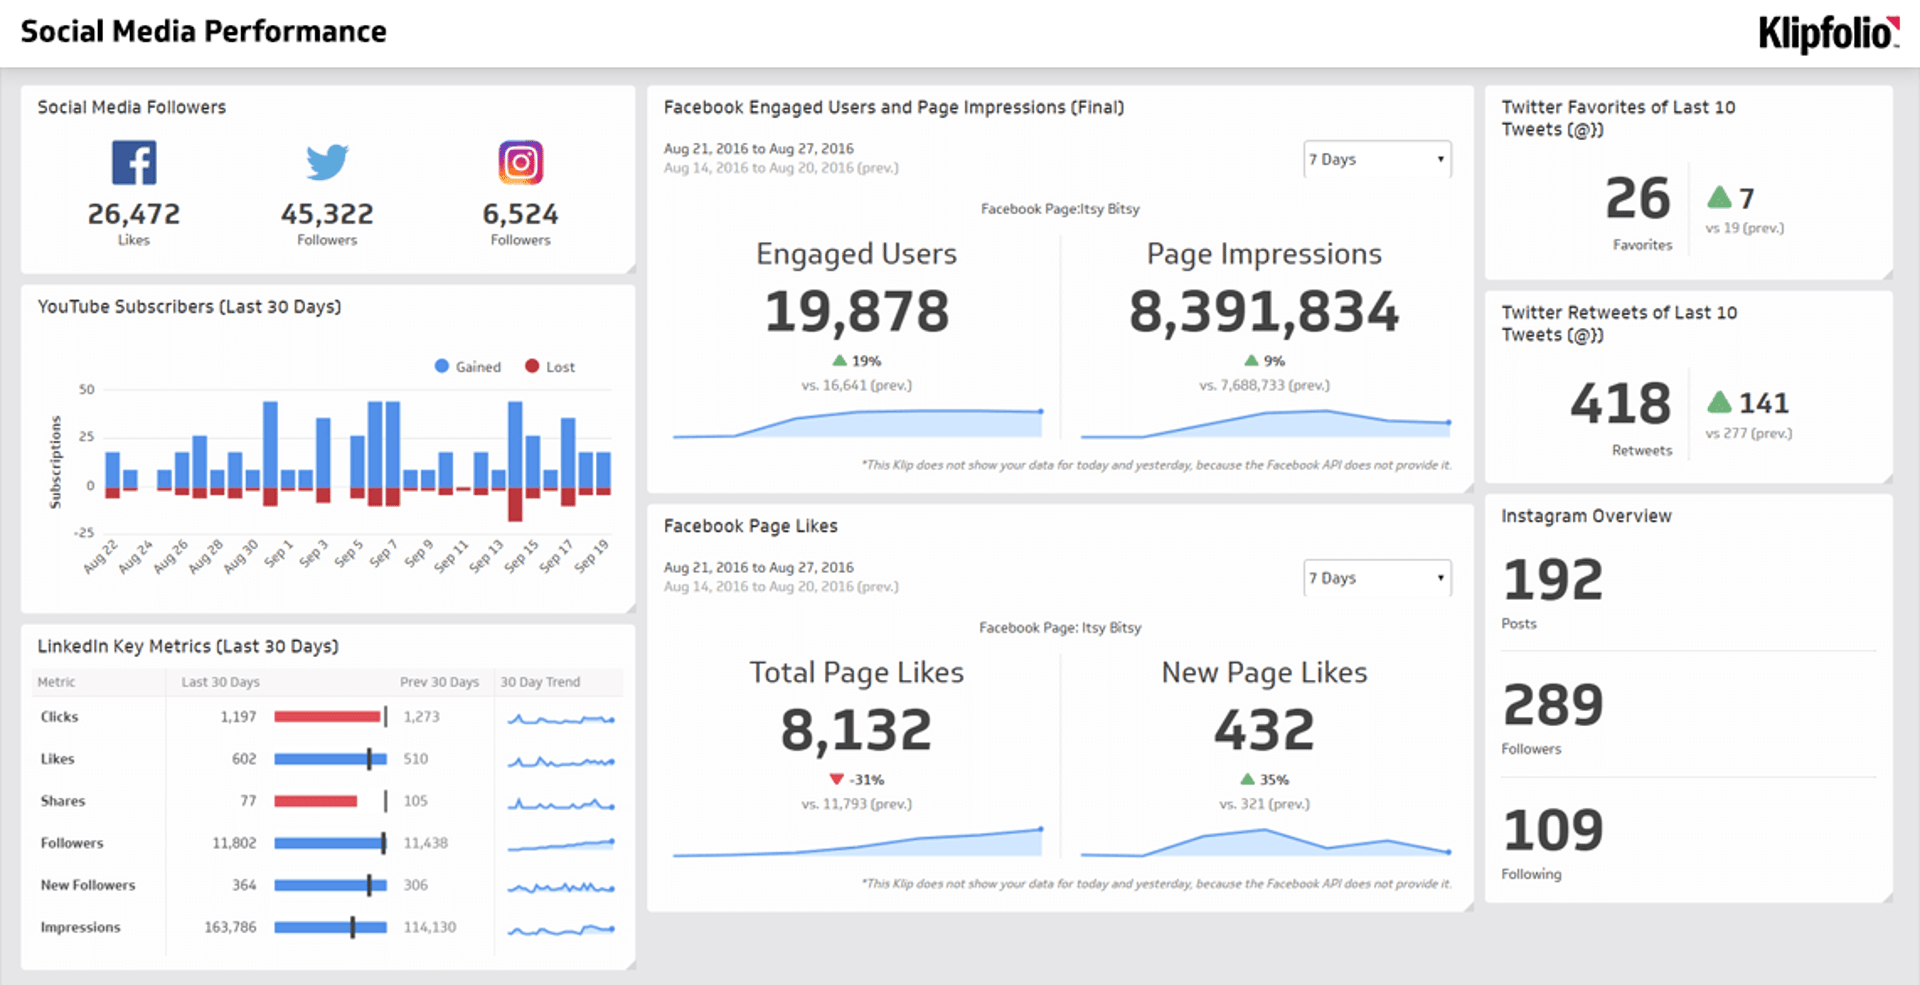
- Connect all your platforms. Pull data from Instagram, LinkedIn, Facebook, X, TikTok, and YouTube into a single view. Cross-channel visibility makes it easier to allocate effort and budget.
- Set up scheduled refreshes. Automate data updates so your dashboard always reflects current performance without manual intervention.
- Segment by campaign or content type. Aggregate numbers tell part of the story. Breaking performance down by campaign or format reveals what's actually driving results.
- Build for your audience. An executive summary dashboard needs fewer metrics and clearer context. A manager-level dashboard can go deeper into channel and campaign detail.
- Share results automatically. Schedule PDF or email reports so stakeholders get updates without needing to log in.
Build your social media performance dashboard with Klips
Klipfolio Klips connects to 130+ data sources, including every major social platform, so you can build a digital marketing dashboard that reflects your actual marketing stack. Use Excel-like formulas to model your data, choose from 30+ visualization types, and distribute your dashboard via TV mode, public links, scheduled emails, or embedded views.
Your team gets one shared view of performance. You get the time back you were spending on manual reports.
At a glance
Focus Area
Social media marketing performance tracking across multiple platforms
Metrics List
Engagement Rate, Impressions, Reach, Click-Through Rate, Ad Spend, ROI, Follower Growth, CPA
Reference Rate
Real-time to daily refresh depending on campaign cadence
Related Dashboards
View all dashboards