KPI Examples and Templates
This resource provides visual KPI examples and templates for key departments such as Sales, Marketing, Accounting, Supply Chain, Call Centers and more
Track all your KPIs in one place
Sign up for free and start making decisions for your business with confidence.

Overview
A Key Performance Indicator (KPI) is a measurable value that demonstrates how effectively a company is achieving key business objectives. Organizations use KPIs to evaluate their success at reaching targets. Selecting the right KPIs will depend on your industry and which part of the business you are looking to track
Once you’ve selected your key business metrics, you will want to track them in a real-time reporting tool. KPI management can be done using dashboard reporting software, giving your entire organization insights into your current performance. Learn more about how to track KPIs in a report or dashboard.
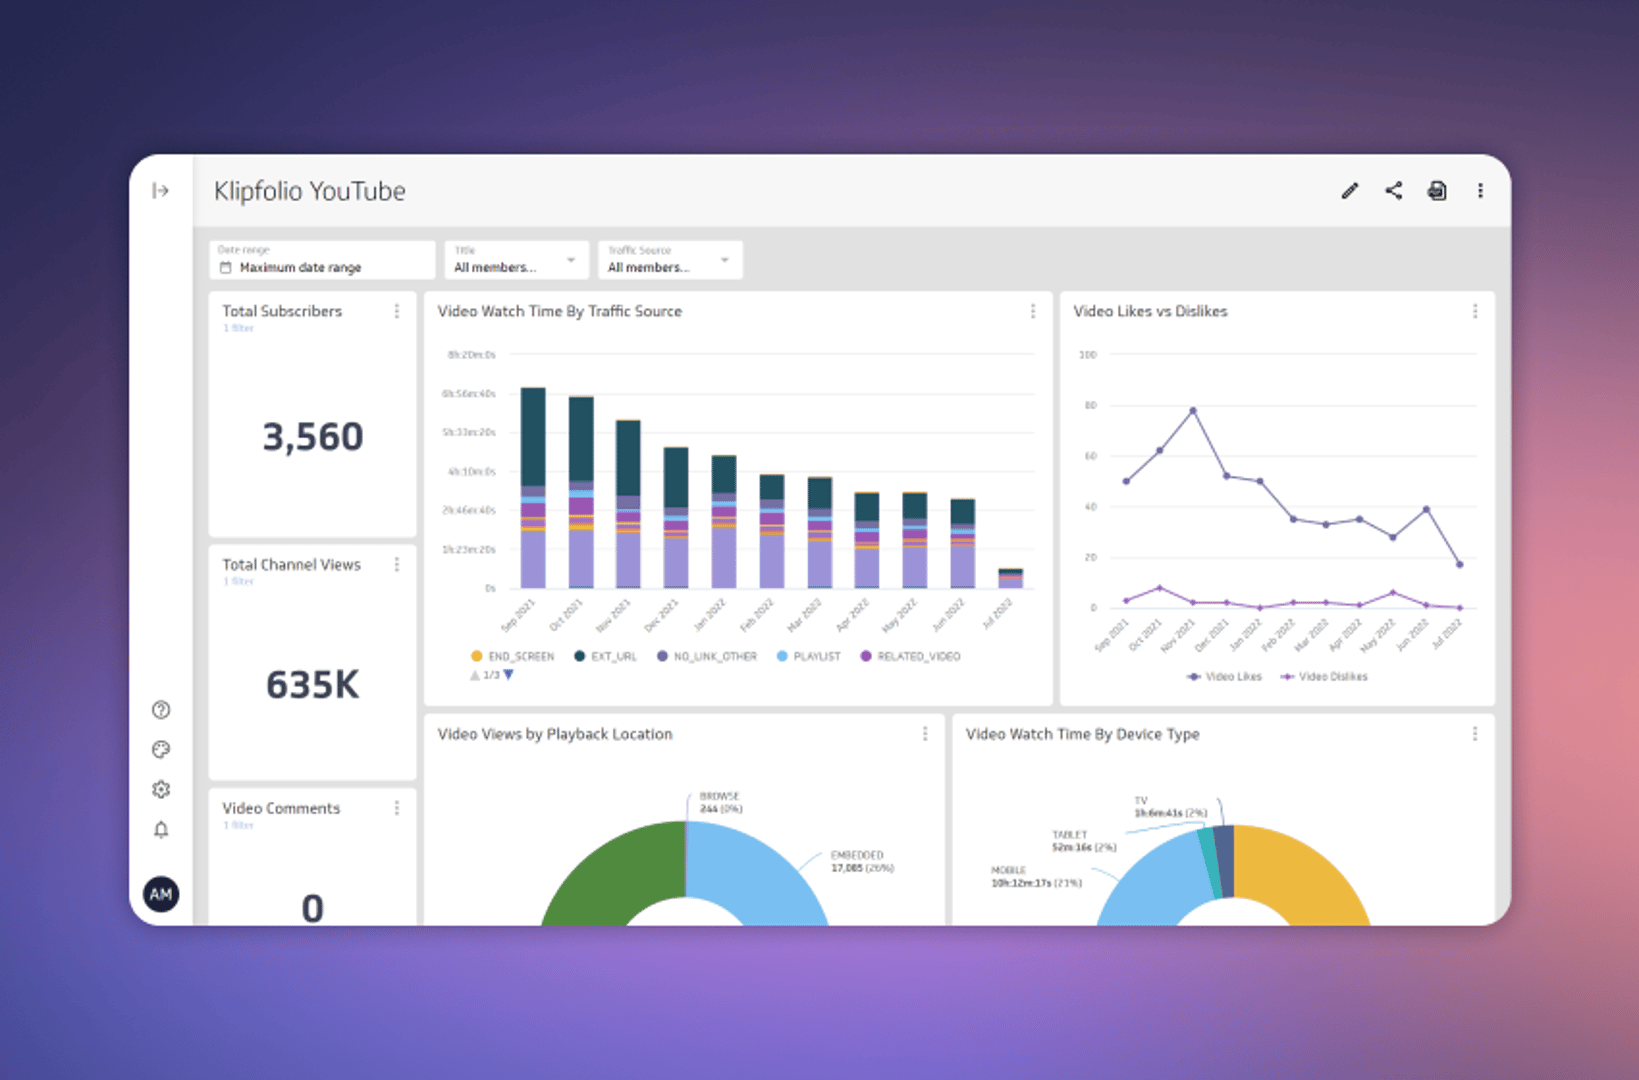
KPI Dashboard Templates & Examples
To be useful, key performance indicators need to be monitored and reported on; if they change in real-time, they should be monitored in real-time. KPI Dashboards are the perfect tool for your performance tracking reports as they can be used to visually depict the performance of an enterprise, a specific department, or a key business operation.
Why Are KPIs Important?
Each department will use different KPI types to measure success based on specific business goals and targets. If you need more examples of the advantages of KPIs, here’s a quick look:
- Key Performance Indicators (KPIs) gauge the success of a business, organization, or individual in reaching specific objectives.
- The KPIs can differ based on industry, company, and personal objectives.
- Popular KPI examples include customer satisfaction, employee retention, revenue growth, and cost reduction.
- KPIs are often measured on a periodic basis, such as monthly, quarterly, or yearly.
- KPIs should possess measurable, attainable, and relevant characteristics aligned with the organization's objectives.
- Regular tracking of KPIs ensures the organization is on track to meet its goals.
- In combination with other metrics, such as financial metrics, KPIs provide a comprehensive view of performance.
- KPIs can be utilized to compare performance across different departments, teams, or individuals.
- KPIs help identify areas for improvement and set future objectives.
How to Write and Develop Key Performance Indicators
When writing or developing a KPI, you need to consider how that key performance indicator relates to a specific business outcome or objective. Key performance indicators need to be customized to your business situation and should be developed to help you achieve your goals. Follow these steps when writing one:
Write a clear objective
When setting up your KPIs, the first step is to define a clear and specific objective for each metric. This objective should align with your overall business goals and provide a roadmap for what you're trying to achieve. For example, if your business goal is to increase customer retention, your KPI objective could be "to reduce churn rate by 10% in the next quarter."
Share objectives with stakeholders
Once you've established your KPI objectives, sharing them with all relevant stakeholders is crucial. This includes not just your team members but also executives, investors, and even key customers, where appropriate. Transparency ensures everyone is on the same page and working towards the same goals.
Conduct weekly or monthly reviews
Regular review of your KPIs is essential for tracking progress and making timely adjustments. Depending on the nature of the KPI and the business cycle, reviews can be conducted weekly or monthly. Use these review sessions to analyze data, discuss challenges, and celebrate wins.
Prioritize actionable KPIs
An actionable KPI is one that provides insights that you can act upon. For instance, instead of a vague KPI like "increase brand awareness," opt for something more actionable like "increase website traffic by 15% through targeted social media advertising." This gives you a clear action path to follow to achieve your objective.
Keep KPIs flexible to suit business needs
Business needs and environments are constantly changing. Your KPIs should be flexible enough to adapt to these changes. For example, if your business has recently entered a new market, you may need to adjust your KPIs to focus on customer acquisition rather than retention.
Set realistic targets but add stretch goals
While your KPIs should be challenging, they also need to be attainable to keep your team motivated. Always cross-reference your KPIs with historical data and current capabilities to ensure they are realistic. Additionally, consider adding a "stretch goal" that goes beyond the primary objective to encourage exceptional performance.
Update your objectives as needed
As you review your KPIs, there may be instances where objectives need to be updated. This could be due to a change in business strategy, market conditions, or internal capabilities. Regular updates ensure that your KPIs remain relevant and aligned with your current business goals.
Key Performance Indicators Best Practices
Measuring and monitoring business performance is critical, but focusing on the wrong key performance indicators can be detrimental. So can be poorly structured ones or ones that are too difficult, costly to obtain, or to monitor on a regular basis.
So what makes business performance indicators “key,” and how should a business owner, executive, or manager select them? There are six factors that separate effective, value-creating key performance indicators from detrimental, value-diminishing ones. Follow these six best practices:
- Aligned: Make sure they align with the strategic goals and objectives of your organization
- Attainable: The indicators you choose to measure should have data that can be easily obtained
- Acute: They should keep everyone on the same page and moving in the same direction
- Accurate: The data flowing into the performance indicators should be reliable and accurate
- Actionable: Does each one give you insight into the business that is actionable?
- Alive: Your business is always growing and changing. Your KPIs should evolve as well!
Learn more about KPI best practices.
Business Metrics vs KPIs
A Business Metric is a quantifiable measure that is used to track and assess the status of a specific business process. Every area of business has specific metrics that should be monitored – marketing metrics can include tracking campaign and program statistics, while sales metrics may look at the number of new opportunities and leads in your database, and executive metrics will focus more on big-picture financial metrics. Learn more: Business Metrics.
100+ KPI Examples & Templates
Depending on your industry and the specific department you are interested in tracking, there are a number of KPI types your business will want to monitor. Each department will want to measure success based on specific goals and targets. Take a look at the departmental KPI examples below to learn more about the one you should be measuring.
Below are the 100 important business KPI examples to track & measure.
- Marketing Key Performance Indicators
- Sales & Retail Key Performance Indicators
- Key Performance Indicator Examples for Operations
- Project Management Key Performance Indicators
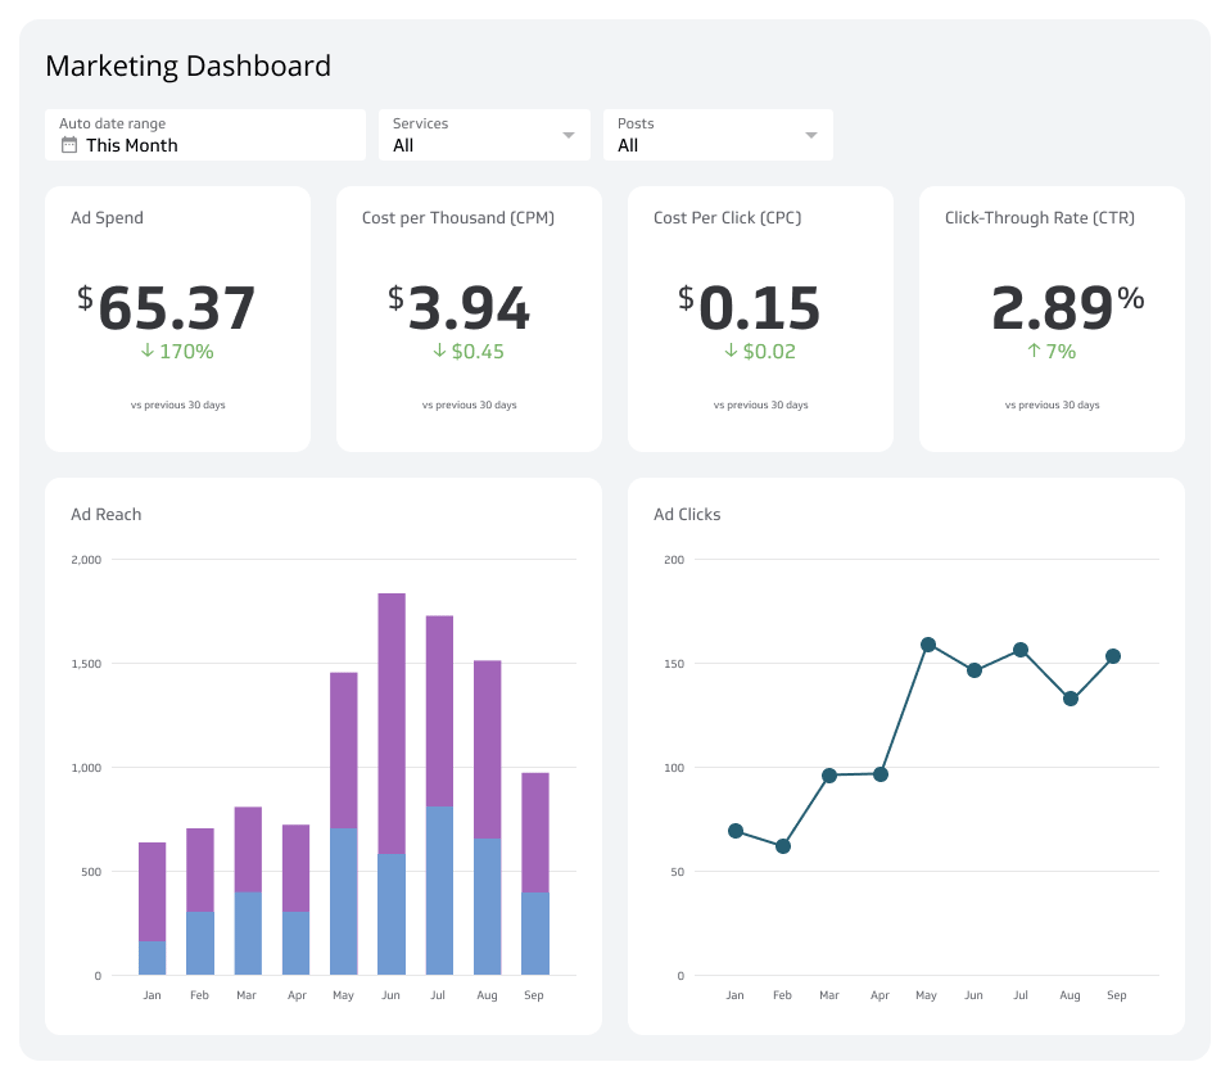
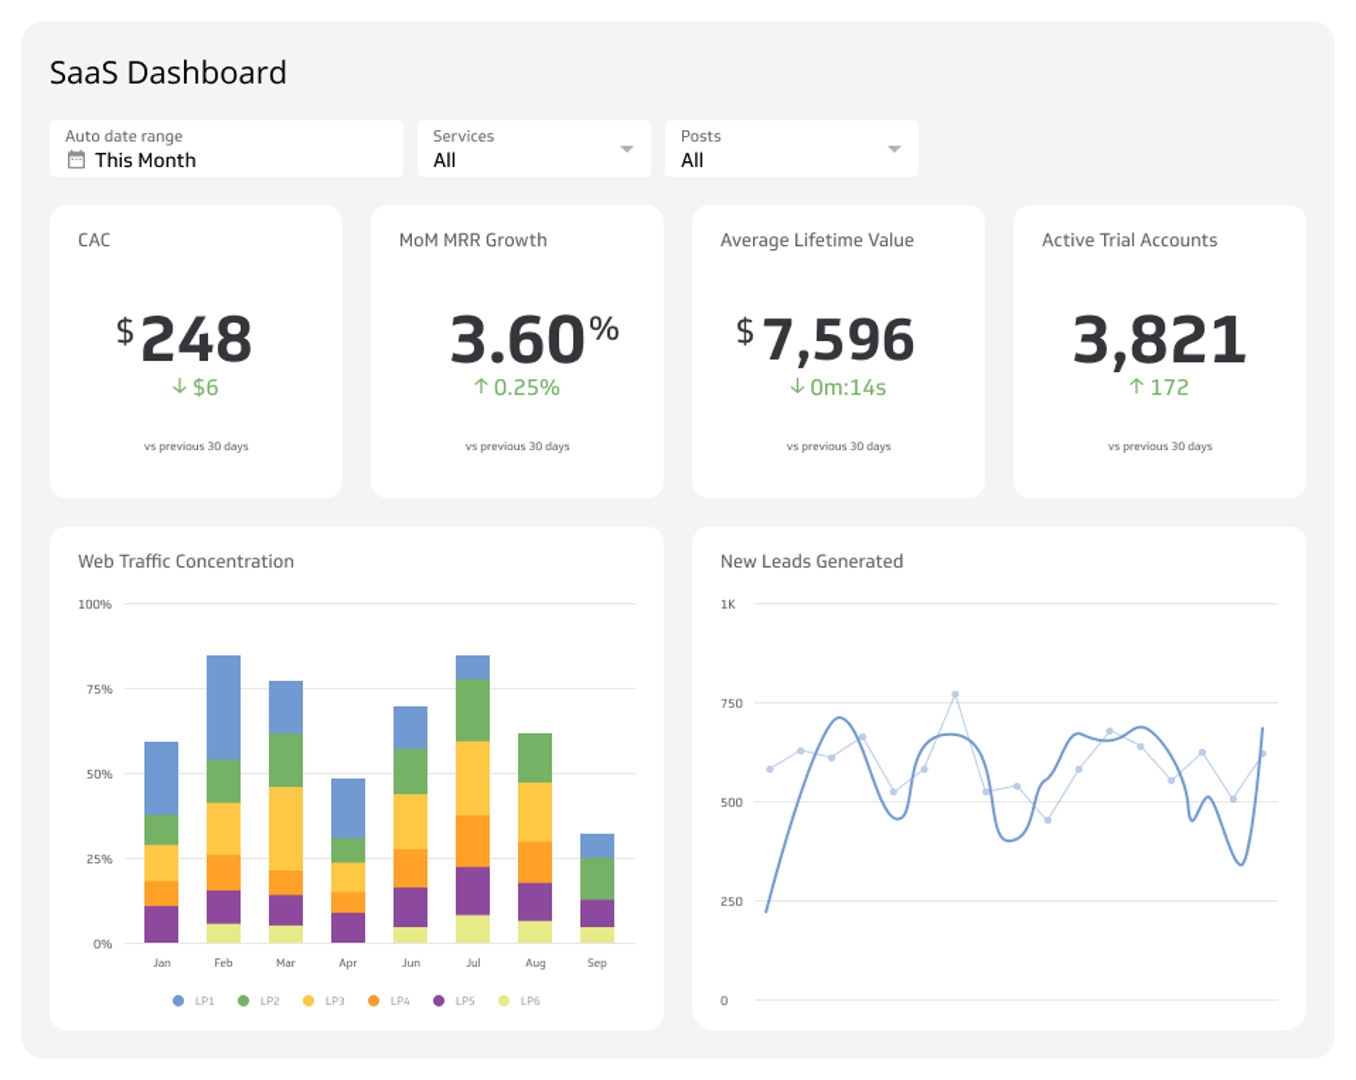
Marketing Key Performance Example (KPI) Examples
Marketing Key Performance Indicators (KPIs) help you evaluate the success of your marketing efforts and identify areas for improvement. These KPIs cover various aspects of marketing, from digital marketing channels and social media to email marketing and customer relationship management. Regularly monitoring these KPIs can help you refine your marketing strategy and optimize your campaigns for better results.
Return on Marketing Investment (ROMI)
ROMI measures the effectiveness of your marketing campaigns by comparing the revenue generated to the cost of the campaign. It helps you understand which marketing activities are most profitable, allowing you to allocate resources more efficiently.
Customer Acquisition Costs (CAC)
This KPI calculates the cost incurred to acquire a new customer. This KPI is crucial for understanding how much you're spending to grow your customer base and whether your marketing efforts are sustainable in the long run.
Conversion Rate (CVR)
Conversion rate is the percentage of visitors to your website or landing page who take a desired action, such as making a purchase or signing up for a newsletter. A higher CVR usually indicates a more effective marketing strategy.
Cost per Lead (CPL)
CPL measures the cost incurred for each lead generated through your marketing efforts. This KPI helps you understand the efficiency of your lead generation campaigns and whether they are worth the investment.
Cost per Acquisition (CPA)
This metric calculates the cost to acquire a customer through a specific marketing channel or campaign. It's a more specific version of CAC and helps you identify the most cost-effective acquisition methods.
Click-Through Rate (CTR)
CTR is the ratio of users who click on a specific link to the number of total users who view the ad or page. A higher CTR indicates that your ad or content is capturing attention effectively.
Net Promoter Score (NPS)
NPS measures customer loyalty and satisfaction by asking customers how likely they are to recommend your product or service. It's a key indicator of customer experience and potential for growth.
Average Time on Site (ATOS)
ATOS measures the average amount of time a visitor spends on your website. A longer average time usually indicates more engaging content and a higher likelihood of conversion.
Email Open Rate
With this KPI, you can measure the percentage of recipients who open your email. A higher open rate generally indicates a more effective email subject line and greater engagement with your audience.
Email Click-Through Rate (CTR)
This measures the percentage of email recipients who clicked on one or more links in an email. A higher email CTR suggests that your email content is relevant and compelling to the reader.
Email Conversion Rate
Email conversion rate shows you the percentage of email recipients who complete the desired action after clicking on a link in your email, such as making a purchase. It helps evaluate the effectiveness of your email marketing campaigns.
Social Media Engagement Rate
This measures the level of engagement your social media posts receive, including likes, shares, and comments. A higher engagement rate usually indicates more effective content and stronger audience connection.
Social Media Follower Growth
With this KPI, you can track the rate at which your social media following is growing. A steady increase in followers is a good indicator of the effectiveness of your social media strategy.
Social Media Reach
This measures the total number of people who have seen your social media posts. A larger reach increases the potential for engagement and conversion.
Net Profit Margin
This KPI measures the profitability of your marketing efforts by comparing net profit to revenue. A higher net profit margin indicates more effective marketing and greater financial health.
Marketing Qualified Leads (MQL)
MQLs are leads that have been deemed more likely to become customers compared to other leads based on lead intelligence. This KPI helps you focus your efforts on high-potential leads.
Website Traffic by Source
This KPI tracks the sources from which visitors are coming to your website, such as organic search, social media, or direct traffic. It helps you understand which channels are most effective in driving traffic.
Landing Page Conversion Rate
This measures the percentage of visitors to a landing page who take a desired action. A higher conversion rate indicates a more effective landing page design and offer.
Customer Lifetime Value (CLV)
CLV calculates the total value a customer is expected to bring to your business over their entire lifetime. This KPI helps you understand how much you can afford to spend on customer acquisition and retention.
Net Promoter Score (NPS)
NPS measures customer loyalty and satisfaction by asking customers how likely they are to recommend your product or service. It's a key indicator of customer experience and potential for growth.

Sales & Retail KPI Examples
The key performance indicator examples below encompass a diverse range of sales facets, including the generation of revenue, overall profitability, the management of customer relationships, and the efficacy of the sales team. By consistently evaluating these KPIs, it becomes possible to hone sales strategies and enhance the performance of the sales team, ultimately leading to more favorable outcomes.
Sales Revenue
This is the total income generated from sales of goods or services. It serves as the starting point for any sales analysis and is a critical indicator of business health and growth potential.
Gross Profit Margin
Gross profit margin is the percentage of revenue that exceeds the cost of goods sold. A higher margin indicates a more profitable business and provides room for growth and expansion.
Net Profit Margin
Net profit margin measures the percentage of revenue remaining after all operating expenses are deducted. It provides insights into overall profitability and financial efficiency.
Sales Growth Rate
Sales growth rate is the percentage increase in sales over a specific period. It's crucial for understanding the scalability of your business and for setting future revenue goals.
Average Deal Size
Average deal size refers to the average value of each sales transaction. A higher average deal size often indicates a more effective sales process and higher-quality leads.
Sales Qualified Leads (SQL)
SQLs are leads that have been vetted and are considered ready for the sales team to engage. This KPI helps prioritize leads and focus sales efforts on high-potential prospects.
Lead Conversion Rate
Lead conversion rate measures the percentage of leads that convert into paying customers. A higher rate indicates a more effective sales funnel and better lead quality.
Sales Pipeline Value
Sales pipeline value is the total value of all opportunities in the sales pipeline. It provides an estimate of future revenue and helps in resource allocation.
Win Rate (Closing Ratio)
Win rate is the percentage of deals that are closed successfully. A higher win rate indicates a more effective sales process and team.
Average Sales Cycle Length
This KPI measures the average time it takes to close a deal, from initial contact to final sale. A shorter sales cycle is generally more efficient and cost-effective.
Customer Retention Rate
Customer retention rate refers to the percentage of customers who continue to buy from you over a specific time period. High retention rates are indicative of customer satisfaction and loyalty.
Customer Churn Rate
Customer churn rate is the percentage of customers who stop buying from you during a specific period. A lower churn rate is ideal and indicates strong customer relationships.
Upsell/Cross-sell Rate
This KPI measures the percentage of existing customers who purchase additional products or services. A higher rate indicates effective sales and marketing strategies for customer expansion.
Average Revenue per User (ARPU)
ARPU calculates the average revenue generated from each user or customer. It's a key metric for understanding the value each customer brings to your business.
Quota Attainment Rate
This KPI refers to the percentage of sales reps who meet or exceed their sales quotas. A higher rate indicates a well-performing sales team and effective sales strategies.
Customer Lifetime
As mentioned, customer lifetime measures the total time a customer continues to purchase from your business. A longer customer lifetime indicates strong customer loyalty and higher lifetime value.
Cost per Acquisition (CPA)
CPA calculates the cost to acquire a customer through a specific marketing channel or campaign. It helps you identify the most cost-effective acquisition methods.
Sales Productivity
With this KPI, you can track the effectiveness of your sales team in generating revenue. It takes into account various factors like time spent on calls, meetings, and revenue generated.
Average Purchase Value (APV)
APV measures the average value of each transaction made by your customers. A higher APV indicates that customers are purchasing more expensive items or more items per transaction.
Customer Satisfaction Score (CSAT)
CSAT measures customer satisfaction through surveys and feedback. A higher CSAT score indicates higher customer satisfaction, which often leads to higher retention rates.
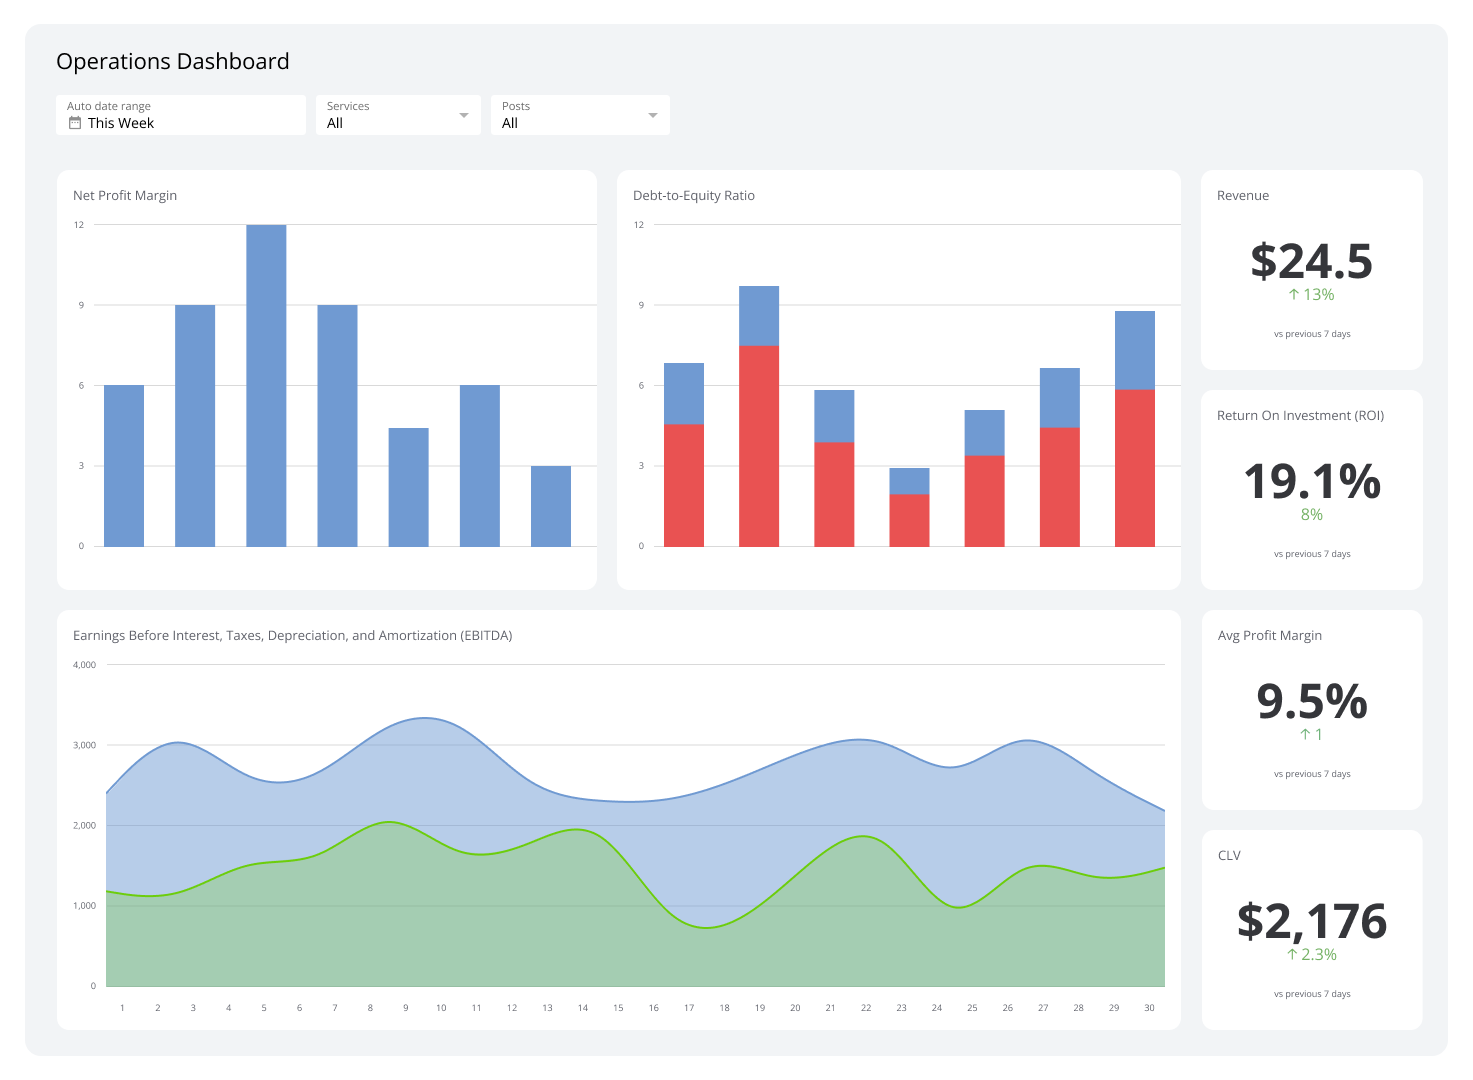
KPI Examples for Operations
These KPIs look at different parts of operations, like making things efficiently, keeping track of stock, and how well the business is doing with the money. By keeping an eye on these key performance indicator examples, you can make your operations better and help your business do even better overall.
Overall Equipment Effectiveness (OEE)
OEE measures the efficiency and effectiveness of your equipment. It combines availability, performance, and quality metrics to show how well your machinery is operating.
First Pass Yield (FPY)
FPY measures the percentage of products manufactured correctly the first time without the need for rework or repair. A higher FPY indicates a more efficient and effective production process.
On-Time Delivery (OTD)
OTD measures the percentage of products or services delivered on time to customers. High OTD rates improve customer satisfaction and can lead to increased loyalty and sales.
Production Downtime
This KPI tracks the amount of time production is halted, usually due to machine failures or maintenance. Reducing downtime is crucial for increasing efficiency and profitability.
Takt Time
This is the maximum amount of time allowed to produce a product in order to meet customer demand. It helps in balancing workloads and identifying bottlenecks in the production process.
Cycle Time
This KPI refers to the total time taken to complete a specific task or process from start to finish. Reducing cycle time can lead to increased throughput and operational efficiency.
Throughput Rate
Throughput rate measures the number of units produced per unit of time. Increasing throughput rate can lead to higher production volumes and potentially higher revenues.
Capacity Utilization
This KPI measures how effectively you're using your production capacity. Higher capacity utilization rates often indicate more efficient use of resources.
Labor Productivity
Labor productivity measures the output produced per hour of labor. Higher labor productivity can indicate more efficient work processes and can contribute to lower production costs.
Inventory Turnover
Inventory turnover measures how many times inventory is sold and replaced over a specific period. A higher turnover rate indicates better inventory management and stronger sales performance.
Operating Cashflow
Operating cashflow keeps track of the cash generated from core business operations. Positive operating cash flow is essential for covering operational expenses and for business growth.
Days in Inventory
This KPI measures the average number of days items stay in inventory before being sold. Lower days in inventory indicate faster inventory turnover and better cash flow.
Order Picking Accuracy
With this, you can measure the percentage of orders picked without errors. Higher accuracy rates improve customer satisfaction and reduce the costs associated with returns and corrections.
Return on Assets (ROA)
ROA measures the profitability of a company in relation to its total assets. A higher ROA indicates more effective use of assets to generate profits.
Return on Investment (ROI)
ROI measures the profitability of a particular investment relative to its cost. A higher ROI indicates a more successful investment.
Total Cost of Ownership (TCO)
TCO calculates the total cost of purchasing and operating a product over its lifetime. Understanding TCO helps in making more informed purchasing decisions.
Cost of Goods Sold (COGS)
COGS measures the direct costs involved in producing goods that have been sold. Lowering COGS can lead to higher gross profit margins.
Cost Variance
You should use the cost variance KPI to measure the difference between planned and actual costs. Understanding cost variance helps in better budget management and financial planning.
Waste Reduction Rate
This KPI measures the percentage reduction in waste materials in the production process. A higher waste reduction rate indicates more sustainable and cost-effective operations.
Employee Turnover Rate
Employee Turnover Rate measures the percentage of employees who leave the company in a given period. A lower turnover rate is generally indicative of higher employee satisfaction and lower recruiting costs.
Project Management KPIs
Paying attention to the below KPIs allows project managers to make better decisions, manage risks effectively, and ultimately deliver successful projects that meet or exceed stakeholder expectations.
Project Timeline (Schedule Variance)
This KPI measures the difference between the planned and actual project timelines. A negative variance indicates a delay, while a positive variance suggests the project is ahead of schedule. This KPI is crucial for assessing project efficiency and for stakeholder communication.
Budget Variance
It compares the estimated budget to the actual costs incurred. A positive variance indicates the project is under budget, while a negative variance means it's over budget. Monitoring this KPI helps in financial planning and risk mitigation.
Cost Performance Index (CPI)
CPI measures the cost efficiency of a project by comparing the budgeted costs to the actual costs. A CPI greater than 1 indicates a favorable cost performance, while a CPI less than 1 suggests cost overruns.
Schedule Performance Index (SPI)
SPI measures the schedule efficiency of a project by comparing the planned progress to the actual progress. An SPI greater than 1 indicates that the project is ahead of schedule, while an SPI less than 1 suggests a delay.
Scope Creep
Scope creep refers to uncontrolled changes or additions to a project's scope without corresponding increases in resources or timeline. This KPI is essential for maintaining project integrity and meeting original objectives.
Resource Utilization
To measure how efficiently project resources, such as manpower and materials, you should use this KPI. Higher utilization rates indicate more efficient resource management, which can lead to cost savings.
Earned Value (EV)
The earned value measures the value of the work completed up to a certain point against the original budget. It helps in assessing project performance and predicting future outcomes.
Actual Cost (AC)
This pertains to the total cost incurred for the project work performed during a specific period. Monitoring AC helps in budget control and future financial planning.
Planned Value (PV)
Planned value is the estimated cost for project activities planned to be completed by a specific time. It serves as a baseline for comparing actual performance and is crucial for budget management.
Estimate at Completion (EAC)
EAC provides a forecast of the total cost of the project at completion. It's vital for budget planning and for communicating with stakeholders about financial expectations.
Estimate to Complete (ETC)
ETC estimates the remaining costs needed to complete the project. This KPI helps in budget reallocation and in assessing whether additional resources are required.
Return on Investment (ROI)
As mentioned, ROI measures the profitability of the project by comparing the benefits gained against the costs incurred. A higher ROI indicates a more successful project in terms of financial returns.
Risk Exposure
Risk exposure quantifies the potential impact of identified project risks. It helps in prioritizing risks and in developing appropriate mitigation strategies.
Change Requests
This KPI tracks the number and nature of changes requested during the project. Monitoring change requests helps assess scope creep and its impact on the project.
Team Productivity
It measures the output per team member over a specific period. Higher productivity levels indicate effective team management and can lead to faster project completion.
Stakeholder Satisfaction
Stakeholder satisfaction measures the level of satisfaction among project stakeholders, including clients, team members, and investors. High satisfaction levels are often indicative of project success.
Quality Metrics
Quality metrics, like Defect Density and Rework, measure the quality of the project's deliverables. Lower defect density and less rework indicate higher quality and greater customer satisfaction.
On-Time Completion Rate
This KPI measures the percentage of project tasks completed on time. A higher rate indicates effective schedule management and a greater likelihood of overall project success.
Project Milestone Achievement
You can track the number of project milestones reached on time using this KPI. Achieving milestones as planned is crucial for maintaining project timelines and stakeholder confidence.
Project Health
Project health is a comprehensive KPI that combines schedule, budget, scope, and quality metrics. It provides a holistic view of project performance and is crucial for decision-making and stakeholder communication.
Your Guide to Informed Decision-Making
KPIs are more than just buzzwords; they are the lifeblood of effective business management. We hope our comprehensive guide has helped you understand the complex world of KPIs. Remember to tailor the KPIs you’re measuring to your business goals to ensure that you focus on what truly matters for your organization's success.
