GoSquared
Connect GoSquared to Klipfolio Klips and bring your web analytics, CRM, and live chat data into one automated dashboard — no manual exports needed.
Tracking web analytics across multiple tools is exhausting. Connecting GoSquared to Klipfolio Klips puts your visitor data, CRM activity, and live chat metrics into one automated dashboard — no manual exports required.
How to connect GoSquared to Klipfolio
You'll need your GoSquared API Key and Project Token before you start. Here's how to find both.
Find your API Key:
- Log in to your GoSquared account.
- Click the Settings tab.
- Go to Your Account > API Access.
- Click Add a new API Key if none exist, then copy the key.
Find your Project Token:
- Log in to your GoSquared account.
- Click the Settings tab.
- Click Current Project.
- Scroll to the Project Token field and copy the value.
Connect GoSquared in Klipfolio:
- Go to the Service Connectors page and select GoSquared.
- Choose a pre-built data source or click Create a custom GoSquared data source.
- Enter your API Key and Project Token on the configuration page.
- Click Get data, confirm the data looks right, then click Continue.
- Name your data source, set a refresh schedule, and click Save.
View the step-by-step setup guide
Top reasons to use Klipfolio for GoSquared dashboards
See everything in one place. Pull GoSquared analytics alongside CRM and live chat data so your team gets a complete picture of visitor behaviour without switching tools.
Stop rebuilding reports manually. Scheduled data refreshes keep your dashboards current — from every minute to every 24 hours — so the numbers are always ready when you need them.
Share insights your way. Distribute dashboards via TV mode, public links, embedded views, or scheduled PDF emails. Every stakeholder gets the data in the format that works for them.
Customize without limits. Use Excel-like formulas and the Klip Editor to model, transform, and visualize GoSquared data exactly the way your team needs it.
Start fast with pre-built Klips. Browse ready-made GoSquared visualizations in the Klip Gallery and add them to your dashboard in minutes.
GoSquared and Klipfolio: what changes
| What you do in GoSquared | What Klipfolio adds |
|---|---|
| View analytics inside the GoSquared app | A centralized dashboard combining GoSquared with your other data sources |
| Manually pull reports for team updates | Automated dashboards that refresh on a schedule and distribute themselves |
| Switch between analytics, CRM, and chat tabs | A single view that surfaces all three alongside any other metric you track |
| Export data to build charts elsewhere | 30+ visualization types built directly from your live GoSquared data |
Stop stitching together reports. Start dashboarding GoSquared data automatically — view the setup guide to get started.
Use pre-built GoSquared metrics
Assemble a GoSquared dashboard by selecting pre-built metrics from the Klip Gallery.
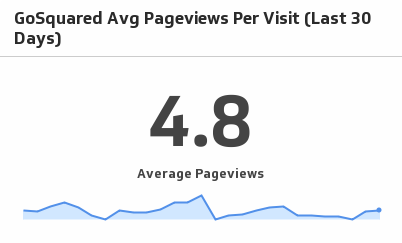
Avg Pageviews Per Visit (Last 30 Days)
See traffic trends unfold as you monitor average pageviews per visit over the past 30 days.
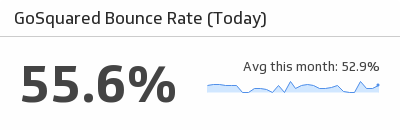
UsesGoSquared Bounce Rate
Monitor your website’s bounce rate for the last 30 days.
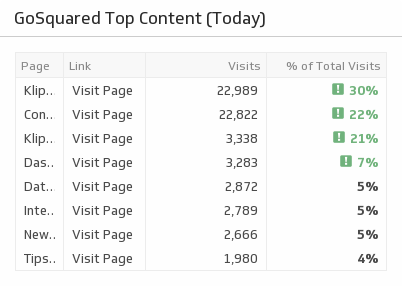
UsesTop Content Today
Understand which website pages generated the most traffic in the last 30 days.
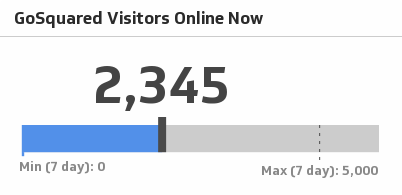
UsesVisitors Online Now
Monitor your website's current number of online visitors.
UsesVisits (Last 30 Days)
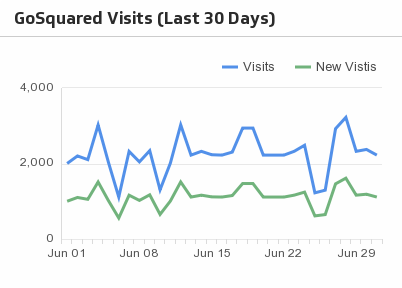
Compare visits with new visits over the past 30 days.
UsesVisits by Country
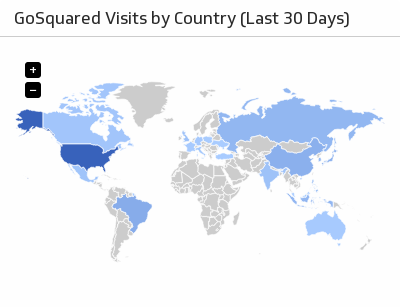
Visualize visits to your website by country, for the last 30 days.
Uses