SEO KPIs and metrics: 17 key examples to track
Track 17 essential SEO KPIs to measure and improve your search engine optimization performance
Track all your SEO KPIs in one place
Sign up for free and start making decisions for your business with confidence.
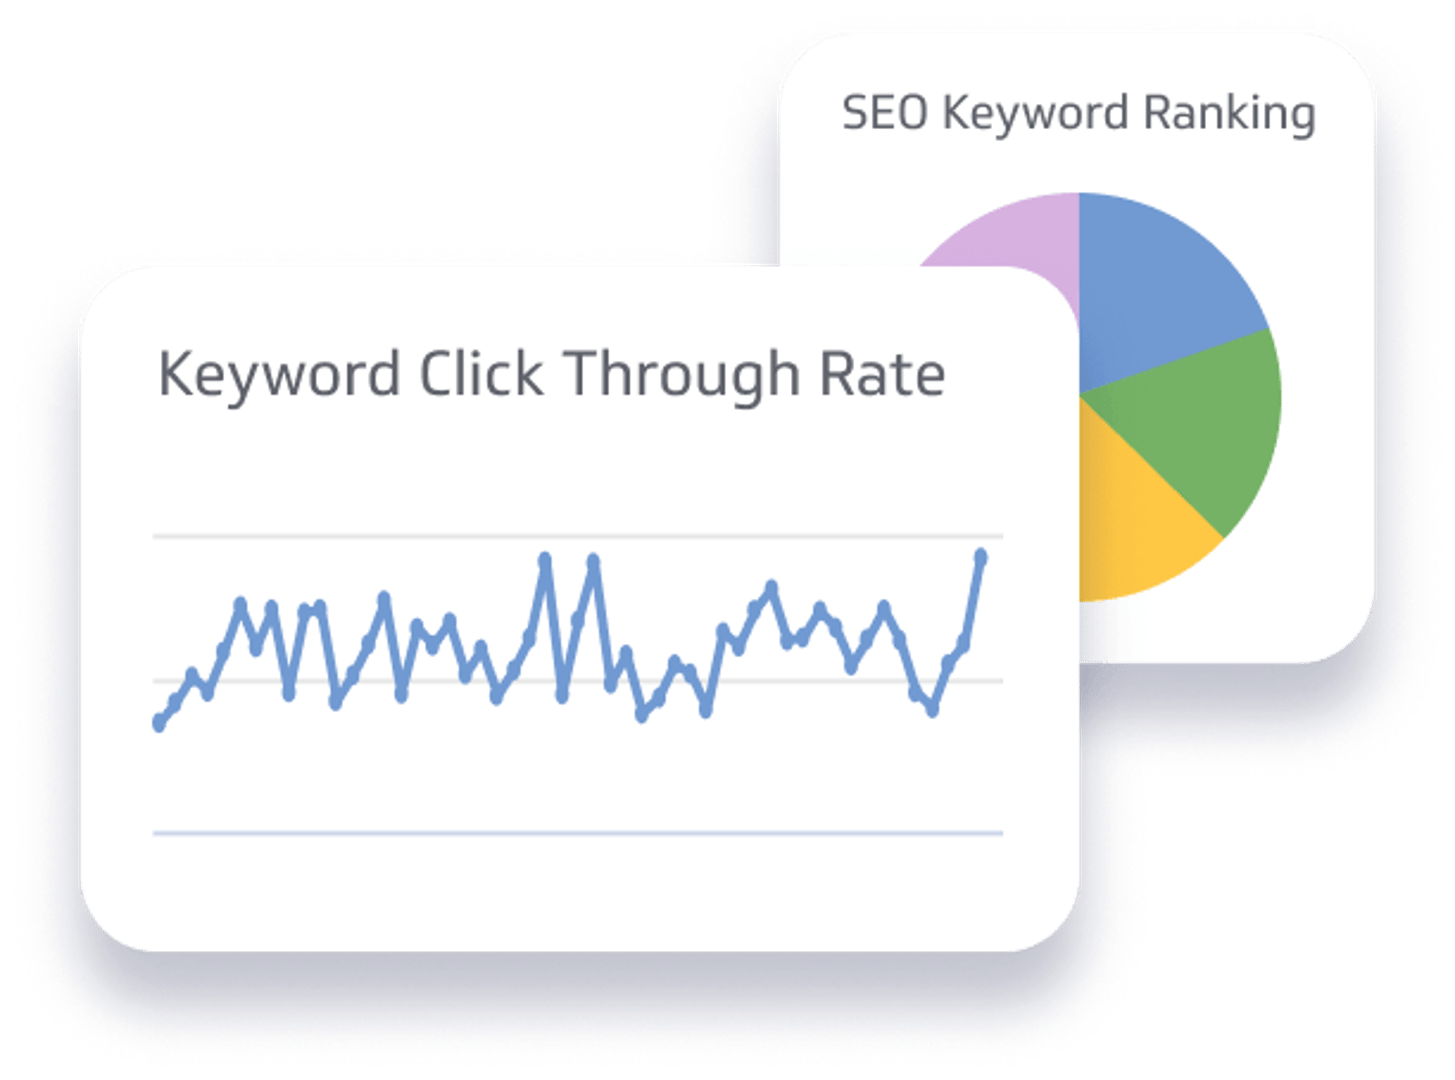
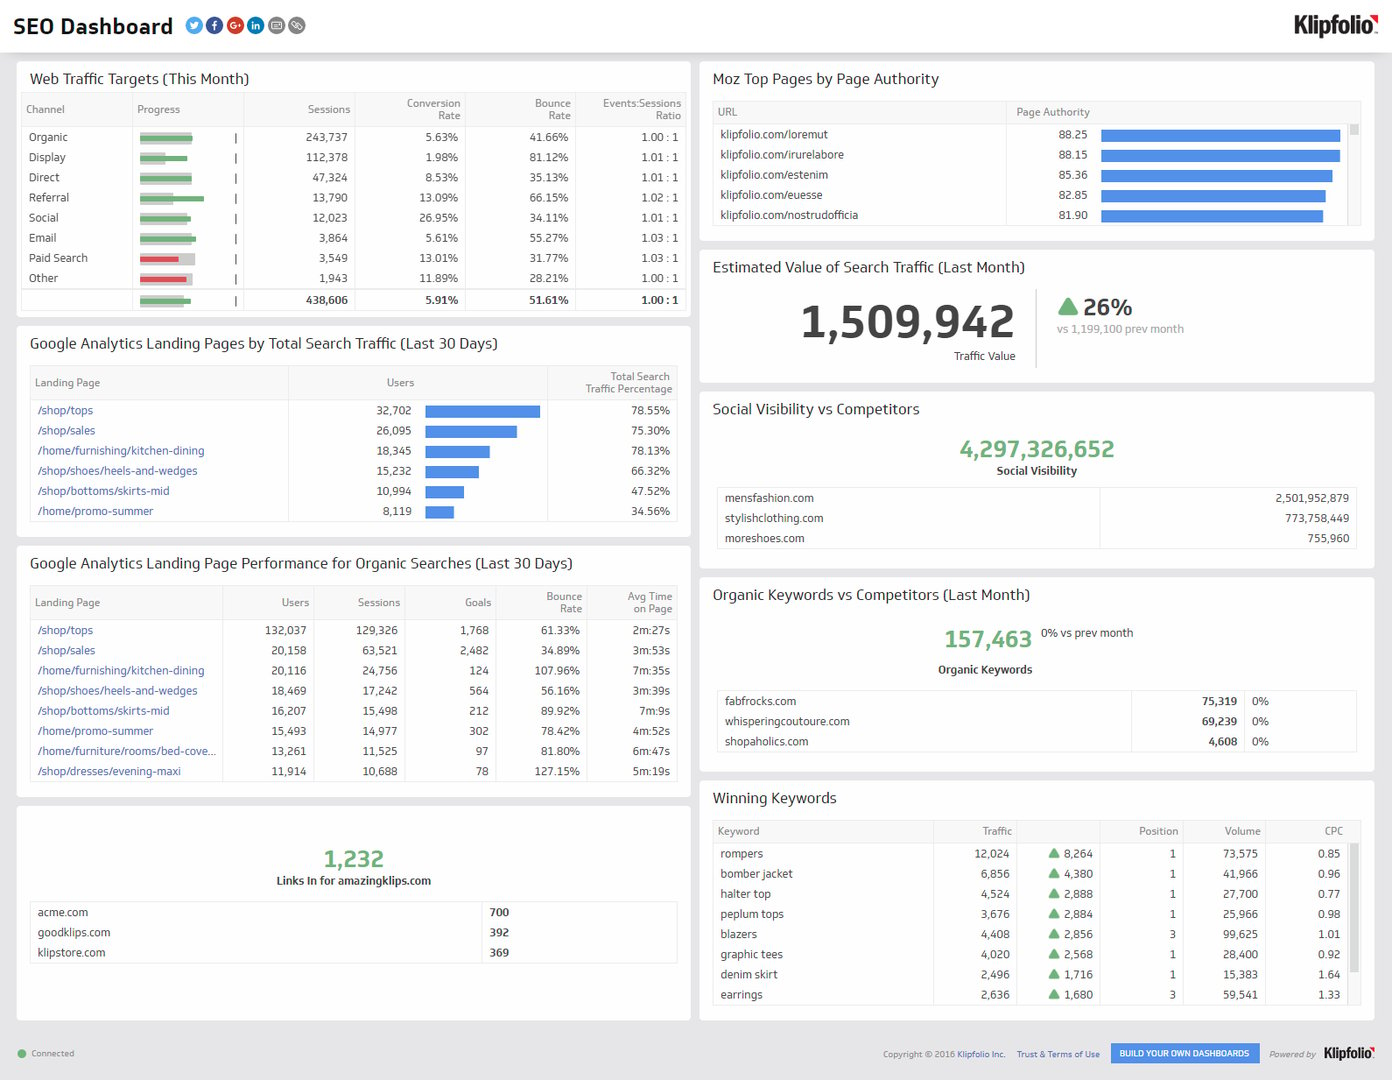
SEO KPIs (Key Performance Indicators) are measurable values that assess the effectiveness of your search engine optimization efforts. Tracking the right SEO KPIs helps you improve organic traffic, keyword rankings, conversion rates, backlink building, and more.
What are SEO KPIs?
SEO KPIs are measurable values that assess the effectiveness of your ongoing SEO strategies. They act as guideposts, showing you where to improve organic traffic, keyword rankings, conversions, and backlink profiles.
Why SEO KPIs matter
Tracking KPIs gives you clear insight into what's working and what isn't across your website. These metrics reveal the effectiveness of your keywords, content optimization, and other SEO activities that drive outreach and sales.
With SEO KPIs, your team can identify specific areas for improvement, make data-driven decisions, and track progress over time.
How to define the right SEO KPIs
To drive meaningful insights, identify KPIs that meet four criteria: aligned with your strategy, actionable, realistic, and measurable.
Each department uses different KPIs based on specific business goals. For marketing, you'll focus on things like bounce rate, backlink quality, and organic visibility. The next section covers the specific KPIs worth tracking for SEO.
17 key SEO KPIs to track
Here are the 17 key SEO KPIs that businesses commonly track:
Organic Visibility
Organic Traffic Lead Conversions
Overall Sales Conversion Rate
Organic Traffic by Location
Keyword Rankings
Bounce Rate
Backlinks
Page Load Time
User Engagement
Average Engagement Time on the Specific Page
Social Signals
Click-Through Rate (CTR)
Google Business Profile Metrics
Site Architecture and Internal Links
Cost Per Acquisition
SEO ROI
Branded vs. Non-Branded Traffic
1. Organic visibility
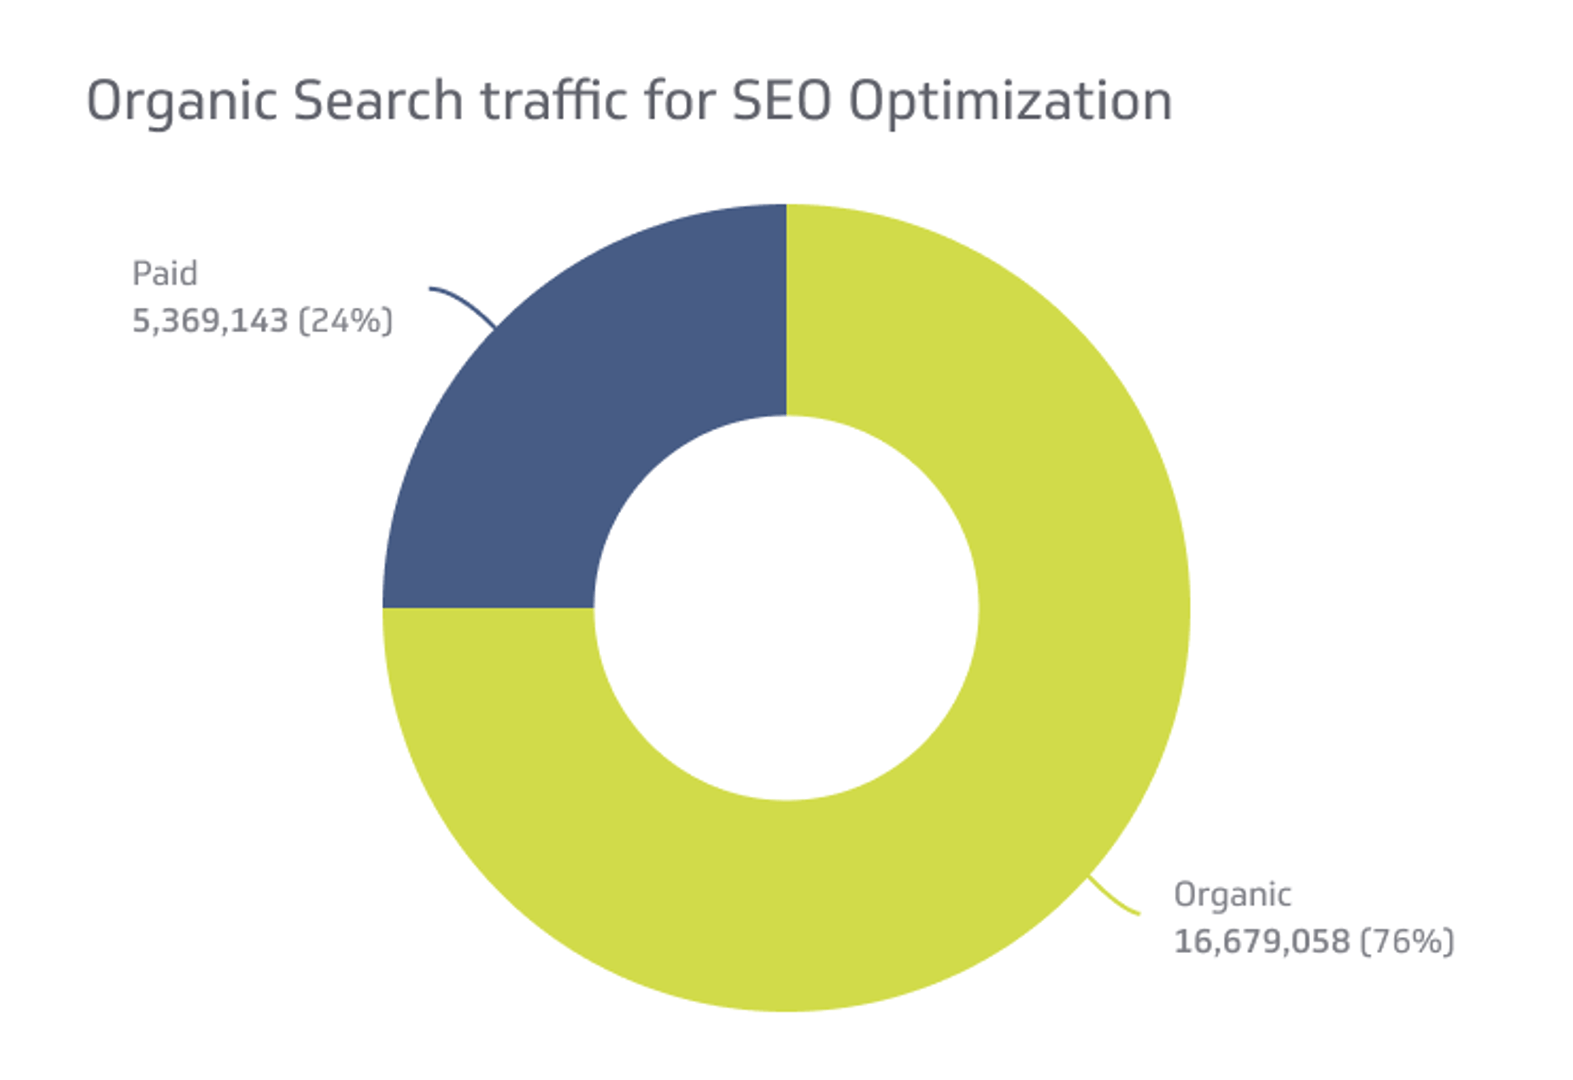
Organic visibility measures how well your brand appears in search results when users search for your brand or related topics. It reflects your "share of voice" in search, and it extends beyond the traditional ten blue links on a search engine results page (SERP).
Organic visibility also encompasses SERP features such as local packs, knowledge panels, and featured snippets. Although it's a non-conversion metric, it closely correlates with business growth.
To track organic visibility, use Google Search Console. It shows your search impressions over a specific timeframe, reflecting how often your website appeared in results even without a click. Tools like Ahrefs' Rank Tracker add keyword-level visibility data.
Improving organic visibility increases your potential reach, helping you attract more targeted organic traffic over time.
2. Organic traffic lead conversions
Organic traffic lead conversions measure how many visitors from search become actual leads. They bridge your marketing efforts and revenue generation.
Lead conversions from organic traffic typically include:
Subscribing to a newsletter
Filling out a contact form
Downloading a whitepaper or ebook
Making a purchase
Requesting a quote
These actions signal that a visitor has moved further through the sales funnel toward becoming a paying customer.
Google Analytics 4 is the primary tool for tracking and interpreting this data. Navigate to the Admin section, access the Events feature, and designate specific events as conversion indicators.
One important distinction: lead conversions are the total number of leads, while the conversion rate is the percentage of those leads relative to your total organic traffic. The conversion rate gives a more accurate picture of SEO effectiveness.
3. Overall sales conversion rate
The overall sales conversion rate measures the percentage of leads that convert into paying customers. It directly reflects your business's ability to generate revenue from its marketing efforts.
A high conversion rate means you're effectively turning leads into customers. A low one may signal issues in your sales funnel or gaps in your marketing strategy.
Calculating sales conversion rate
Divide the number of converted leads by the total number of leads, then multiply by 100. For example: 45 customers from 100 leads = a 45% conversion rate.
CRM software or a sales tracking tool helps you monitor lead progress through each funnel stage and calculate the conversion rate at each step. Improving lead quality, follow-up processes, landing pages, and SEO strategy all influence this rate.
4. Organic traffic by location
Tracking organic traffic by location shows which geographical areas offer the most growth potential, so you can allocate resources accordingly.
Physical businesses: For businesses with a physical presence, location tracking provides insight into the effectiveness of local SEO. Adding UTM parameters to your Google Business Profile listing lets you distinguish between traffic from general search results and traffic from the Local Pack or Google Maps.
Non-physical businesses: If you don't have a physical location, measuring SEO traffic by location still helps you identify regions where your site attracts the most visitors. That data guides content creation, local keyword targeting, and location-specific landing pages.
Understanding your traffic's geographical distribution helps you refine local SEO initiatives and improve visibility in the markets that matter most.
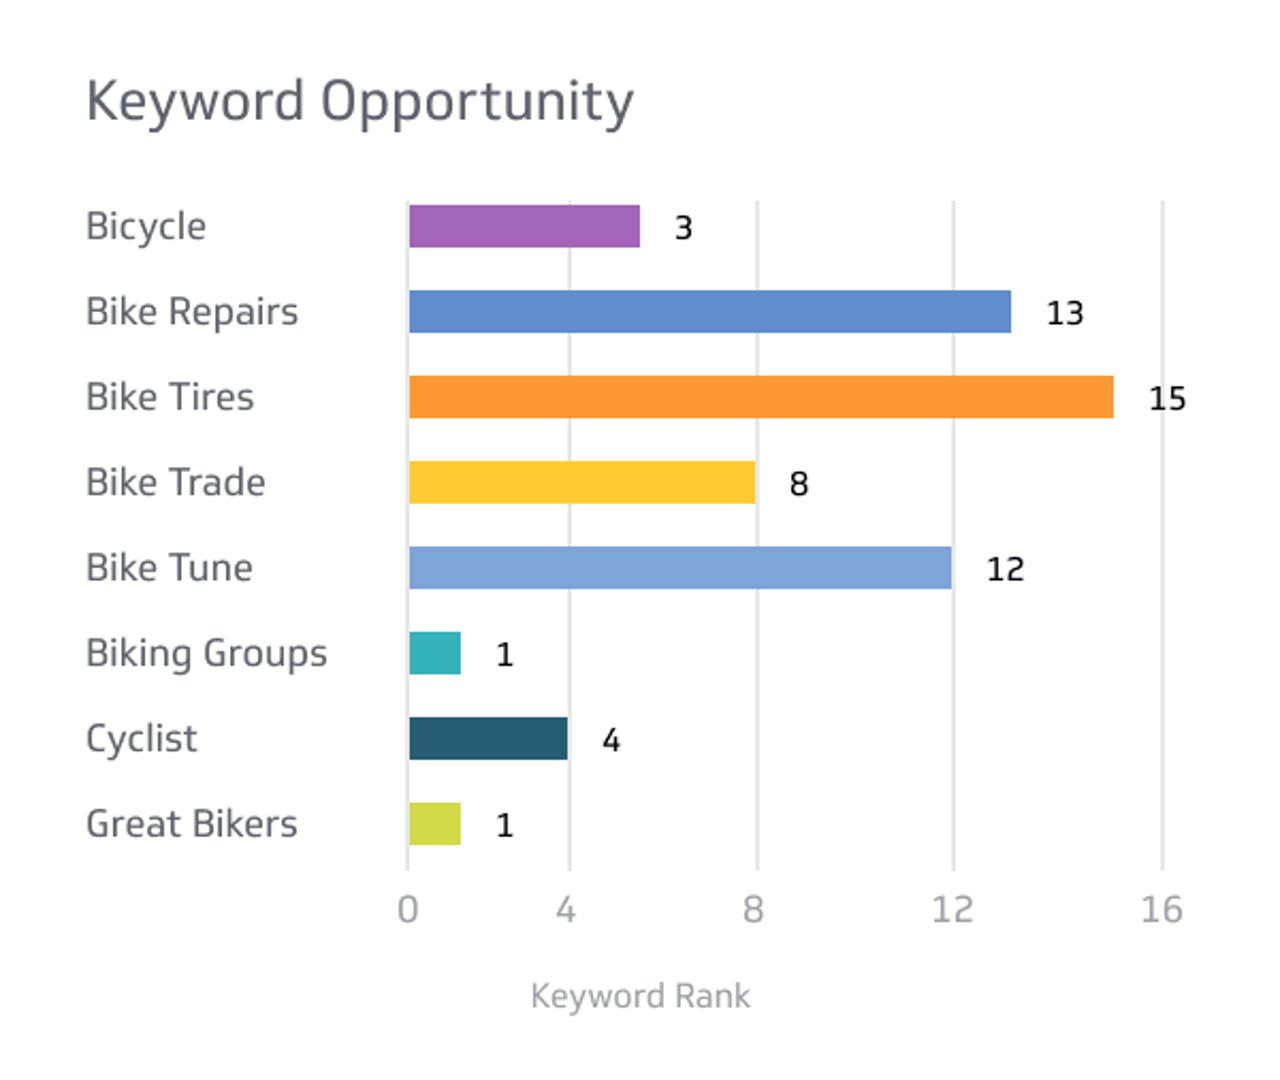
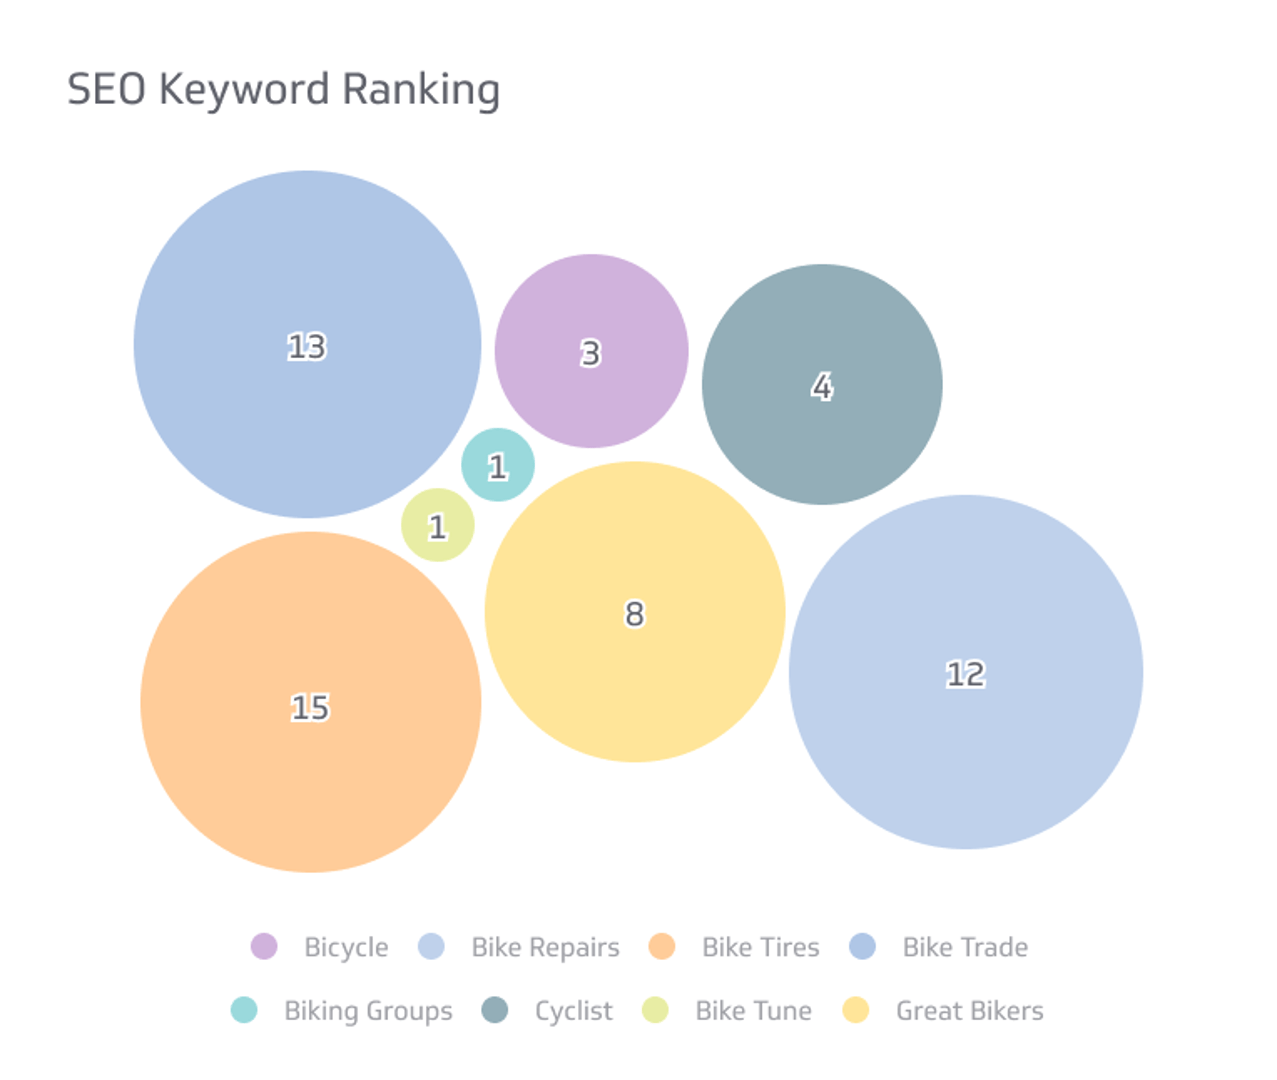
5. Keyword rankings
Keyword ranking is a fundamental SEO KPI. It shows how well your website performs in search results for the terms your audience is searching.
With the rise of semantic search, a single page can rank for many keywords and search contexts, not just the one you optimized for. Monitoring keyword rankings helps you identify which terms drive the most traffic and influence business outcomes.
Rankings in the top three search results attract the majority of clicks. Tracking your position on the first page tells you whether your content is visible enough to generate meaningful traffic. Tools like Ahrefs, Google Analytics, and SEMrush provide ranking data, flag fluctuations, and surface opportunities for improvement through link building strategies and content updates.
6. Bounce rate
A website's bounce rate is the percentage of users who visit a page and leave without taking any action. It's a straightforward indicator of how well your content matches what visitors were searching for.
A high bounce rate often signals that a page isn't capturing visitor interest, which leads to missed conversion opportunities and can negatively affect search rankings.
Track bounce rate in Google Analytics 4 by going to Reports > Engagement > Pages and screens. Review both your overall site bounce rate and the rate for individual pages, especially high-value ones like landing pages and blog posts. Reducing bounce rates improves user engagement, increases the likelihood of conversion, and supports stronger long-term rankings.
7. Number and quality of backlinks
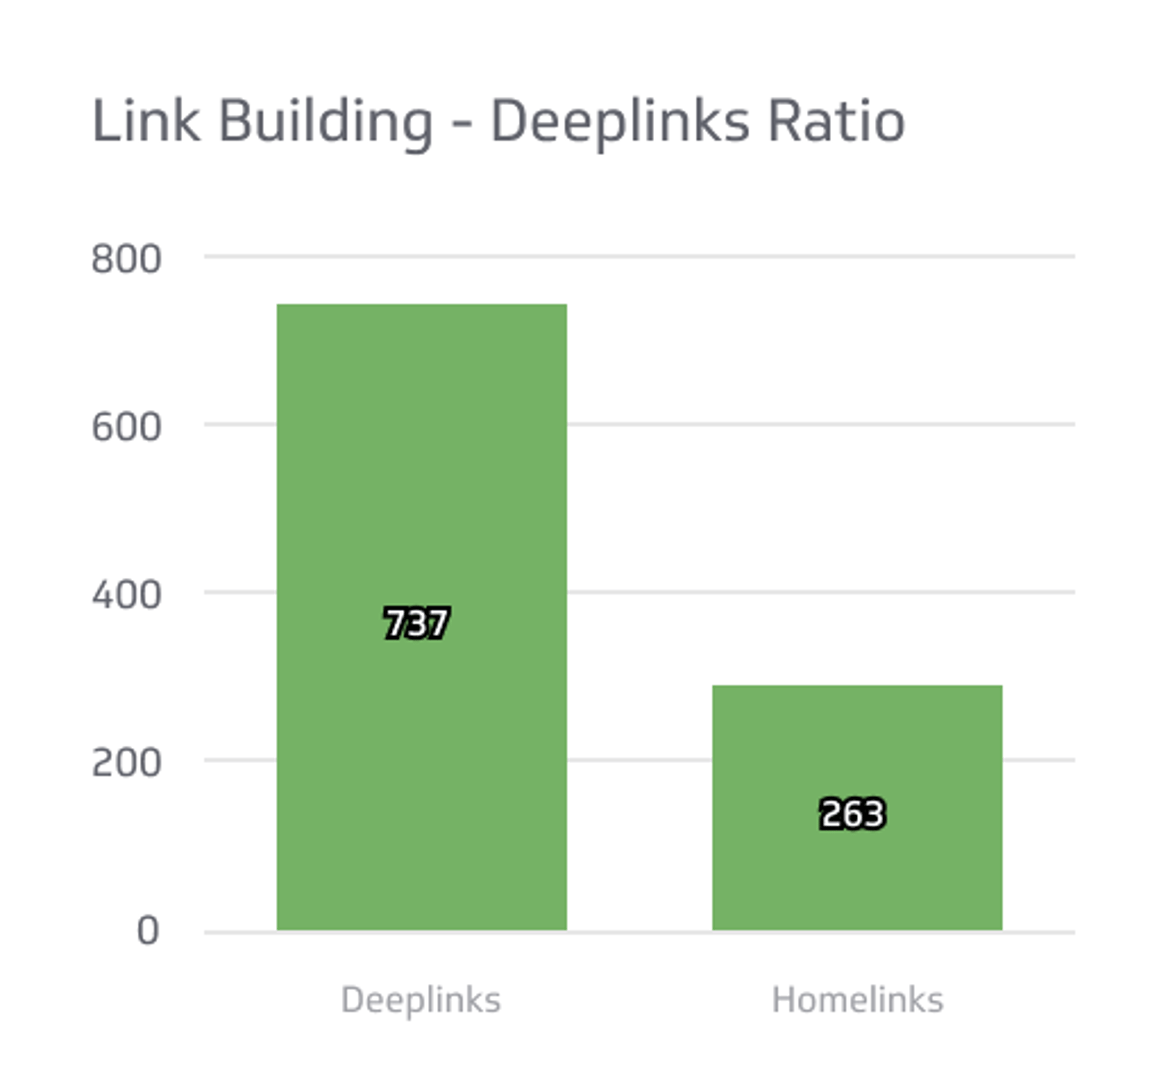
Backlinks are hyperlinks on other websites that point to yours. Google treats them as one of its most important ranking factors because they signal credibility and authority. Think of them as letters of recommendation from other sites.
When assessing your backlink profile, track these metrics:
Number of referring domains
Total backlinks
New links gained over a period
Links lost over time
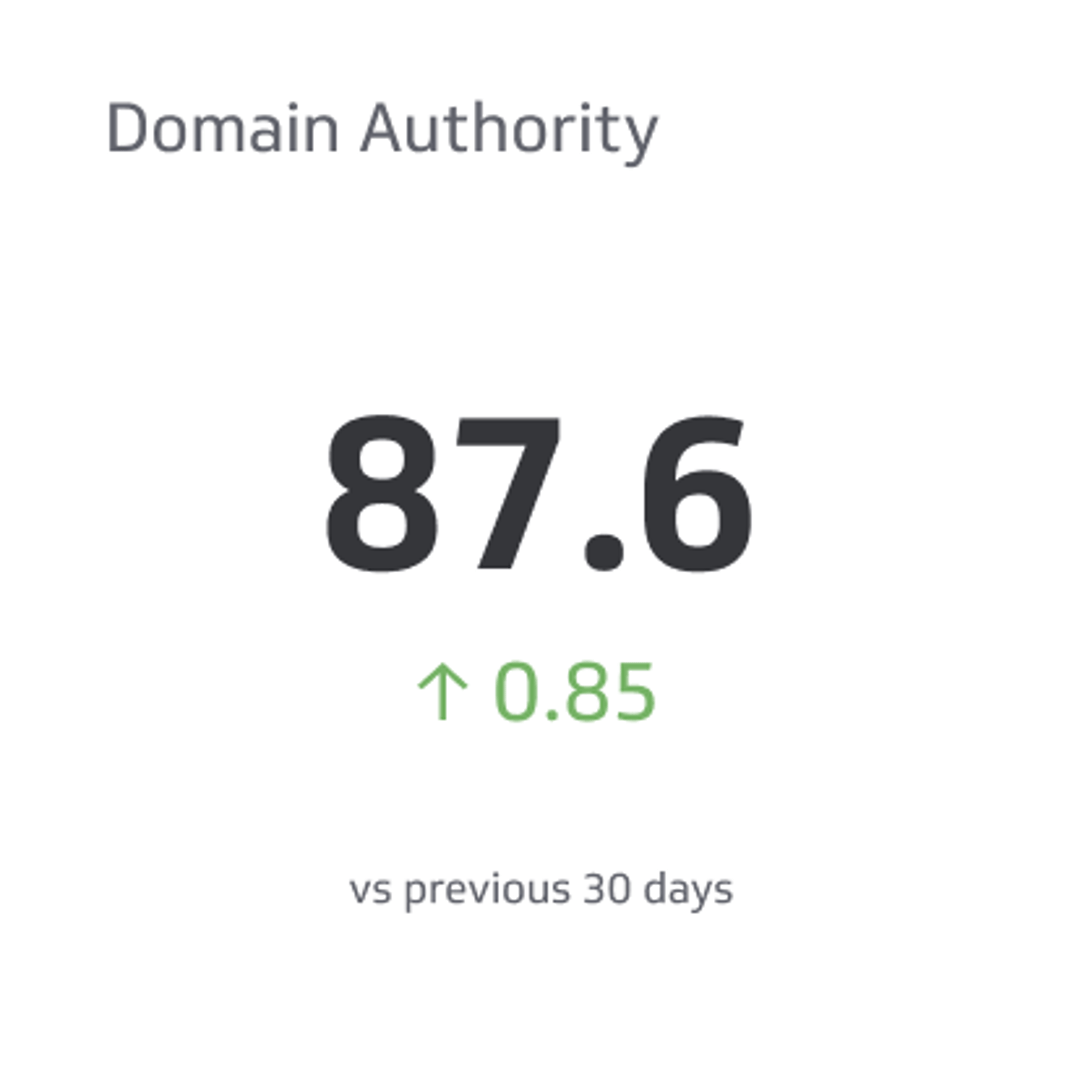
Quantity matters, but quality matters more. Backlinks and domain authority from reputable, authoritative domains carry far more weight than links from low-quality sites.
Tools like Ahrefs, SEMrush, and Moz provide data on backlink count, domain authority, referring domains, toxic score, and spam score. To build backlinks, focus on creating valuable content that earns links naturally, guest blogging, and building relationships with relevant site owners. You can also review SEO strategies for additional link-building approaches.
8. Page load time
Page load time directly affects user experience, bounce rate, and search rankings. Research shows that most visitors will leave if a website takes longer than three seconds to load. Google recommends under two seconds for e-commerce sites.
Large images, videos, and GIFs are common culprits for slow load times. Use PageSpeed Insights to identify performance issues across devices and platforms.
Strategies to improve page load time include:
Optimizing image sizes
Leveraging browser caching
Minimizing server response time
Reducing the number of HTTP requests
Faster load times reduce bounce rates, improve engagement, and support better search engine rankings.
9. User engagement
User engagement covers a range of metrics that reflect how visitors interact with your website. These include average time on page, session duration, bounce rate, and pages per session.
Engagement metrics are most useful when segmented by page and traffic source. Context matters: a high average time on page might indicate strong content on an informational site, or confusing content on a conversion-focused page.
Tracking organic clicks by queries and pages shows which search terms generate the most traffic and which pages attract the highest click-through rates from search results. Session duration reflects how long users spend on your site across multiple pages; over 75 seconds generally indicates engagement, while under 30 seconds may suggest the content isn't matching user intent.
Track user engagement metrics consistently and compare seasonal trends year over year to understand behaviour over time.
10. Average engagement time on a specific page
Average engagement time on a specific page measures how long users stay on and interact with a single page after arriving from any source. It's a more precise signal than overall session duration for evaluating individual pages.
Search engines prioritize content that users find valuable, so low engagement can hurt rankings. If users leave quickly, conversion opportunities are also lost. High average time on a page, especially when your content outperforms competing pages, signals to search engines that your content aligns with searcher intent.
Track this in Google Analytics 4 by going to Reports > Engagement > Engagement Overview.
11. Social signals
Social signals are the interactions and engagements your content receives across social media platforms. Likes, shares, comments, and reposts all reflect how people respond to your content.
When a business receives positive engagement on platforms like Facebook, LinkedIn, or X (platform), it signals that the content is relevant and useful. This drives more users to the website, encourages sharing, and builds brand recognition. Social signals support organic traffic growth and can improve visibility in search results by amplifying content reach.
12. Click-through rate (CTR)
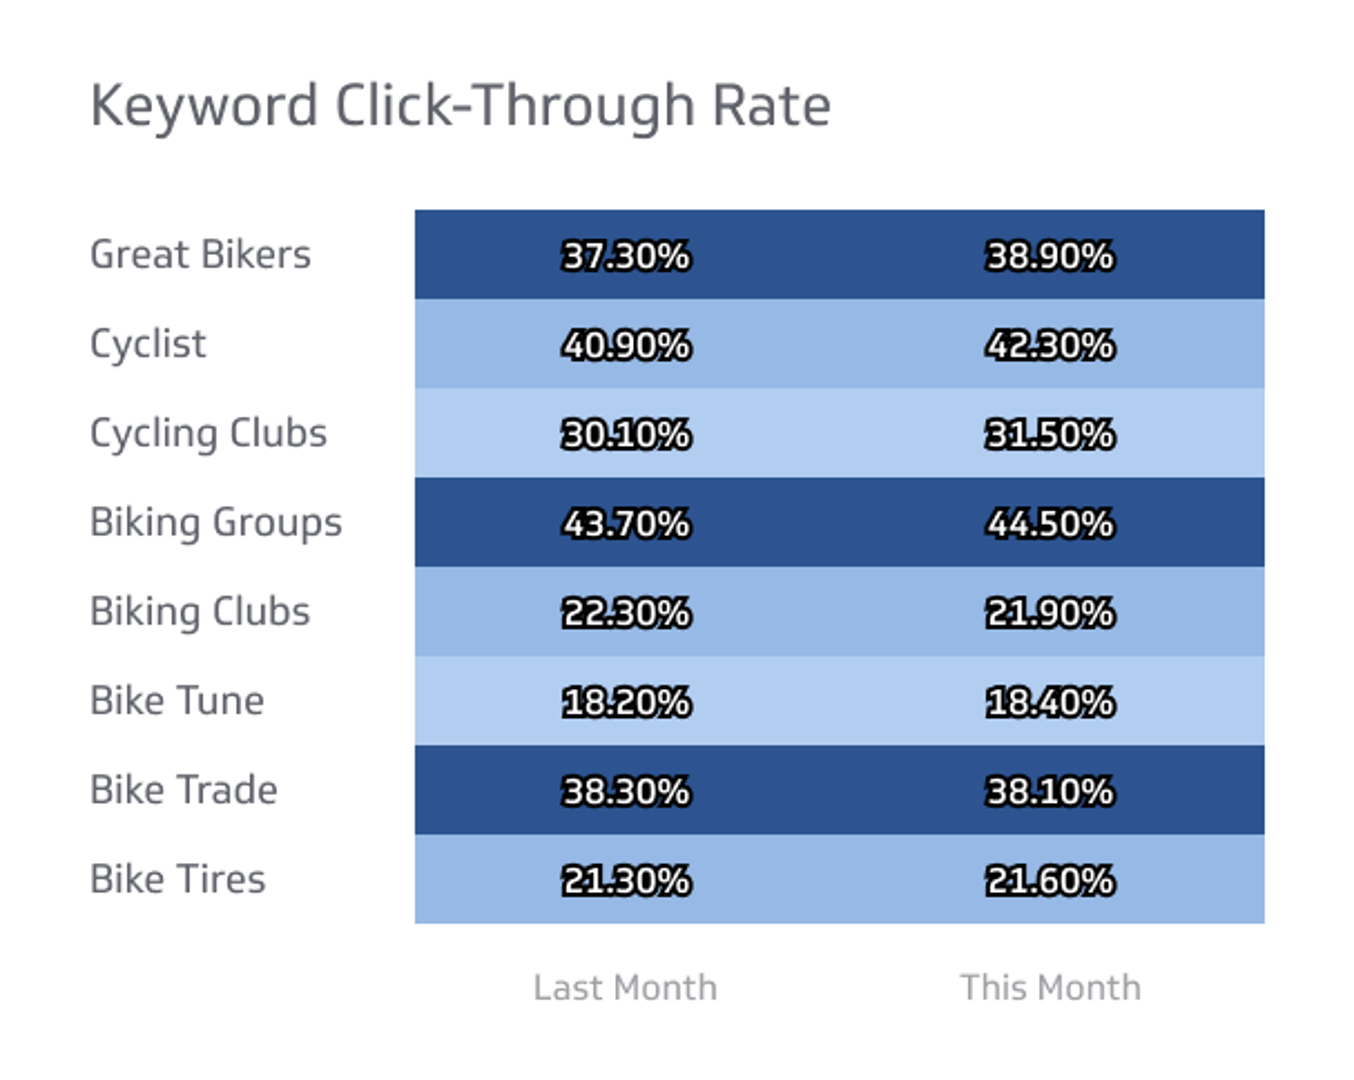
Click-through rate (CTR) measures the percentage of users who click on your listing after seeing it in search results. The higher your ranking, the higher your expected CTR.
While CTR isn't a confirmed direct ranking factor, it's a reliable indicator of how well your title tags and meta descriptions resonate with searchers. Use Google Search Console's performance report to analyze CTR at both the page and query levels. Monitoring and improving CTR increases traffic to your pages and helps you assess whether your search listings are compelling enough to earn clicks.
13. Google Business Profile metrics
Google Business Profile (previously Google My Business) helps businesses manage their online presence and is especially valuable for local SEO.
Once your profile is set up, the platform automatically tracks metrics including:
Searches: How often your profile appears
Views: Impressions on your listing
Clicks: Traffic driven to your website
Calls: Phone inquiries from your listing
Direction requests: Navigation actions from your profile
Monitoring these metrics lets you measure the impact of your profile optimizations, identify trends, and adjust your local strategy based on what's driving customer interactions.
14. SEO-optimized site architecture and internal links
Site architecture and internal links form the structural foundation of your website. Good architecture lets search engine crawlers index your pages efficiently and helps visitors find what they need quickly.
Internal links create pathways between related pages, helping search engines understand your site's content relationships and improving your ability to rank for target keywords. A well-structured site distributes authority across pages and supports a clear content hierarchy. Audit your site architecture and internal linking regularly to ensure important pages are accessible, well-connected, and easy to crawl.
15. Cost per acquisition
Cost per acquisition (CPA) measures what it costs to acquire a single converting user through your SEO efforts. SEO costs include tools, team salaries, agency fees, link building, and content production.
Evaluating CPA alongside customer lifetime value (CLV) helps you understand whether your acquisition costs are sustainable. A high CPA may indicate your budget is going toward content targeting the wrong keywords or audiences unlikely to convert.
Because SEO takes time to produce results, track CPA over an extended period rather than in isolation. Use CPA data to reallocate resources toward the keywords and audience segments that generate the most conversions and the strongest return on investment.
16. SEO ROI
SEO ROI quantifies the financial return from your SEO investments. It measures the value generated by organic conversions relative to what you've spent on SEO.
Calculating SEO ROI:
(Value of organic conversions ? Cost of SEO investments) / Cost of SEO investments × 100
Measuring SEO ROI takes time. Depending on the initiative, it can take several months to a year or more to see the full impact of efforts like landing page optimization or content campaigns. Pair ROI analysis with other KPIs, such as organic traffic, conversions, and keyword rankings, for a complete view of your SEO performance.
17. Branded vs. non-branded traffic
Branded traffic comes from users who already know your business and search for it by name. Non-branded traffic comes from users who find you by searching for the products or services you offer, without knowing your brand beforehand.
Non-branded traffic is the more relevant SEO KPI because it reflects how effectively your SEO strategy reaches new audiences. Use advanced filters in tools like SEMrush's Organic Research to separate branded from non-branded searches. By filtering out your company name, you can assess how many visitors found you through product or service queries alone.
Track the SEO KPIs that move your business forward
Start with the KPIs most closely tied to your current goals, build a reporting rhythm, and adjust your strategy based on what the data tells you. The metrics above cover the full picture, from visibility and engagement to conversions and ROI.