

Summary - A content strategy is only as good as the content metrics it's guided by. Here is a comprehensive list of content metrics for those in journalism, content marketing, and related fields.
Over the years I've met hundreds, possibly thousands, of writers that are working somewhere at the increasing intersections between journalism and content marketing.
Some of these writers are full-time content marketers (like me) who pursue independent journalism opportunities as they arise (I focus on international investigative journalism). Other writers are full-time journalists but are frequently helping out in their media company's content marketing division.
Wait, what?
It's true. Even the savviest purveyors of the media often aren't aware that some of the world's greatest and most historic news organizations are now offering content marketing solutions on the side as a way to increase and diversify their revenue.
Essentially these traditional journalism organizations saw that they had the resources brands were craving (researchers, storytellers, videographers, etc.) and they built out content marketing agencies that now compete with standalone content marketing agencies to work with brands.
Reuters, for example, offers Reuters Plus, an "award winning full-service custom content studio" that "delivers the best in editorial and multimedia production across digital and real-world platforms wherever you are."
NBC offers NBCU Content Studio, which "develops and produces content for advertising clients utilizing NBCU's creative talent, data, distribution, and scale" and "is creating a new blueprint for storytelling across all genres."
And even The New York Times runs T Brand Studio, a brand marketing unit that creates "content and experiences that spark imagination and influence the most influential audiences around the world."
However, while those of us who are pursuing some sort of fusion between journalism and content marketing can attest, there are still deep chasms between how each industry speaks to, learns from, and works with each other.
The result is that we have content marketers talking about content marketing metrics and journalists talking about editorial and journalism metrics—and each side often does so without recognizing what one industry may be able to teach the other.
What are content metrics?

There are a few fundamental questions shared by those in journalism and those in content marketing:
- How do I measure content performance?
- What about content is actually worth measuring?
- How do I measure the performance of a content campaign?
All of these questions have to do with metrics, "the science of measurement." Which means that content metrics are simply ways of measuring the performance of content—be it an individual piece such as this post, a content series that may involve many different types of content assets, or even an entire content campaign that may run for months or years.
Knowing the right content metrics for your particular content strategy, then, is critical to understanding how your content is performing. And understanding how your content is performing is at the heart of how many businesses—from traditional newspapers now embracing digital to modern SaaS startups—are able to survive and even thrive.
My own journey into content metrics

My initial foray into content marketing grew during my time as an independent journalist covering human rights issues throughout Asia. To be more specific, it grew from the pain I felt at not being able to answer those fundamental questions—and the pain in knowing that whichever media outlet accepted my piece likely didn't have the content marketing capacity to answer those questions either.
The moment happened in Chittagong, Bangladesh. I was investigating the notorious shipbreaking yards that are known for child slavery and some of the most egregious examples of environmental degradation. The yards are where many of the western world's polluted oil tankers and vacation cruise liners are sent, upon being retired, to be broken down into pieces.
I was there without the power of a media company's backing. Or a team.
Alone and at one point with machine guns pointed at me (and even into my back) by the guards who work at the yards to ensure that journalists can't get in (and from what I saw that children can't escape), I had a kind of existential breakdown.
First: What am I doing to myself?
Second, upon returning to a hostel after that first day at the yards, And what's the point? Nobody will even read this.
On the lack of readership... I knew I'd write the hell out of the piece. But I also knew the publisher likely wouldn't have the marketing chops (I sure didn't) to give it the reach it deserved—to drive that piece of content toward key metrics.
This was a time, and unfortunately for many publishers it still is that time, when many media companies were playing the quantity game. If they could publish 20 terrible articles a day, they believed, this was far better for their bottom line (which was propped up by ad impressions) than even 10 stellar pieces of content.
Good content metrics
While it would have been easy to say "best content metrics," the truth is, as with all metrics and KPIs, the "best" is determined by the objectives you've established in your content strategy. The best content metrics, say, for T Brand Studio, may not even be considered by our scrappy team here at Klipfolio.
I came up with these good content metrics by talking with journalists and content marketers, sifting through much of the latest research out there, and simply having been working at the journalism/content marketing intersection for a few years now.
From there and while sticking to digital content metrics, I culled out both the weaker metrics and those that are perhaps best suited for another post (such as ratio of reads to display ad clicks), and then alphabetized the remaining content metrics.
Because content serves a function at every stage and layer of a business (from in-app reads and length of video watched to advertisement and post-paid subscription content metrics), some of these metrics may be familiar and obvious to you (pageviews, for example) while others (such as CAC) may seem like a metric more-suited for the company's CEO.
Jay Baer, author of Youtility, speaks often about thinking of content metrics in terms of four categories:
- Consumption Metrics
- Sharing Metrics
- Lead Generation Metrics
- Sales Metrics
As you comb through, it may be worth grouping the content metrics you deem important into those 4 categories (if applicable).
And before the list, some inspiration from poet William Carlos Williams:
so much depends / upon / a red wheel / barrow
In other words, don't try to measure all of these content metrics.
So much depends / upon / your content / strategy.
You can click on each content metric to be taken to information further down the page about that metric.
The list of content metrics
- Average time on page
- Average time on site
- Average value per customer
- Backlinks and external mentions (sorted by authority)
- Bounce rate
- Concurrent (or real-time) visits
- Content consumption to free subscription or free trial %
- Content downloads (gated or not)
- Content ROI
- Customer acquisition cost (CAC)
- Editorial cadence
- Email click-through rates
- Email open rates
- Entry rate
- Exit rate
- Free subscription to paid subscription or win %
- Keywords by ranking
- Number of visits and time since last visit
- Number of sales qualified leads
- Organic visitors
- Page referrals by channel
- Page speed
- Pages read per visit
- Percentage of returning vs. new visitors
- Production and distribution costs
- Reader engagement and attention time
- Reader feedback and comments
- Recirculation %
- Referred traffic
- Revenue of content
- Scroll depth
- Session duration
- Social following growth
- Social likes and favorites
- Social reach and impressions
- Social retweets and shares
- Team participation
- Time to publish
- Total page views
- Unique visitors
Average time on page
The average amount of time a reader spends on a particular page. This metric is tough to assess with a small sample size (let's say you have two readers who open the page and don't close the page for an hour), but once you have a reasonable sample size in place this can become a content metric that allows you to assess one component of user engagement.
Average time on site
While many content creators track average time on particular pages, average time on site is a content metric that allows you to see the overall time a content consumer spends on your site. From here, and using Google Analytics or other tools, you can drill down and see which pathways readers are taking. As Andy Crestodina often says, "If your website were a city, there would be a highway flowing through it."
Average customer lifetime value
This metric answers the question: When someone becomes a customer, how much do they typically pay until they are no longer a customer?
Through the lens of content, this metric can be critical because if you know a typical customer comes in through a $10 monthly subscription but typically stays 2 years, you'll know that 1 customer = $240. This can help you determine how much you're willing to spend to acquire customers.
One way to calculate this: Gross Margin % X ( 1 / Monthly Churn ) X Avg. Monthly Subscription Revenue per Customer.
For more on this, visit our Customer Lifetime Value page.
Backlinks and external mentions (sorted by authority)
High-quality backlinks and external mentions are signs that your content is resonating. It's also perhaps the best way to signal to Google that you are an authoritative domain on a particular topic.
For example, search engines are likely to rank your article about business metrics (and your future articles on similar topics) higher if Forbes and Entrepreneur are linking back to your site in regards to that term.
Tools like Moz and SEMrush allow you to see your backlinks and mentions, and easily sort them by domain authority.
Bounce rate
Not to be confused with exit rate, bounce rate is single-page visits of your site divided by all visits to your site. The result is a percentage of all visits in which a content consumer viewed one page and then left the site.
Concurrent (or real-time) visits
This is the amount of readers on your site right now. This can be especially valuable for high-traffic publications and blogs that may want to reorganize content on their homepage to take advantage of a particular article's spike in engagement.
Content consumption to free subscription or free trial %
This content metric answers the question: How much content does a typical content consumer engage with on my site before signing up for a free subscription/newsletter?
Knowing, for example, that your typical subscriber reads 30-40 pieces of content before they subscribe can help you carve out a patient content strategy that strives to maximize trust over time. This also allows you to experiment and find ways of maintaining editorial integrity while trying to lower the consumption number before subscription.
Content downloads (gated or not)
This metric shows the overall amount of content downloads over time. Depending on your content strategy, some of these downloads may simply be a "Would you prefer to download this article and read it later? Click here."
Or they may be gated, such as when the content consumer is asked to fill out information and possibly subscribe to your publication in order to obtain the content. Either way, knowing this content metric (and the metrics surrounding this metric) is often critical for overall publication and subscription growth.
Content ROI
This metric determines the return on investment of each individual piece of content. There are a variety of formulas out there, and they vary significantly by depth.
For example, you can factor in everything from the time it took to write the article and the overall production costs (including employee salaries) to how much you spend on paid channels to market that piece of content.
To find the ROI, you'll then need to measure how many dollars (likely through sales/paid subscriptions) that piece of content generated, and subtract all of the costs associated with producing and distributing it.
Customer acquisition cost (CAC)
CAC measures the costs of acquiring new customers by adding up all content production costs for a given period, and dividing them by the number of new customers for that period.
The result is that you'll know exactly how much it costs to gain one paying subscriber/customer.
For more on this metric, see our CAC page.
Editorial cadence
This content metric can be flexible, but I like to think of it in terms of published articles. From there, you can determine the most important parts of your editorial cadence. Do you publish 1 post a day? How much time does that take? How long have you continued that cadence? What are all the moving parts necessary to maintain this cadence, and how can they be optimized?
Email click-through rates
This is the ratio of subscribers that open and then click on the links in your email compared to those that either open but do not click or do not open at all.
Email open rates
This is the ratio of subscribers who open your email compared to those that do not.
Entry rate
This the percentage of visitors that enter in through a particular piece of content.
Exit rate
This the percentage of visitors that exit through a particular piece of content.
Free subscription to paid subscription or win %
This is the percentage of subscribers who have signed up for a free content subscription (such as a company blog) and then moved into a premium (paid) subscription or became customers of your product.
Keywords by ranking
As Chris Wolski wrote back in November 2016, we had content ranking among the top 3 on page one of Google for over 1,300 different search queries—and this included many featured snippets.
This is a key content metric, especially for inbound-focused journalists, media companies, and content marketers who care about the long-term reach of their content.
There are many tools to help you on this front, including Larry Kim's WordStream.
Number of visits and time since last visit
This metric tracks a particular user's behavior—from total number of visits to when they last visited. Knowing this time in between can help journalists and content marketers spot trends, and eventually help them find ways to better organize/group content so it's best tailored to the needs of their readers.
Number of sales qualified leads
As the team at SearchSalesforce put it:
"A sales-qualified lead (SQL) is a prospective customer that has been researched and vetted—first by an organization's marketing department and then by its sales team – and is deemed ready for the next stage in the sales process."
All leads are not created equal, and this content metric allows you to create net new content and even optimize existing content so that it's better equipped to attract SQLs.
Organic visitors
This metric captures the traffic that is coming to your content by way of a search engine (and excludes paid opportunities). Some content creators also include traffic from social media and/or other external sources in this metric.
Page referrals by channel
This metric answers: Which channel is driving the most traffic to your site and/or to the particular pieces of content on your site?
It's worth knowing, for example, that a hyperlink you received in a major publication outlet isn't driving any traffic but that a social media platform in Japan that you've never heard of is driving a ton.
This can allow journalists and content marketers to create new relationships and create processes for tailoring their content so that it may get picked up by certain channels.
Page speed
The time it takes a specific page to load. The easiest way to test this is to submit the URL into PageSpeed Insights, Pingdom Website Speed Test, and GTmetrix.
Pages read per visit
This content metric tells you how many pages are typically read per reader's visit. This metric, when applied across your entire content domain, can help paint a picture of engagement.
Knowing this metric can also help you find opportunities to create quality content-to-content transitions for your readers, and in turn reduce your bounce rate.
Percentage of returning vs. new visitors
How many content consumers have been on your site before, and how many are first-timers? This metric can help you unlock new content angles and, when paired with similar content metrics, can help you ask deeper questions such as:
Based on what we know of returning visitors, how can we optimize the experience for new visitors so that they become returning visitors?
Production and distribution costs
This metric answers how much it costs, from start to finish, to both produce an original piece of content and then to share that piece of content (either by paid or unpaid means).
Reader engagement and attention time
Many people I talked to see "engagement" as the % of readers who stayed on a page longer than 15-30 seconds, and see "attention" as a metric more about true engagement with the content (scrolls, clicks, pinches, swipes, and other on-page interactions).
Reader feedback and comments
How often are readers reaching out to you via email, or commenting either on the post or on social media?
This metric takes engagement to a new level, but can obviously be difficult to create a standard of measurement for. Still, some content creators I talked to take this metric seriously as an "impact metric."
If your content is meant to start a conversation, but there aren't any commenters, are you succeeding?
Recirculation %
Journalists often view this metric as the % of readers who read one piece and then immediately read another.
However, this can also include metrics around content syndication.
For example, if two other blogs picked up and republished your article, how many unique readers did they all get? Reach out to the republisher, get those details, and then add all of these metrics up to determine your true recirculation reach.
Referred traffic
Many see this as the total amount of traffic brought to your site from sources other than a search engine. This includes social media platforms and external outlets.
Revenue of content
A subset metric of Content ROI, this allows you to determine how much revenue a piece of content brought to the company. A simple example may be that you had 5 people purchase your $100 report.
A more challenging example would be to track how many subscriptions were generated from a free piece of content, and how many of those subscribers moved into a paid subscription or paid version of your product.
Scroll depth
How far a reader scrolled down your page. This metric is especially useful for longform journalists and content creators.
Session duration
This content metric measures the total duration of all sessions (in seconds) / number of sessions.
To understand the difference between time on page and session duration, check out this article from Analytics Edge.
Social following growth
The growth (typically in number of followers) of your social media channels. This metric can also measure other factors of growth, such as the growth of reach and impressions over and compared to a period of time.
Social likes and favorites
How many likes and favorites your content receives. This metric does not include shares.
Social reach and impressions
Social media platforms all have and create their own algorithms for calculating reach and impressions. Tracking these over time can give you a glimpse into how your social media growth (in followers, for example) is or is not tied to the reach of your content on each platform.
Social retweets and shares
The number of times content consumers have shared your content with their social media audiences.
Team participation
This is another flexible metric, but several journalists and content marketers I've talked to see a direct link between internal (company-wide) excitement and sharing of content and the overall net impact of that content.
Team participation, therefore, could simply be either all social shares by colleagues or the % of those internal social shares in relation to overall social shares.
Time to publish
How long does it take to go from idea to publication? This can obviously vary significantly per piece, but if your editorial cadence demands the publication of one 1500-word article each day, this content metric can help you determine your productivity.
Time-tracking apps like Toggl can help in this regard.
Total page views
The number of overall page views, including same-visitor page views, over a given period of time.
Unique visitors
The number of overall page views, excluding same-visitor page views, over a given period of time.
Some final thoughts on content metrics
There are many content metrics I didn't cover here, including many that result from blending one or more of those that I did cover.
There are also certainly plenty of content metrics that I completely missed (I'd be happy to add them here!).
Then there are those content metrics that I intentionally excluded either because they can be more difficult to measure and/or because they lean towards being more organizational content metrics, such as:
- Media inquiries per piece of content
- Public perception over time
- # of content pieces per stage of funnel
Additionally, as with many metrics, the content metrics presented here aren't always perfect, can be tweaked, and are subject to human error—such as simple miscalculations or assuming a social share meant the sharer actually read the piece (indeed, people are often more willing to share a piece than actually read it).
Some of the content metrics are softer than others, such as team participation. For these type of metrics, I encourage you to see that softness as flexibility, and to then create your own way of measuring it.
For team participation, this may be something as simple as combing through social media and figuring out the average content shares per colleague. For time to publish, this could be tracking completed tasks in Trello.
I've come to see dashboard software as the best way to monitor these content metrics, especially for editorial and content marketing teams. If you can see your metrics updating in real-time and potential opportunities to rank higher, your content strategy is bound to improve.
Such dashboards can take hours and sometimes a few days to set up, but once they are good to go you'll immediately begin saving time, increasing transparency, and improving your content team's overall productivity.
Here at Klipfolio, we worked closely with Andy Crestodina (one of the smartest content marketing minds I've met) to create the Content Effectiveness Dashboard. It allows content creators to spot opportunities and double-down on what's working. Here's a glimpse:
Interactive Example of the Content Effectiveness Dashboard
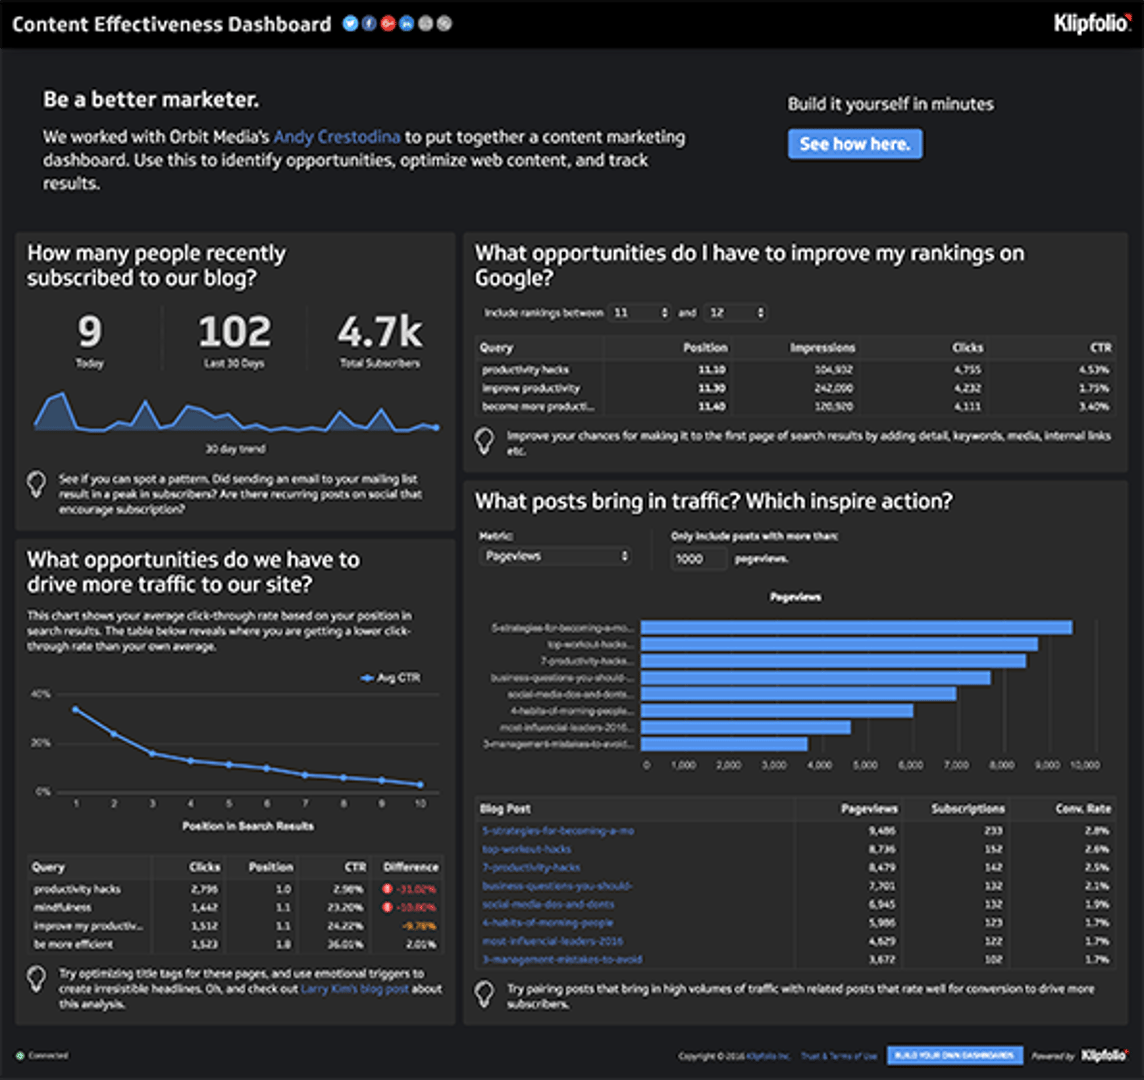
View the full dashboard
In his content marketing audit article, Andy walks you through a step by step process for finding your traffic champions, your conversion champions and what to do about them.
Coupled with assessing the content metrics presented in this article, I encourage journalists and content marketers to assess what may be considered their momentum metrics. This is one way to get a glimpse into the overall throughput of your content team.
Lastly, if you believe any of these content metrics are critical to your business, be sure to properly communicate their worth to your team, officially establish them as KPIs, and begin your journey of building them into your content team's culture.
Also see:
15 common KPI questions: Quick insights on the basics
How financial KPIs are helping me travel the globe for 6 months
Related Articles

5 tips to understand (and organize) your restaurant data
By Saleem Khatri — June 9th, 2026
6 Facebook ads reports every agency needs to attract and retain high-ticket clients
By Tanya Brody — April 10th, 2026
6 dashboards I use daily to run my SaaS company
By Allan Wille, Co-Founder — April 10th, 2026
