
Summary - Looking to build an algorithm for your business? Use this step?by?step guide to go from problem definition to deployment, with clear examples and tips you can apply right away.
In modern business, an algorithm is a key factor in automating tasks and solving complex problems efficiently. While most of us know the term, creating one and outlining the steps involved can be confusing. In this article, we’ll introduce the more technical aspects of algorithms to you and how you can build them for your business’s specific needs.
Introduction to algorithms
An algorithm is a set of instructions that performs a task, from data analysis to decision‐making. By breaking a problem into smaller steps, you create a systematic path to a result.
Algorithms help uncover patterns that affect performance. If you need to improve processes, solve complex problems, or automate repetitive work, understanding how to build and apply algorithms pays off.
For example, in a business setting, an algorithm can streamline data processing so analysts spend more time interpreting results instead of doing manual calculations.
For business analysts, algorithms can automate large datasets to surface patterns and trends. Marketers can personalize customer experiences by analyzing behaviour and preferences.
Algorithms must also consider time complexity, which measures how runtime increases with input size. Efficient algorithms minimize time complexity so they run quickly even with large datasets.
Is an algorithm a step‐by‐step sequence?
Yes. An algorithm follows a logical sequence from inputs to outputs so the task is performed accurately and efficiently. By breaking complex problems into smaller steps, algorithms provide a structured approach to problem‐solving.
Each step must be designed to minimize time complexity and maximize performance. This lets the algorithm handle different inputs efficiently while providing correct, reliable outputs.
For instance, you can use an algorithm to check and improve ad spend for various marketing campaigns. A marketing team might use an algorithm and visualize data through dashboards to manage and analyze large datasets from multiple sources, such as Google Ads, Facebook Ads, and website analytics. The problem is to maximize return on investment (ROI) for each marketing dollar spent.
The algorithm would first take inputs such as historical ad spend, conversion rates, and customer behaviour data. You can even conduct interviews or surveys with your marketing team for added context.
It then processes these inputs step by step, applying machine learning models to predict the expected performance of different campaign strategies. The final output is a set of recommendations on how to allocate budget across channels to achieve the best possible outcomes.
To track effectiveness, you can use a counter to monitor how often predicted outcomes align with actual results.
Another example is in finance, where algorithms are used for predicting maximum stock prices or future sales revenue. A financial analyst might forecast next quarter’s revenue using economic indicators, past sales data, and market trends as inputs.
The algorithm breaks the forecasting process into smaller steps. It first normalizes and preprocesses the data to ensure consistency. Then it applies a time‐series model, such as ARIMA, to identify patterns and trends in the historical data. This structure helps analysts see how different factors influence the forecasted revenue and spot risks and opportunities.
How to build a working algorithm in 9 steps
The steps start with defining the problem the algorithm will solve. The result should drive productivity, surface insights, and give your business an edge.
- Know the algorithm’s goal
- Collect relevant data
- Preprocess the data
- Select the algorithm type
- Design the algorithm structure
- Implement the algorithm
- Test the algorithm
- Fine‐tune the algorithm
- Deploy and monitor the algorithm
Step 1: Know the algorithm’s goal
Start by defining what you’ll use the algorithm for. The problem statement sets the foundation and paves the way for a focused, effective system.
Your goal should be clear and specific so it addresses the questions you need to answer or the task you need to accomplish.
For example, LiveData wanted to provide custom mobile dashboards for clients without building software from scratch. Using Klipfolio Klips, they developed an algorithm to deliver financial information and core business activities to clients without compromising quality or speed.
Another goal could be to detect anomalies in your marketing data, alerting you to unusual patterns that need attention. Each goal shapes the algorithm’s structure, inputs, and expected outputs, which makes the next steps more manageable.
Defining the algorithm’s objective also affects time complexity and performance. A well‐defined goal focuses only on relevant data and processes to reduce unnecessary steps and produce timely, accurate results.
Step 2: Collect relevant data
Collect the information the algorithm needs and map where it lives. Typical sources include spreadsheets, SQL databases, and cloud data.
- Spreadsheets: Many businesses store data in Excel or Google Sheets. Great for small to medium‐sized datasets such as lists and simple tables.
- SQL databases: Ideal for larger datasets because they support efficient querying and management.
- Cloud data: Pull real‐time updates from services like Google Analytics, Salesforce, or AWS and scale as you grow.
Klipfolio Klips data connectors let you import data from various sources. You can gather all relevant inputs in one place to build your algorithm.
As you import data from several sources, focus on inputs directly tied to the problem you aim to solve. Extra data can increase processing time and reduce accuracy.
Step 3: Preprocess the data
Preprocess data to make sure it’s accurate. Remove duplicates and correct errors such as missing values, which can skew results and reduce accuracy.
- Imputation: Replace missing values with the mean, median, or mode.
- Deletion: Remove rows or columns with missing values if they aren’t crucial.
- Normalization: Adjust the scale of your data to fit a specific range, usually 0 to 1.
- Encode categorical variables: Convert text categories into numbers.
- Feature engineering: Create new features or modify existing ones to better represent the problem.
- Aggregation: Summarize data to a higher level, such as converting minute‐by‐minute data to hourly averages.
Klipfolio Klips data feeds help you handle missing values, remove duplicates, and standardize your data. The visual query builder lets you create new data structures and perform complex transformations without writing code.
Step 4: Select the algorithm type
Choose an algorithm that fits the problem.
- ARIMA (AutoRegressive Integrated Moving Average): Predict future values based on past data, such as sales forecasting or predicting website traffic.
- Anomaly detection: Detect fraud, identify equipment failures, or spot unusual trends in marketing campaigns.
- Regression: Predict a continuous output based on input features, such as estimating costs, projecting customer lifetime value, or forecasting demand.
- Classification: Sort data into predefined classes, such as email spam detection, customer segmentation, or risk assessment.
Cervinodata, a data management company, used the ARIMA and anomaly detection models to predict clients’ cost per click (CPC) on ads. By combining these models, they used historical data to anticipate changes while identifying spikes in CPC that might indicate issues or opportunities in campaigns.
Klipfolio Klips provides advanced functions and formulas that make it easier to apply these algorithms to your data. Choose the right ones for your use case and you’re set.
Step 5: Design the algorithm structure
Outline the steps and flow so the algorithm functions correctly and efficiently. A clear structure helps you visualize the process and spot issues before implementation.
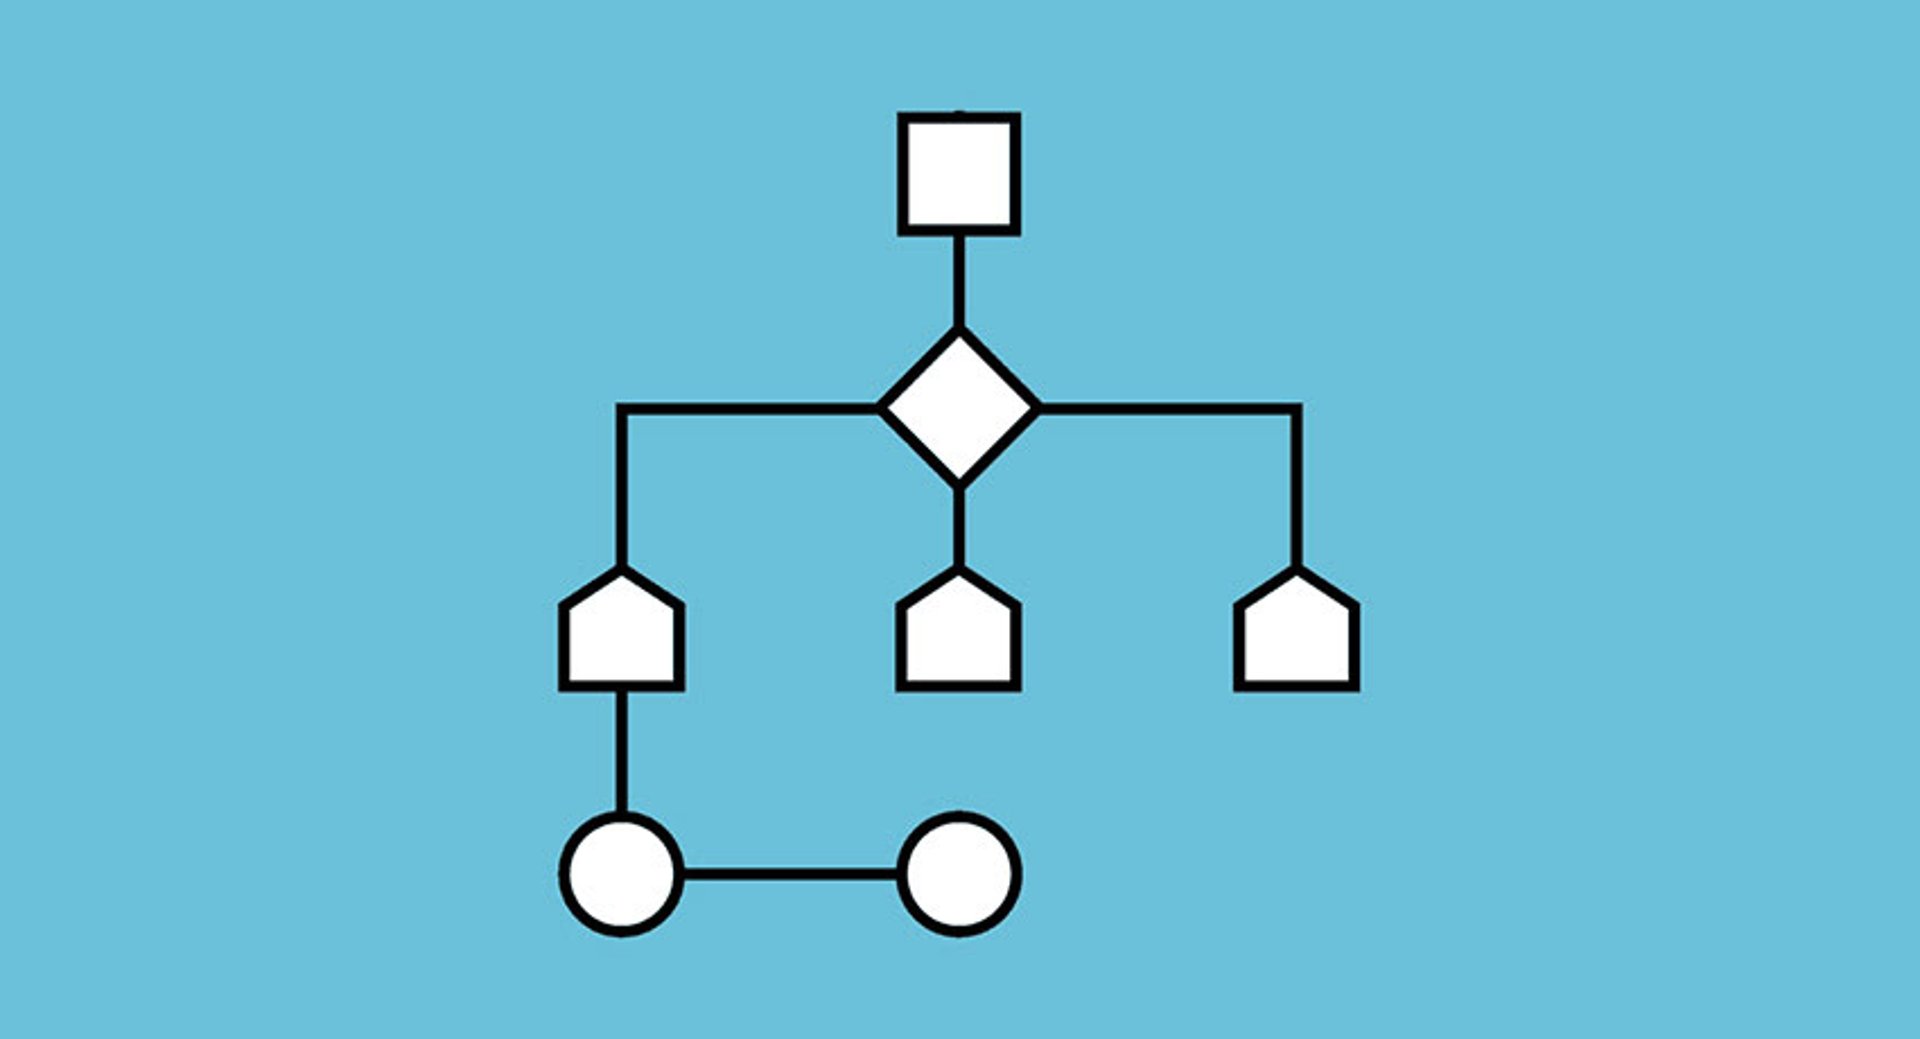
Use flowcharts to represent the steps, with arrows and boxes to show the flow of operations. This helps you understand the sequence and decision points.
You can also use pseudocode, a simplified version of code written in plain language. It outlines the logic without the syntax of a specific programming language. Pseudocode is useful for planning and communicating the structure.
If you prefer a visual approach, this visual query builder lets you drag and drop data sources, apply transformations, and define data flow operations with low complexity.
Step 6: Implement the algorithm
Write the code that executes the steps you designed. This is where the algorithm turns from a plan into a functional tool that processes data and solves problems.
Python is popular due to its simplicity and powerful libraries. R is widely used for statistical analysis. SQL lets you query and manage data stored in relational databases.
You don’t need to spend time writing everything from scratch. Klipfolio Klips includes pre‐built functions and formulas to manipulate data, run statistical analyses, and create custom metrics without complex programming.
Once your algorithm is implemented, Klipfolio Klips lets you automate and schedule its execution. Run it at regular intervals to process new data continuously and update dashboards.
Step 7: Test the algorithm
Test your algorithm through cross‐validation or A/B testing. In cross‐validation, you divide data into several subsets. Train on some subsets and test on the remaining ones, repeating the process to evaluate performance.
For example, with 100 data points, split them into 5 sets of 20. Train on 4 sets and test on the 5th. Repeat this 5 times, each time with a different test set.
A/B testing compares the algorithm’s performance against a baseline or another algorithm. It shows whether the new approach performs better than the existing one.
With Klipfolio Klips, real‐time data updates and interactive dashboards help you monitor and refine your algorithm. You can compare versions at a glance and improve your model quickly.
Step 8: Fine‐tune the algorithm
Use insights from testing to fine‐tune. Adjust parameters and evaluate the model to improve outcomes.
There’s hyperparameter tuning, where you tweak settings that control the learning process. For an ARIMA model, hyperparameters include p (lag order), d (degree of differencing), and q (order of moving average).
Adjusting these helps the model fit your data.
Use model evaluation metrics such as Mean Absolute Error (MAE), Mean Squared Error (MSE), and R‐squared for regression; precision, recall, and F1 score for classification.
Say your algorithm predicts sales. Use MAE to measure the average magnitude of errors in the predictions. It provides a clear, interpretable measure of accuracy and is less sensitive to outliers than MSE, which helps when sales data contains unusual values.
Step 9: Deploy and monitor the algorithm
When you’ve fine‐tuned the algorithm, deploy it to production, whether that’s a dashboard, an API, or a scheduled report. Monitor output and watch for changes or anomalies that need adjustments. Review accuracy, precision, and other key metrics to keep the model aligned with business goals.
Cervinodata’s CPC prediction algorithm accurately predicted certain trends but faced challenges with unexpected spikes and drops. For instance, it predicted a steady rise in CPC from September 5 to September 9, which aligned with observed data.
It also struggled when a spike occurred around September 25. The actual CPC rose sharply and wasn’t fully anticipated, which shows why continuous monitoring and adjustment matter.
Solve your problems with the right algorithm steps
Building an algorithm for your business starts with clear goals, the right data sources, and careful data prep. In development, choose the best algorithm type and design how it will work.
Understanding the data and variables involved helps you build an algorithm that addresses the problem properly. The more precise your inputs and problem definition, the better the algorithm will perform.
Creating an algorithm doesn’t need to be daunting. With Klipfolio Klips, you can create, test, and monitor algorithms with a low‐code approach. Drag and drop data sources, apply transformations, and define data flow with a few clicks.
FAQs
What are the basics of an algorithm?
An algorithm is a clear, step‐by‐step sequence of instructions that solves a problem or performs a task. It takes specific inputs, processes them according to predefined rules, and produces outputs.
Time complexity plays a key role in efficiency. It measures how runtime increases as input size grows. Efficient algorithms minimize time complexity so they remain fast with large datasets.
Whether you’re dealing with simple or complex problems, understanding the basics helps you solve business challenges more efficiently.
What are the 5 guiding principles of an algorithm?
Clarity, efficiency, scalability, correctness, and readability.
Each step should be clearly defined and easy to understand so users can follow the logic without confusion.
A good algorithm should handle more data or more complex tasks without a significant drop in performance. It must produce the correct output for all possible inputs to reliably solve the problem it was designed to address.
As systems grow, inputs and data structures expand, so the algorithm must maintain efficiency. A scalable algorithm adapts to larger inputs and more complex processing tasks without becoming inefficient.
Lastly, it should be easy for others to read and understand. Clear code, logical variable names, and well‐organized steps make the process easy to follow.
How do I create the right algorithm?
Start by defining the problem and the required inputs and outputs. Then consider factors such as data structure, time complexity, and the need for accuracy or speed.
If you need to forecast future trends based on historical data, an algorithm like ARIMA might be suitable. If your goal is to classify data into categories, a classification algorithm such as decision trees or support vector machines could be the best choice.
Consider complexity and how the algorithm will scale with more data. Simpler algorithms may be more efficient for smaller datasets, while more complex algorithms can help with large‐scale problems.
Related Articles

Anatomy of a great API
By Danielle Hodgson — January 21st, 2026
Why every digital marketer needs to learn how to deploy marketing technology
By Jonathan Taylor — November 19th, 2025
Top 10 Marketing Dashboard Ideas for Tech Companies

