PowerMetrics - The first Metric-Centric BI solution

Published 2023-06-27, updated 2024-05-03
Summary - To ensure clean, trusted data across all teams, more and more companies are embracing the concept of a semantic layer as an essential part of the modern data stack. While it’s a step in the right direction, a semantic layer can only realize its full potential when it’s part of a bigger picture approach. PowerMetrics is the first BI solution that’s purpose-built for the creation and consumption of metrics, allowing data and business teams to work together to achieve reliable, self-serve data for everyone.
Great progress has been made in business intelligence and analytics over the past decade. Our first product, Klips, has helped thousands of businesses and agencies visualize their (raw) data to derive and share insights. Dashboards and reports continue to be in high demand by business teams and other decision makers for a lot of good reasons, however, they often don’t address the fundamental need for a single source of truth. Data needs to be trusted by everyone and be accessible as a self-serve option for marketing, sales and other business teams. Instead, metrics are being defined and calculated differently by every team and in every dashboard. Data teams can feel frustrated when business teams struggle with a BI tool’s complexity or don’t trust the data. We understand these issues and, in fact, they were the drivers behind the development of our second product, PowerMetrics. Not satisfied with the status quo, we designed PowerMetrics using a metric-centric architecture – a solution that provides self-serve capability with reliable, trustworthy data for everyone.
We’ve keenly followed the analytics market and its evolution. While not at scale in the SMB sector yet, the big move toward the “modern data stack”, that embraces the importance of a “metrics layer”, is just around the corner. Let’s dig into the progress that’s been made with an eye toward this future.
A little BI history
Before Klips, the only way to create a dashboard was by using enterprise-level business intelligence (BI) software. This typically involved deploying a large and expensive proprietary database. Getting data into those systems required a huge learning curve, training, and cost. As a result, dashboards were only accessible to large companies with specialized teams and lots of money to invest in infrastructure and training. Klips disrupted this trend by enabling data to be streamed from virtually any data source (cloud-based service, database, REST, SQL, local file) directly to a visualization on a dashboard … all at a reasonable price for small businesses.
By 2016, the enterprise space was shifting away from databases to the concept of a data warehouse. Most companies were having problems getting control of their data, which came from a variety of sources, and they weren’t sure what data was the best match for analytics. It quickly became a race to put all the company’s data into a single location and at least make it “analytics ready”. This way, they figured, it would be easier to access the data and share reports. In the end, they failed to make progress. Most BI solutions simply shifted to connect to data warehouses like Snowflake with no actual move towards better visualization or data understanding.
The current Modern Data Stack
Shifting to the data warehouse concept was the first step toward the modern data stack. Data teams began building their solution in layers from the bottom-up, starting with data warehouses. This move was an attempt to fix the key problems businesses were facing and to do so in a logical order. Connection layers like FiveTran became popular as a way of connecting to data stored in the data warehouse. However, teams quickly realized that there was more to it than putting large volumes of data into one spot. They needed to solve a more serious problem – achieving a single source of truth for their data.
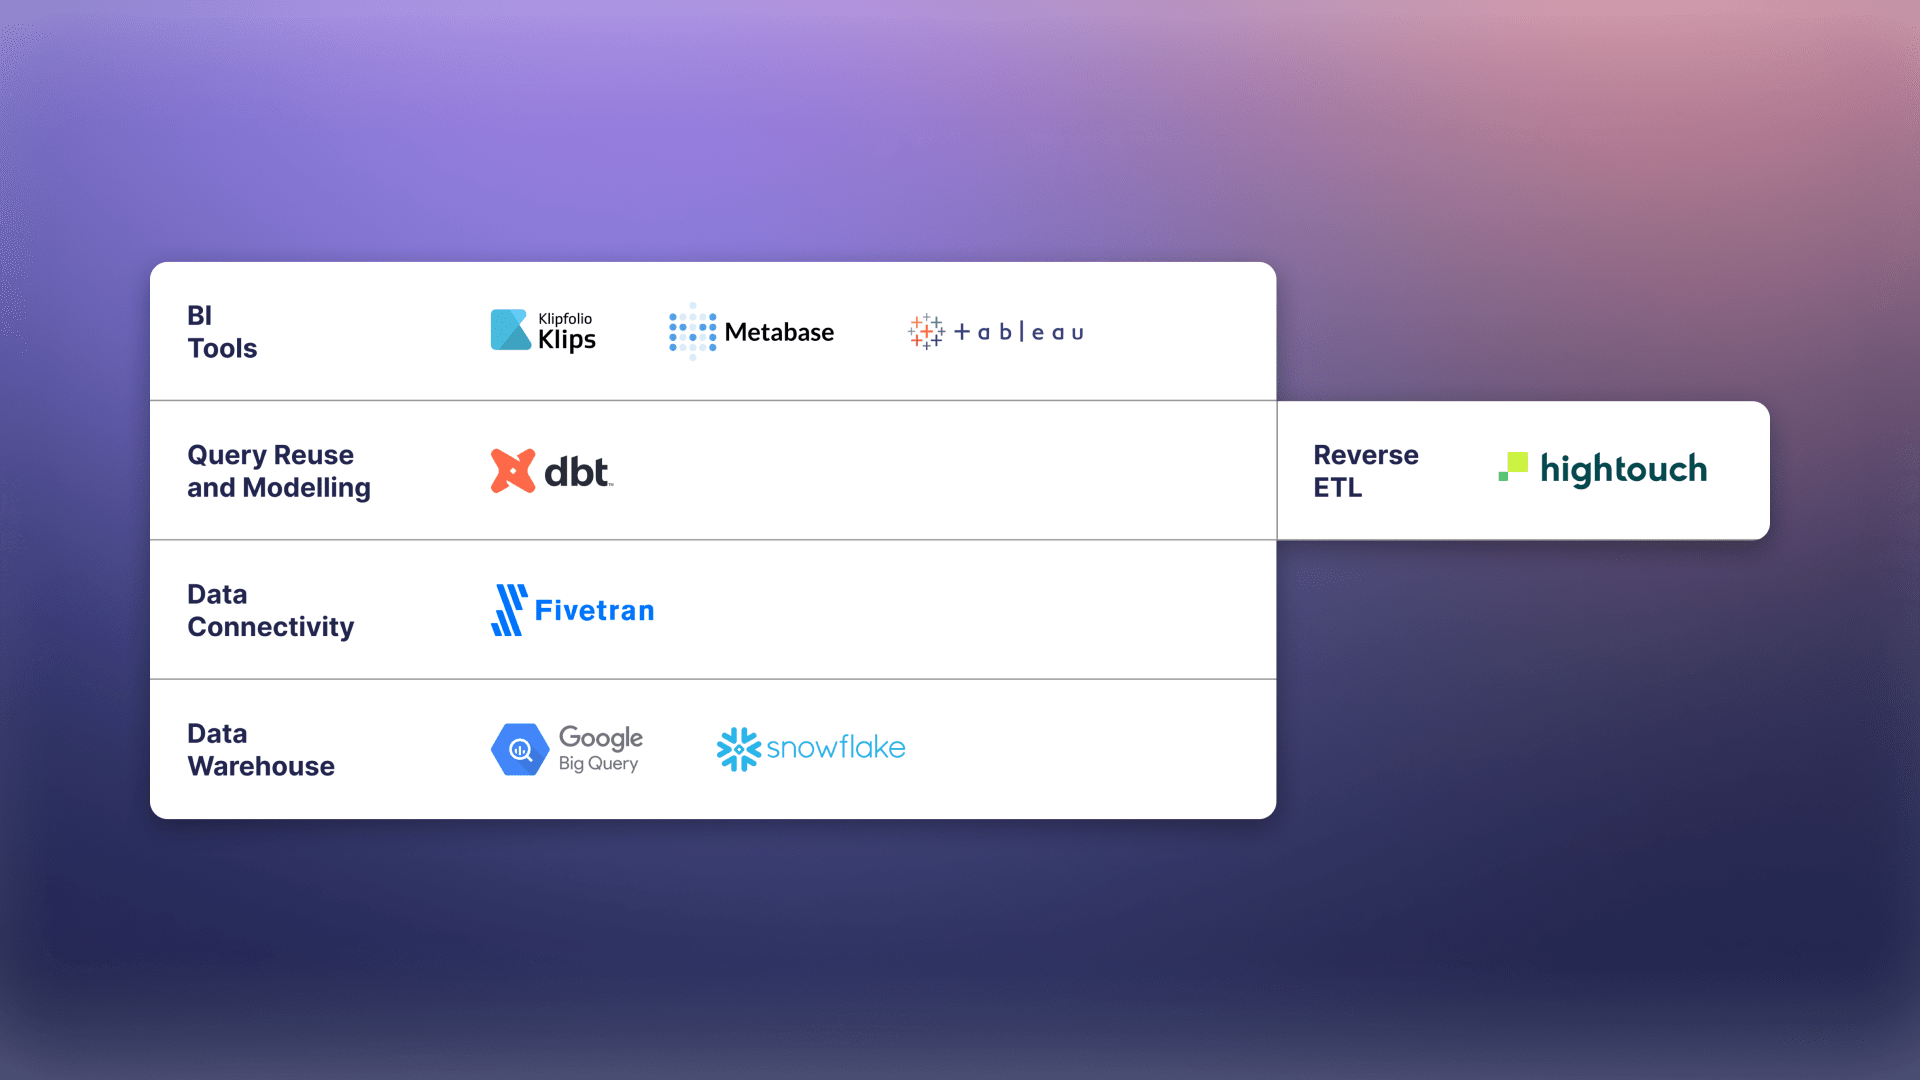
The modern data stack and a few vendors
Over the past 4 years, data teams have shifted their focus to cleaning up and verifying data - making it consistent and trustworthy for their applications and business users. Enter dbt (data build tool). Used by data analysts and engineers to transform and model data on top of the data warehouse, dbt makes it easier to prep and clean up the data, resulting in improved uniformity. It provides a programming environment for data transformation which allows code to be written, then compiled into SQL, and run against a data warehouse. Templates are included that make it easier to create macros, unions, joins, filters, loops, and other functions in the code to help with modelling. Reverse ETL tools, like Hightouch, have also become a piece of the puzzle. These tools push clean data back into the applications that consume it (such as, CRM, product analytics solutions, and financial tools).
Metric-Centric BI
While data teams have been successful at creating clean data sets using these technologies, consumers of the data throughout the business often come up with different analyses, insights, and outcomes based on the same data. This counterproductive and frustrating issue leads us to the solution we’ve been developing for the past 5 years.
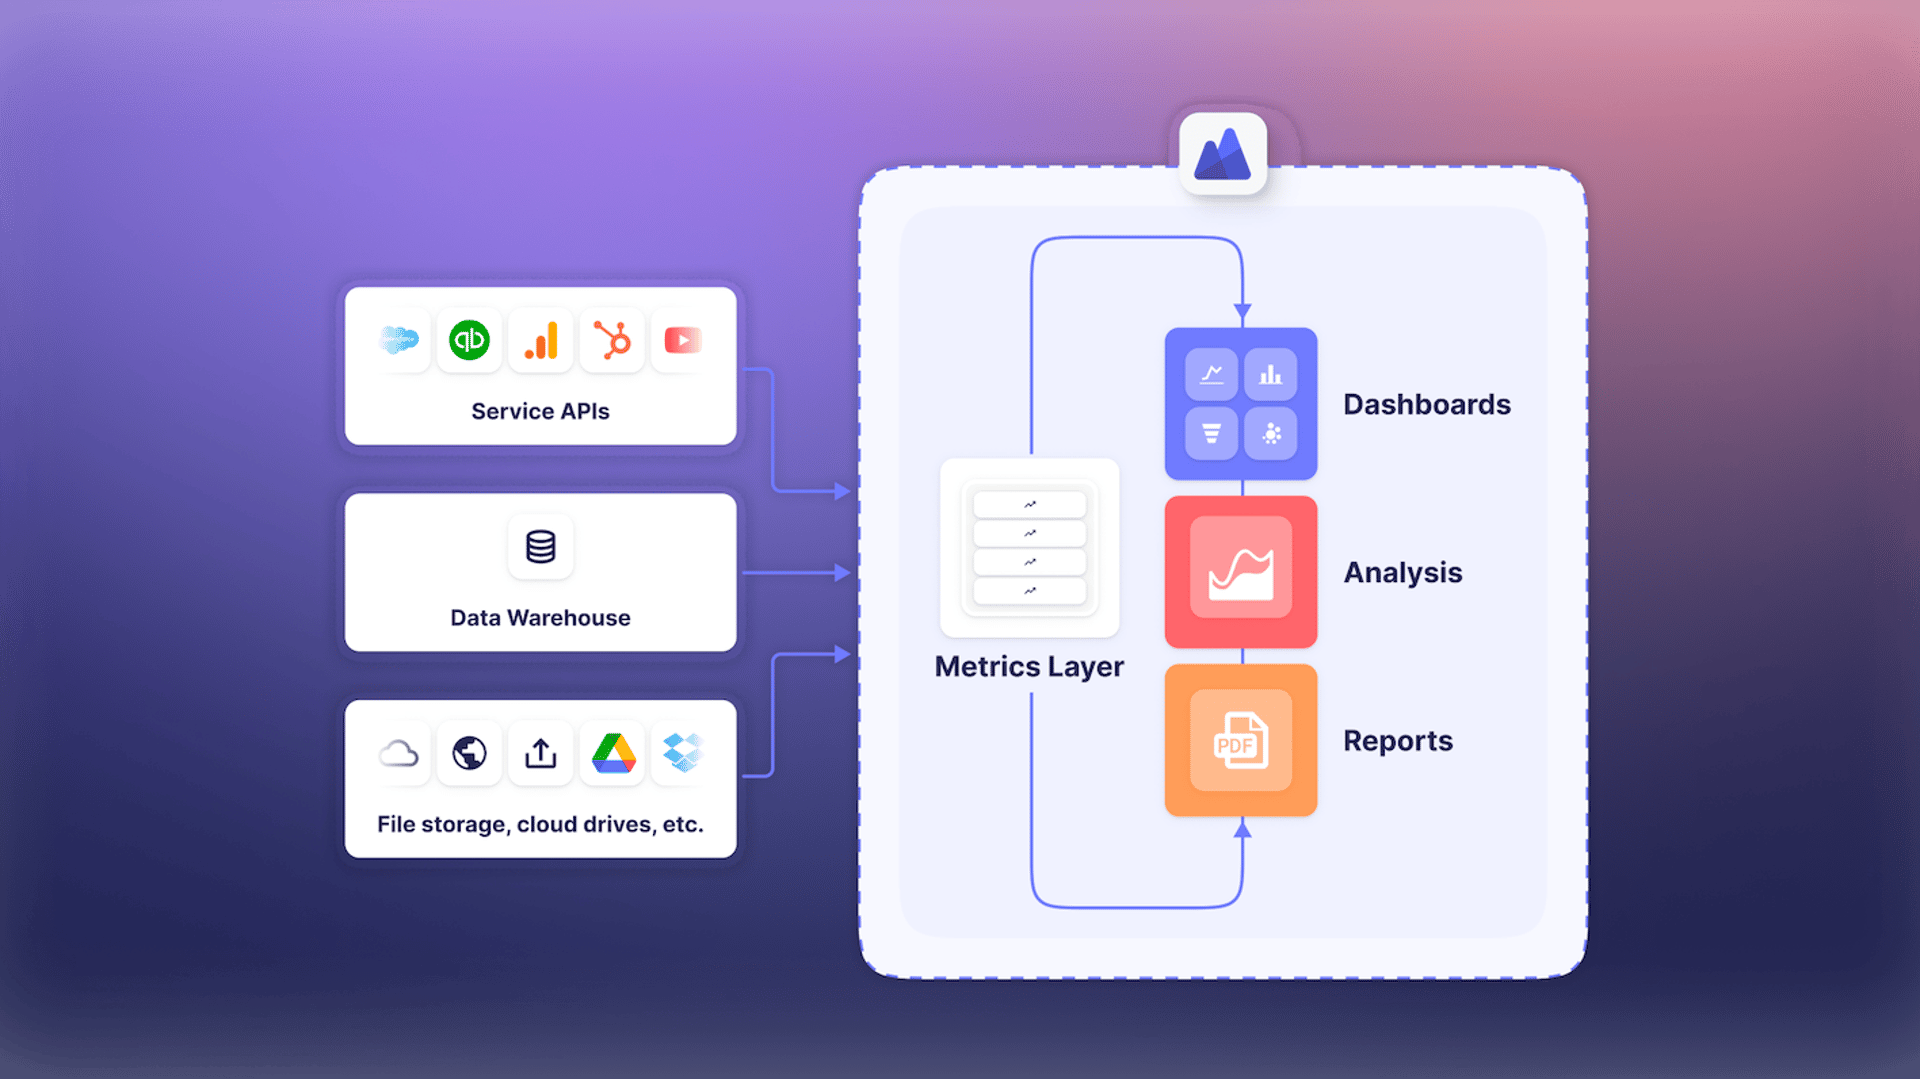
Our goal is to add the necessary components to the modern data stack that most teams are missing but are critical to metric-centric BI: A metrics layer (to add business meaning to data), a metric data catalog and a metric library (so everyone knows which metrics they’re tracking and why), and a robust set of interactive metric visualization options (so every team can explore, visualize, and share their data).
The Metrics / Semantic Layer
Let’s talk about the metrics layer (aka the semantic layer). There are a few, key components it must include, starting with a set of standardized data definitions. Adding semantic meaning and metadata to the raw data is an essential step in aligning all teams across the business, enabling everyone to draw the right conclusions and make good decisions.
The semantic layer as part of the modern data stack
Better data understanding isn’t powered by more data from a data warehouse – but, instead, by the right data. Using time series data is one of the keys to getting the right data. Including a date/time field helps you get the perfect amount of data you need, quickly (with no unnecessary data being retrieved). You can always fill in the history asynchronously later using a process known as backfilling. Having a date/time field also enables you to visualize real-time and historical data more accurately, apply filtering, and track your data as it changes over time.
We recently introduced data feeds, an innovative feature that separates the data that powers the metric from the metric’s definition. Data feeds enable PowerMetrics to bring the exact data needed for a specific metric from any source - whether that’s a data warehouse or the source application (Google Analytics 4, HubSpot, Salesforce, Shopify, etc.). Being able to pull data directly from a cloud-based service is a huge advantage over solutions like dbt Semantic Layer (which only supports data warehouses). Data transformations, like joins and unpivots or manipulation with functions and formulas can all be done at the data feed level later.
The data feed design also enables metric governance – anyone can explore the data, even if they don’t have access to the underlying SQL query or full visibility into the raw or modelled data. Data teams can focus on creating clean data and providing access to it while allowing business users to define and visualize the metrics from it in a self-service manner with our visual query builder.�
PowerMetrics also maintains a knowledge graph that defines and stores the relationships between metrics. This structured representation allows information and metadata from the metric definitions to be combined from multiple sources. This enables powerful exploration, discovery, and analysis around metrics that are applicable to different domains. Ultimately, this knowledge graph will allow us to make recommendations around related metrics and other insights in the future.
The final component needed for an effective metrics layer is dynamic data segmentation. Segmenting your data and analyzing it from multiple perspectives is an essential part of understanding your business. Think of an OLAP (online analytical processing) cube or multi-dimensional array of data and imagine it being created automatically and seamlessly.
In PowerMetrics, we connect all the metrics layer components together and call them a metric.
Metric Catalog
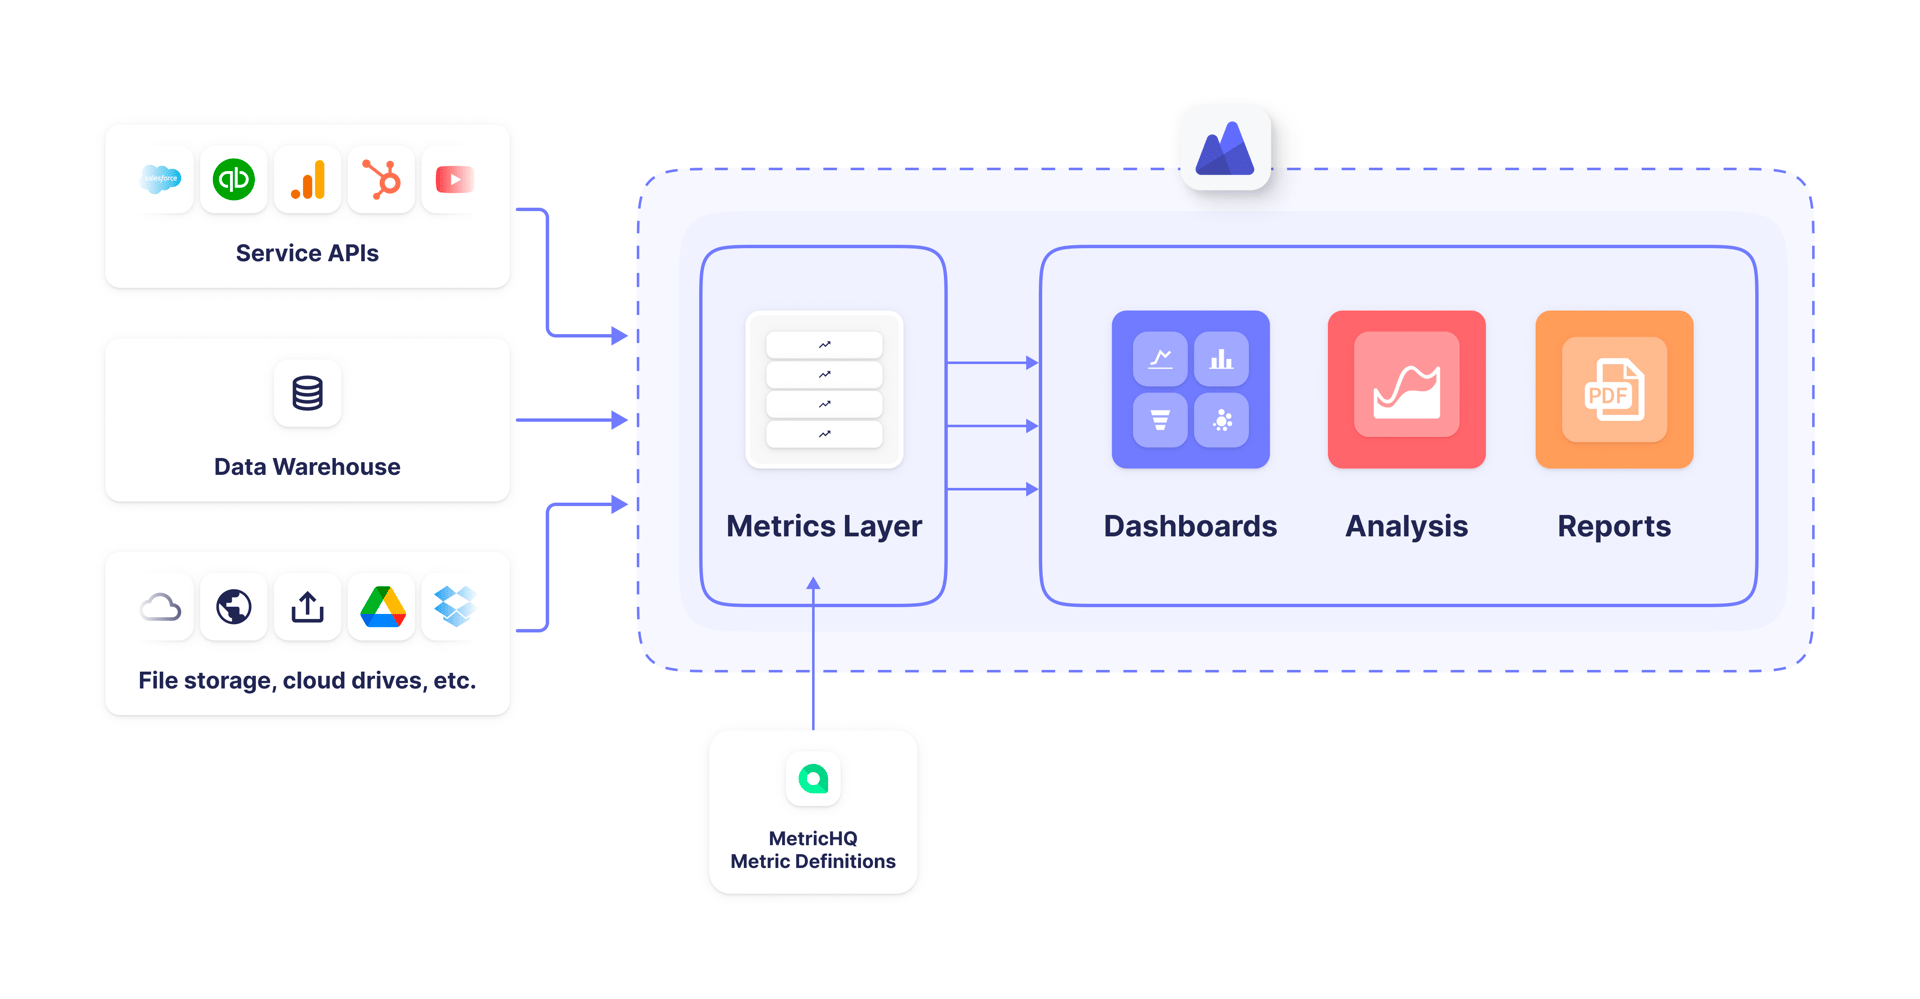
We released PowerMetrics as an open beta in February of 2019. One of the core features that has been critical to success with the product has been the metric catalog. Here, users can see all the metrics that have been created that they have access to, their current value, how they’ve changed, their trend, and when they were last refreshed all in a single spot. With a powerful search mechanism, duplicate metric definitions can be reduced and a trusted company-wide set of metrics can be built and shared. At the same time, we realized that a public library of standardized and well-accepted metric definitions was also fundamental. Most teams don’t know what to measure, how specific data sources represent that data, or even what the exact industry-accepted formulas are to calculate these metrics. In September 2019, we launched MetricHQ to advance data literacy and give businesses a starting point for their metrics. Since then we’ve added hundreds of metric definitions to the library, all verified and trusted by industry experts.
To make teams self-sufficient with metrics, you can’t just use a headless approach. Products like dbt Semantic Layer and Looker Modeler have emerged in the last few years to allow metric definitions to be created on top of clean modelled data. While this is an important first step towards a universal metrics layer, it’s not practical or realistic to expect data teams to build every possible metric for their organization. It takes a long time to work with each individual business team, capturing the metrics/definitions they think are important and then creating and maintaining them. This time-consuming process isn’t sustainable. Also, once they have their metrics/definitions, it’s almost impossible for business users to verify they’re correct; they’re not SQL experts and they certainly don’t use dbt.
Metric Visualization
Seeing is believing. Instead of SQL debugging, we think the easiest way for data teams and business users to know the metric definition is right is to see it for themselves. That’s why we provide visualizations and dashboards that are purpose-built for metrics from day one. PowerMetrics includes a vast library of dashboard templates and built-in chart types for metrics that can be dynamically changed with the click of a button, data exploration capabilities, goals and notifications, and powerful filters that allow users to access their data history and track their metric data as it evolves in real time. Dashboards come together quickly and are easy to share with anyone inside or outside the organization using our published view capability.
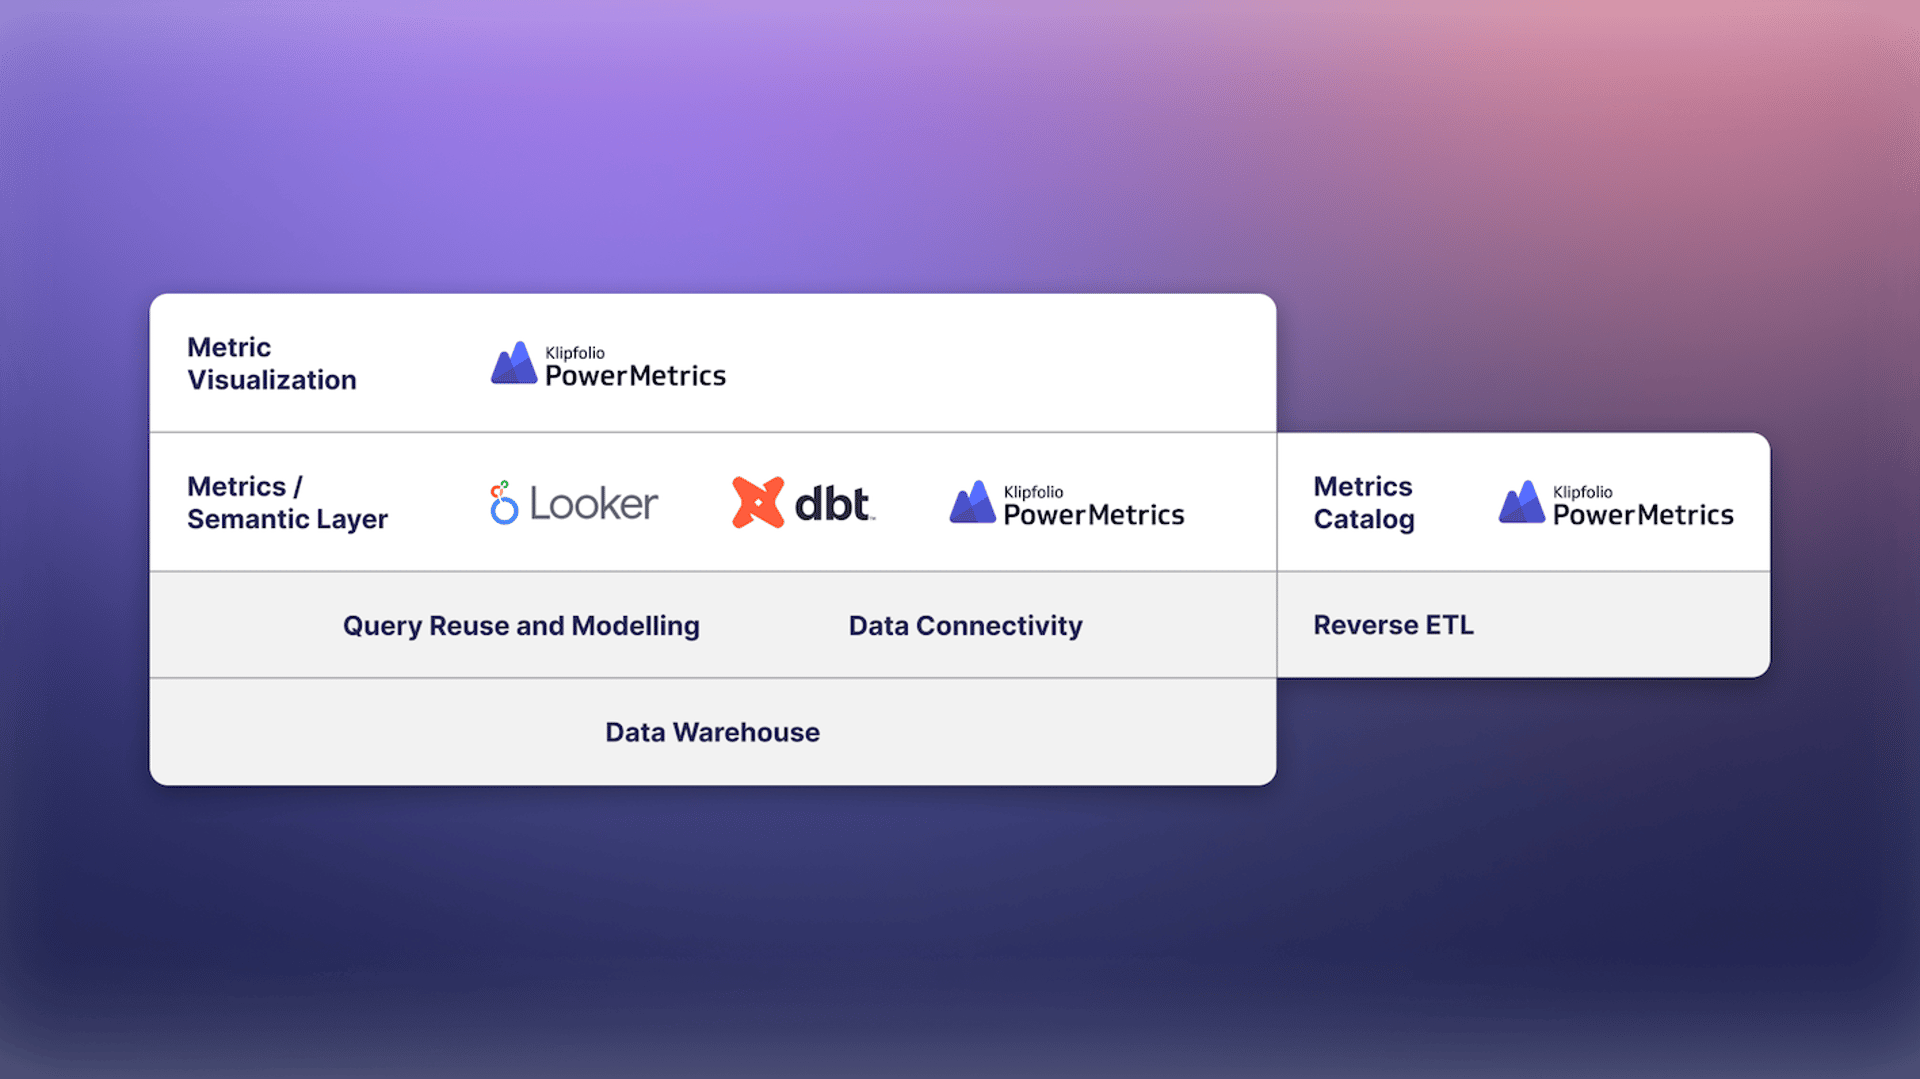
The PowerMetrics metric-centric BI stack includes the metrics layer, catalog and visualization
Realizing Metric-Centric BI: Completing the Modern Data Stack
Combining a metrics layer, a catalog of metric definitions, and metric-centric visualization capability is key to a complete, modern data stack. Each piece on its own only solves part of the problem for some of the users – the data team or the consumer, but not both. The great news is that PowerMetrics has always included all three of these components. And, we’re not stopping there! We’re committed to continuing to learn from our users and other solutions in the market and enthusiastic about growing PowerMetrics into the best BI tool for data and business teams. Our product vision is a solution that leads to clean and consistent data as the basis for true, self-service BI. We deeply believe the metric-centric approach is the present (and the future) of BI. We’re excited to continue innovating and evolving PowerMetrics to serve business and data teams and help them make better decisions with data.
Related Articles
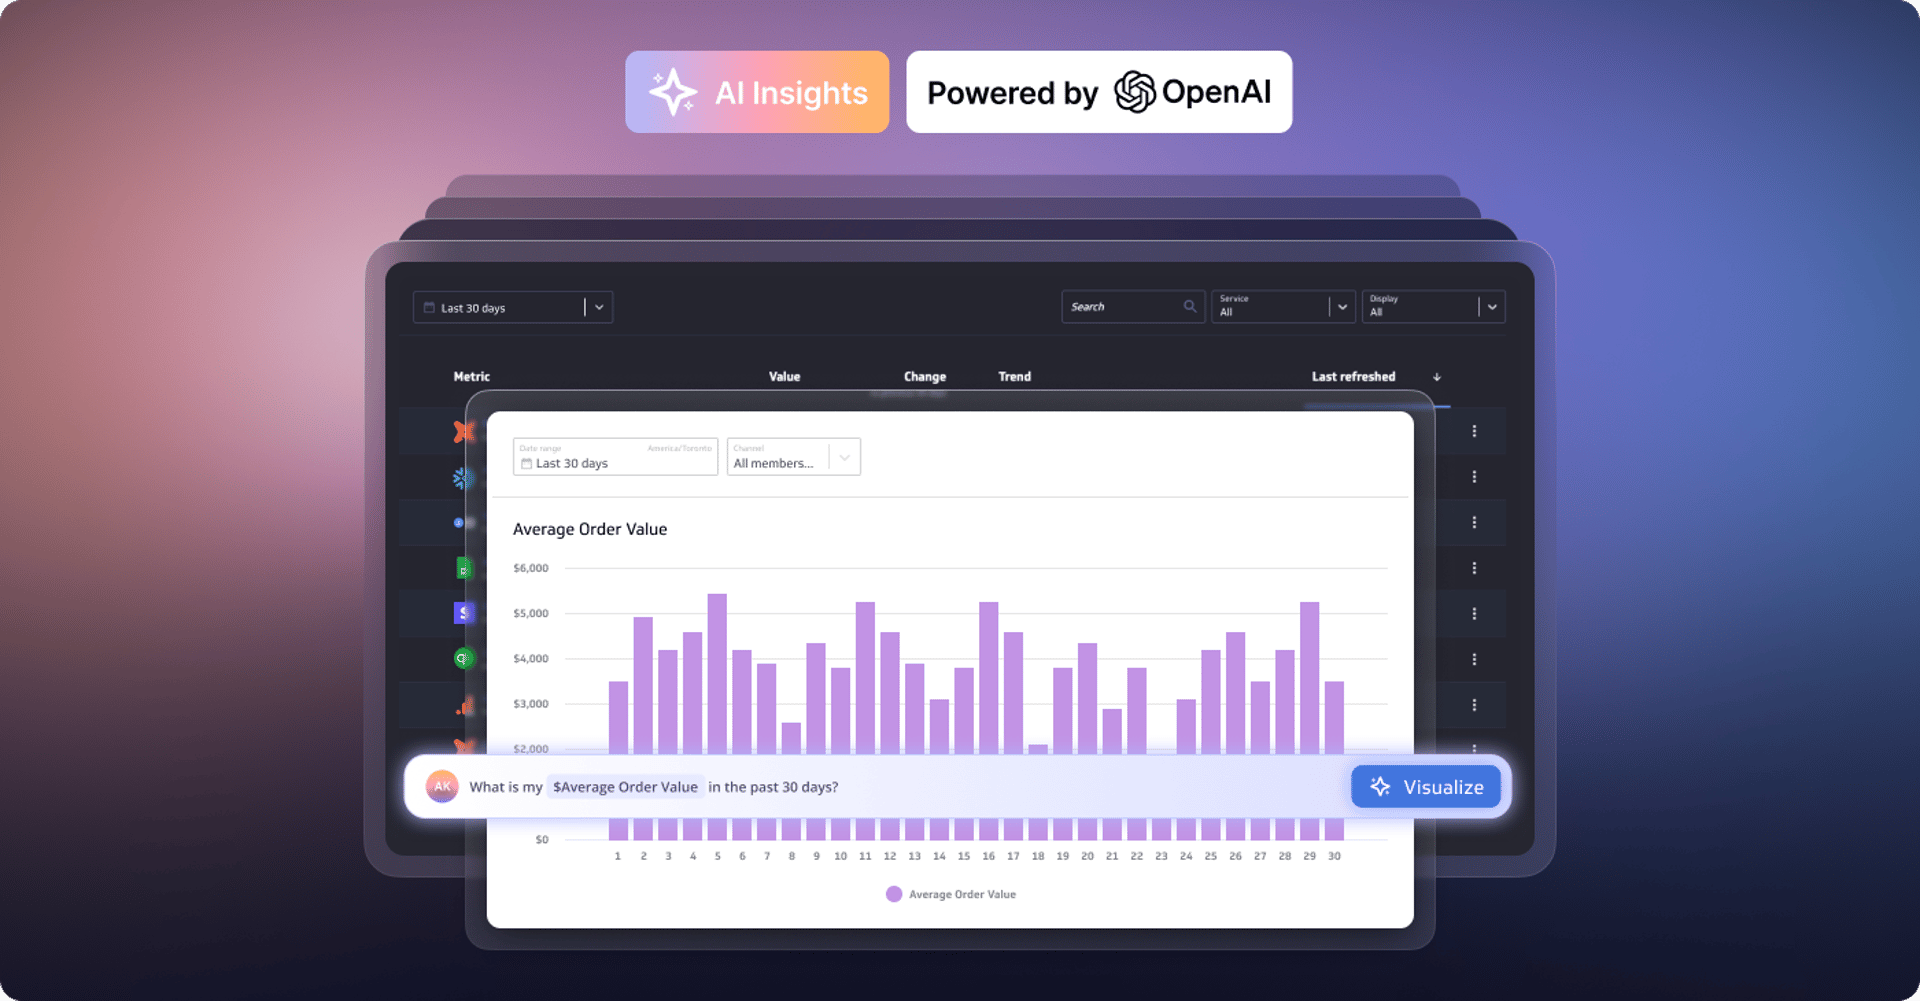
Metrics provide rich context for better AI: Introducing the new PowerMetrics AI experience
By David Mennie — June 21st, 2024
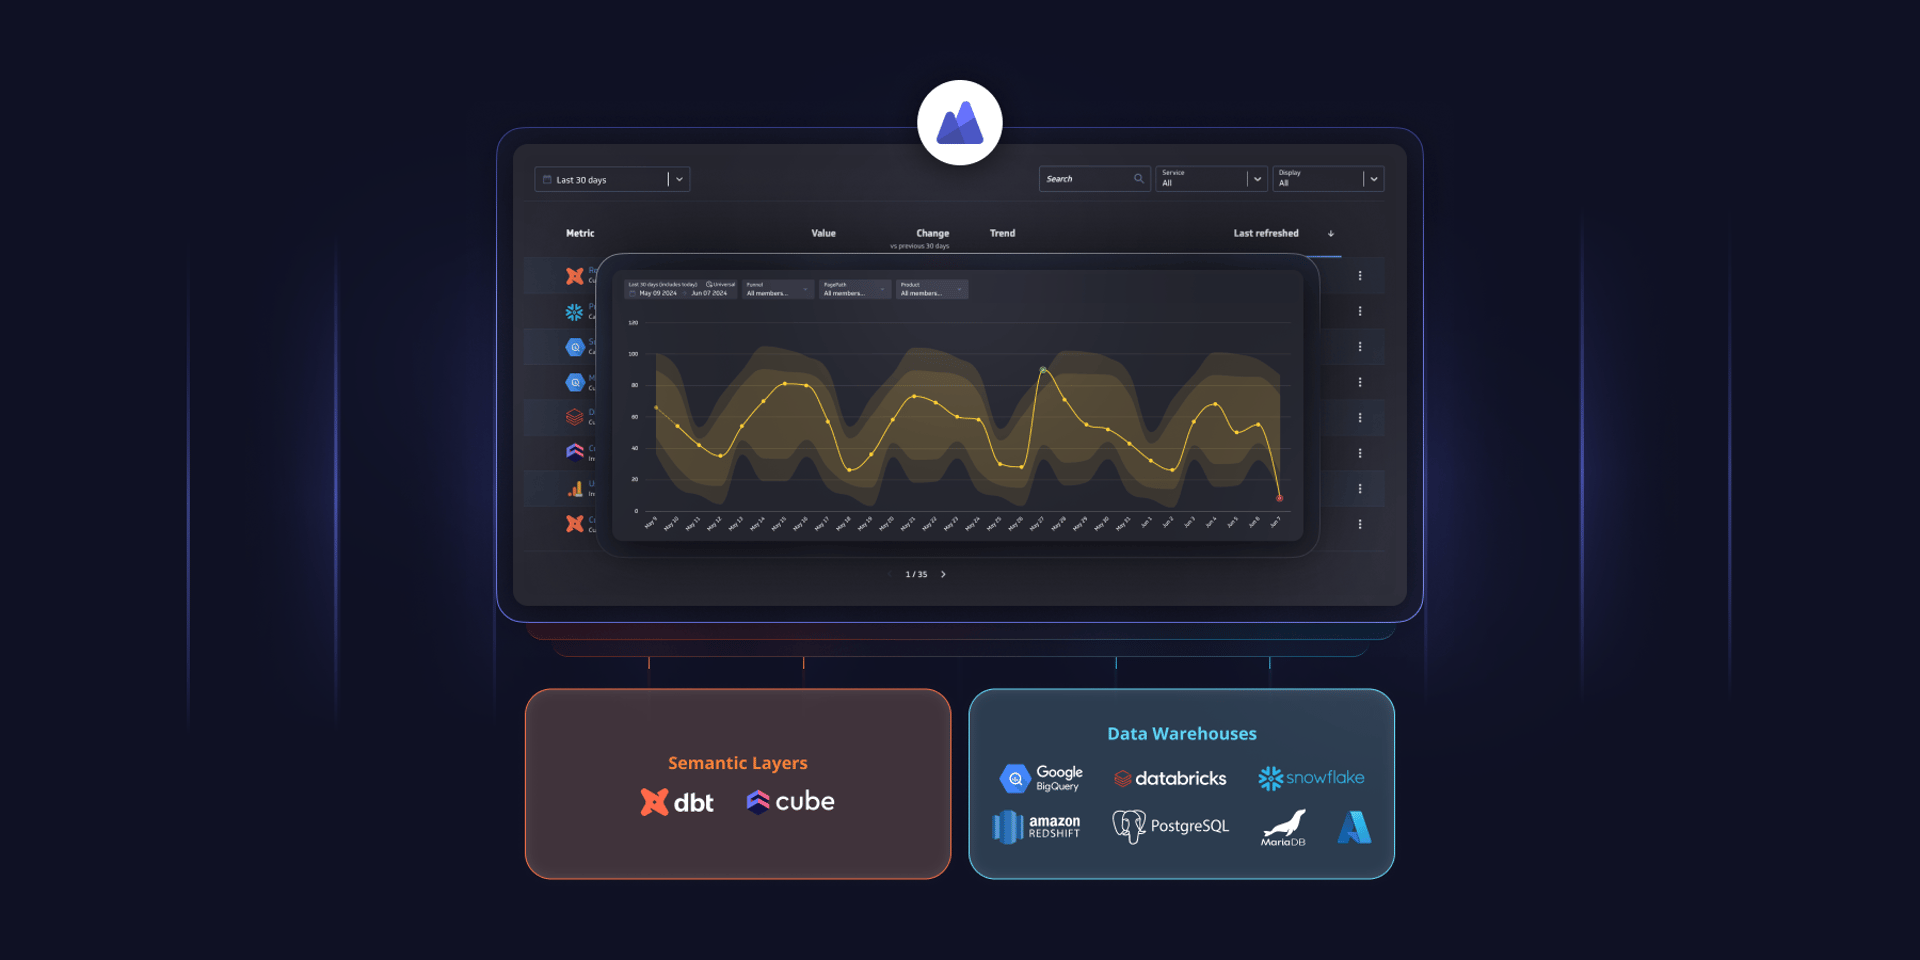
PowerMetrics - New data warehouse integrations and Cube semantic layer support
By David Mennie — June 14th, 2024
Partner Case Study: Eyeful
By Cathrin Schneider — May 21st, 2024

Partner Case Study: The Project Booth
By Cathrin Schneider — April 11th, 2024