
Summary - PowerMetrics launched as the first metric-centric analytics solution. This groundbreaking concept goes beyond the semantic layer as part of the emerging but popular modern data stack. This blogpost describes how PowerMetrics provides massive opportunities for data and business teams and why we deeply believe it embodies the future of business intelligence.
Moving beyond the data warehouse-centric BI stack
There’s an exciting movement today in the world of business intelligence, one that Klipfolio started working on five years ago with the development of PowerMetrics. Businesses are moving beyond the traditional data warehouse-centric BI stack and embracing a metric-centric vision of the future. Focused on defined metrics, good governance, and clear lineage, this approach provides the trust and confidence needed to make better data-driven decisions.
In 2018, PowerMetrics was likely the first BI solution with a metric-centric, semantic-layer architecture ... and a massive opportunity to improve the BI experience. Only recently have other thought-leaders started to realize the value of a metrics layer approach.
This post describes our journey – why we started to radically rethink our approach to BI and why we’re so driven to continue defining the future of BI and analytics.
What is the ‘semantic layer’ trend all about?
In the traditional approach to BI, data in itself lacks meaning. Even as measures and dimensions are named and then visualized as part of dashboards and reports, the naming is loose and inconsistent at best.
In a modern data stack, the semantic meaning (the metrics layer) is inserted between the raw data and the consumption endpoints. Metrics are defined on a global level, abstracted from the data source, and shared for analysis, ensuring a stable, single source of truth for an organization’s most important metrics.
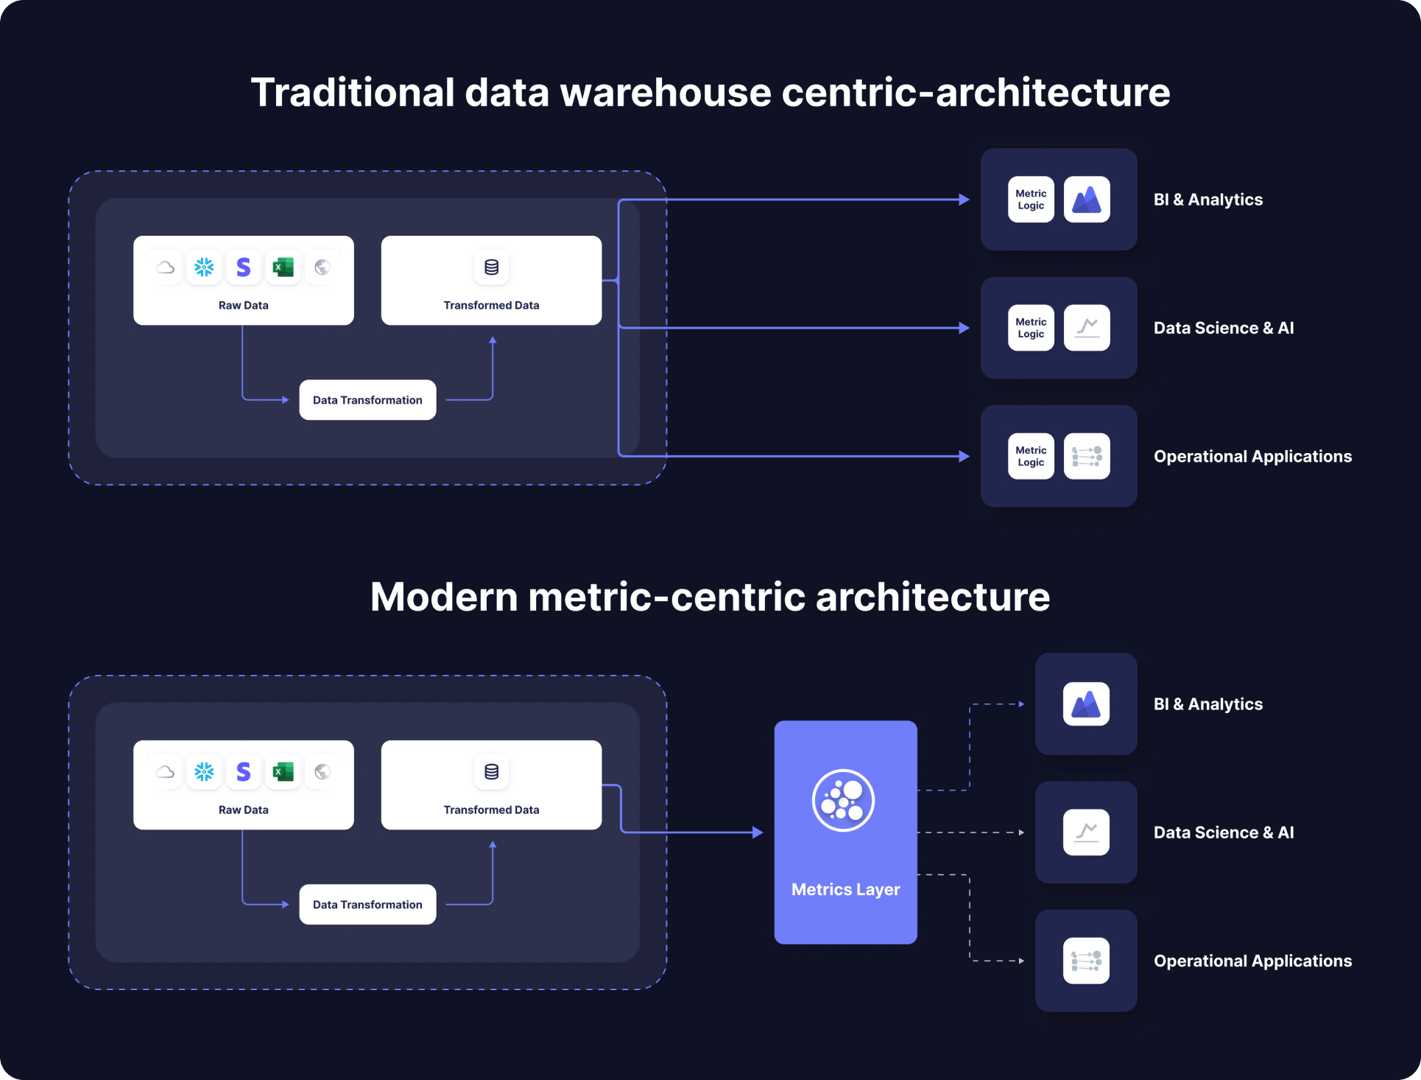
More than that, properly defined and calculated metrics, stored in a central layer, and shared with all the different consumption end-points presents an opportunity for true self-serve data analysis for non-technical business teams. We call this metric-centric BI. Others are beginning to embrace this approach, for example, following the modern data stack evangelist dbt (who are promoting the dbt semantic layer as part of dbt Labs) Google’s Looker announced Looker Modeler in March 2023.
Why we started to rethink BI five years ago
First, some context. If you know Klipfolio's history, you'll remember that in 2012 we launched Klips, a very successful dashboard and reporting product. Incredibly flexible and powerful, it was entirely new in that it connected directly to traditional data sources and cloud-based services. The modelling and transforming happened in real time at the visualization layer using Excel-like functions and formulas. At the time, it was also the only BI tool targeting small and mid-sized businesses. Klips has a steep learning curve, but customers love it because, with Klips, there’s no problem they can’t solve. We were passionate about helping SMB customers measure the performance of their business. First and foremost, what we built was a fast, powerful, direct approach to visualizing data from multiple different sources.
Despite our success, our customers told us that managing all that data was a significant and ever-increasing challenge for them. They also told us the technical aptitude needed to work in Klips was a significant stumbling block for many of their users.
Data needs to have meaning
With Klips, our first product, customers could access and work with a lot of data but it lacked meaning. Things got messy, fast. It was like having a thousand sticky notes, each with data that was somehow important to a particular user or team. And, of course, this only got worse as our customers matured and their data grew - to the point where they were struggling to manage thousands of assets in our platform.
In our minds, the future was clear. Data must have meaning. That got us thinking about metrics … . All metrics have business definitions. There’s a catalog of global and shared dimensions. Time and date grains are consistent. And, metrics all share a universal interface that makes them compatible with each other. It was not about dashboards and reporting – in fact, it was headless. Opinionated metrics – the solution to a world where data had no meaning.
Analytics needs to be self-serve for business teams
Like any other BI solution, Klips needs a technical team member to prepare and, often, to visualize the data. However, it’s the business teams, like marketing, sales, and finance that request and use the dashboards and reports. Endless feedback loops between data and business teams are frustrating and time consuming for everyone. Our vision? A world where business team members, equipped with a set of centrally-defined and prepared business metrics (a "buffet" of metrics) are entirely self-sufficient.
As we made progress toward this goal, focusing our UX on journeys that would delight business decision-makers, it seemed that our most successful customers almost always included people with more data know-how. It doesn’t take long to get into deep water working with data: How is time series data aggregated? How to join tables to get important dimensions? How to ensure data accuracy when creating derivative metrics. And those are the easy questions!
I dug up a presentation from 2018, by Mark Priatel, our CTO at the time, where he captured the following three problems:
- The current product (Klips) is too hard to use for the target persona and market we are serving (business users in SMBs)
- Users don't know what metrics to track, how they are calculated, how to interpret the results, or what action to take
- Without semantic meaning for metrics, there can’t be any network effects, where features such as insights, benchmarks, relationships increase the value of our product for all users over time
Solving these fundamental problems fuelled our innovative spirit and became the basis for our new product and architecture - PowerMetrics.
PowerMetrics: A metric-centric approach to BI
Internally, we declared that the metric should be a first-class citizen. If you - like most people and even analysts - are unsure what differentiates a metric from measures and KPIs, read this article. And, we decided to build a product from the ground up: PowerMetrics.
Two ideas define the core of our metric-centric architecture:
- Semantic meaning: Data is meaningful, when we apply business logic and an understood definition to it. For example, the metric “Net Profit” is an understood business term and calculated as Sum(All Revenue) - Sum(All Expenses). It can be further enriched by adding dimensionality like “by product” or “by country”.
- Time is the most ubiquitous dimension: Almost all queries, alerts, and comparisons include time. At a minimum, each metric is comparable across a time dimension. And data ingestion needs to accommodate the snapshot, periodic, or transactional time data.
A metric has a measure and, optionally, dimensions, time/date information, and metadata that can capture naming and definition. No longer were we building visualizations upon meaningless data. Applying everything that we had learned, using a modern tech stack, a new product was born.
We doubled down on metrics and a few years later, in 2020, we launched MetricHQ, the first community-driven dictionary for metrics and KPIs. This platform is a place for data and business team members alike to learn about standard metric definitions (contributed by industry experts) and to add pre-built metrics directly to their PowerMetrics account.
Why the world wasn’t ready for PowerMetrics. Until now.
Our metric-centric vision of the future was on solid footing, architecturally speaking, but the BI world wasn’t quite ready for this groundbreaking new approach - including us! We were so intent on providing a tool to free decision-makers from the technical complexities of working with data, we focused our messaging on end users only. As it turns out, most of them saw the metric-centric approach as an extra step, getting in the way of their primary goal – dashboards and reports.
We understood that decision-makers care deeply about consistent, trustworthy data. They want (and need) dashboards and reports they can trust. When that doesn't happen, they believe it's the data team's job to make it right. Our eureka moment? Trusted data is the common goal shared between end users and data teams. And, we’re pretty excited about that. As experience has taught us, working with data engineers, developers, and analysts has always led to better outcomes.
I should note that we got it right with MetricHQ. Our ever-growing community and library of metric definitions, helps everyone, business users and data teams, better understand and want to embrace metrics.
Metrics: The language of data AND business teams
Looking at the thousands of customers we've worked with, we now understand that the purpose and value of each team is only realized when they work together, each focused on what they do best. In the new, metric-centric BI world, data teams manage the vast amount of data and increasingly complex query landscapes, ensuring data integrity and governing access via a metrics layer. Business consumers can confidently trust their metric data and apply it consistently to dashboards, reports, and other consumption endpoints in a true self-serve manner.
Defined metrics are now the language of business and data teams alike. Everyone knows what they mean and how they are calculated (alignment!), and where the data comes from (lineage!). The metrics are stored and shared in a central place (governance!), which is sometimes also referred to as a metrics store or data catalog. Once the metric is created and shared with others, business users are no longer queuing to have the data team build yet another variation on a report (a repeating nightmare if you listen to most data or BI teams). Metrics are defined once, and used everywhere.
The future is data metric driven.
We’re excited for the future. This new metric-centric stack provides an end-to-end solution for data teams and business consumers alike, moving beyond the limitations of the old data warehouse-centric BI stack. There is a small but growing group of believers who are starting to talk more about this. Nick Handel, the co-founder of Transform (now part of dbt) for one, has been a vocal advocate of the metrics layer. Benn Stencil of Mode seems pretty passionate about this as well. Jordan Tigani, formerly Google BigQuery and now with DuckDB, is also hot on the metrics bandwagon, specifically on the idea that it’s not about big data anymore, but rather valuable metric data.
The metric-centric approach to business intelligence is a positive and necessary step. It offers a more efficient workflow, improved performance, scalability, and better governance and lineage. But, most importantly, it provides well-defined and well-understood business metrics to all levels of the organization, empowering users to make well-informed decisions with trust and confidence.
Data needs meaning. Organizations need to start investing in a metric-centric solution, not just as a tool but also as a mindset. With a metric stack in place, organizations can better align their analytics strategies and drive business success. The future of business intelligence is here, and it's all about metrics.
Related Articles
Case Study: How Media Propulsion Laboratory improved client analytics with the PowerMetrics – BigQuery integration
By Cathrin Schneider — September 12th, 2024
Metrics provide rich context for better AI: Introducing the new PowerMetrics AI experience
By David Mennie — June 21st, 2024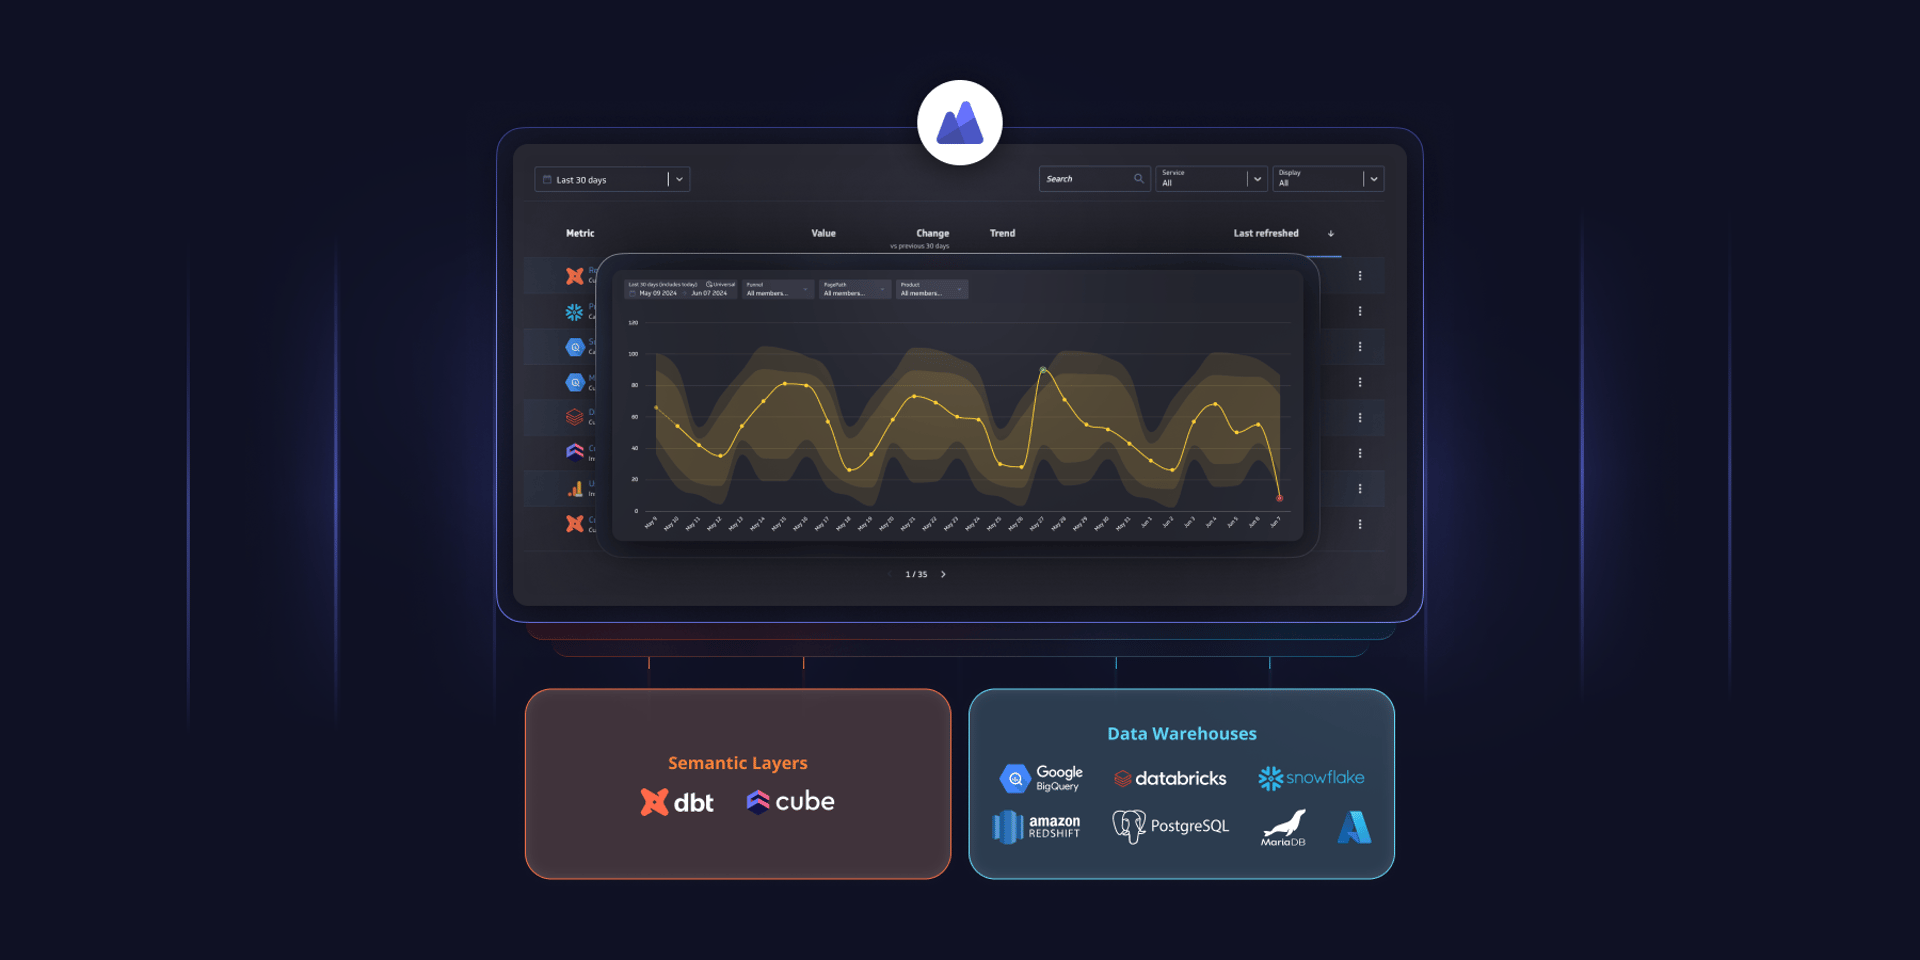
PowerMetrics - New data warehouse integrations and Cube semantic layer support
By David Mennie — June 14th, 2024