
Is Klips good? What real users say about its pros and cons
Thinking about Klips? See what real customers say about its data connections, real-time dashboards, support and value, plus the trade-offs to plan for.
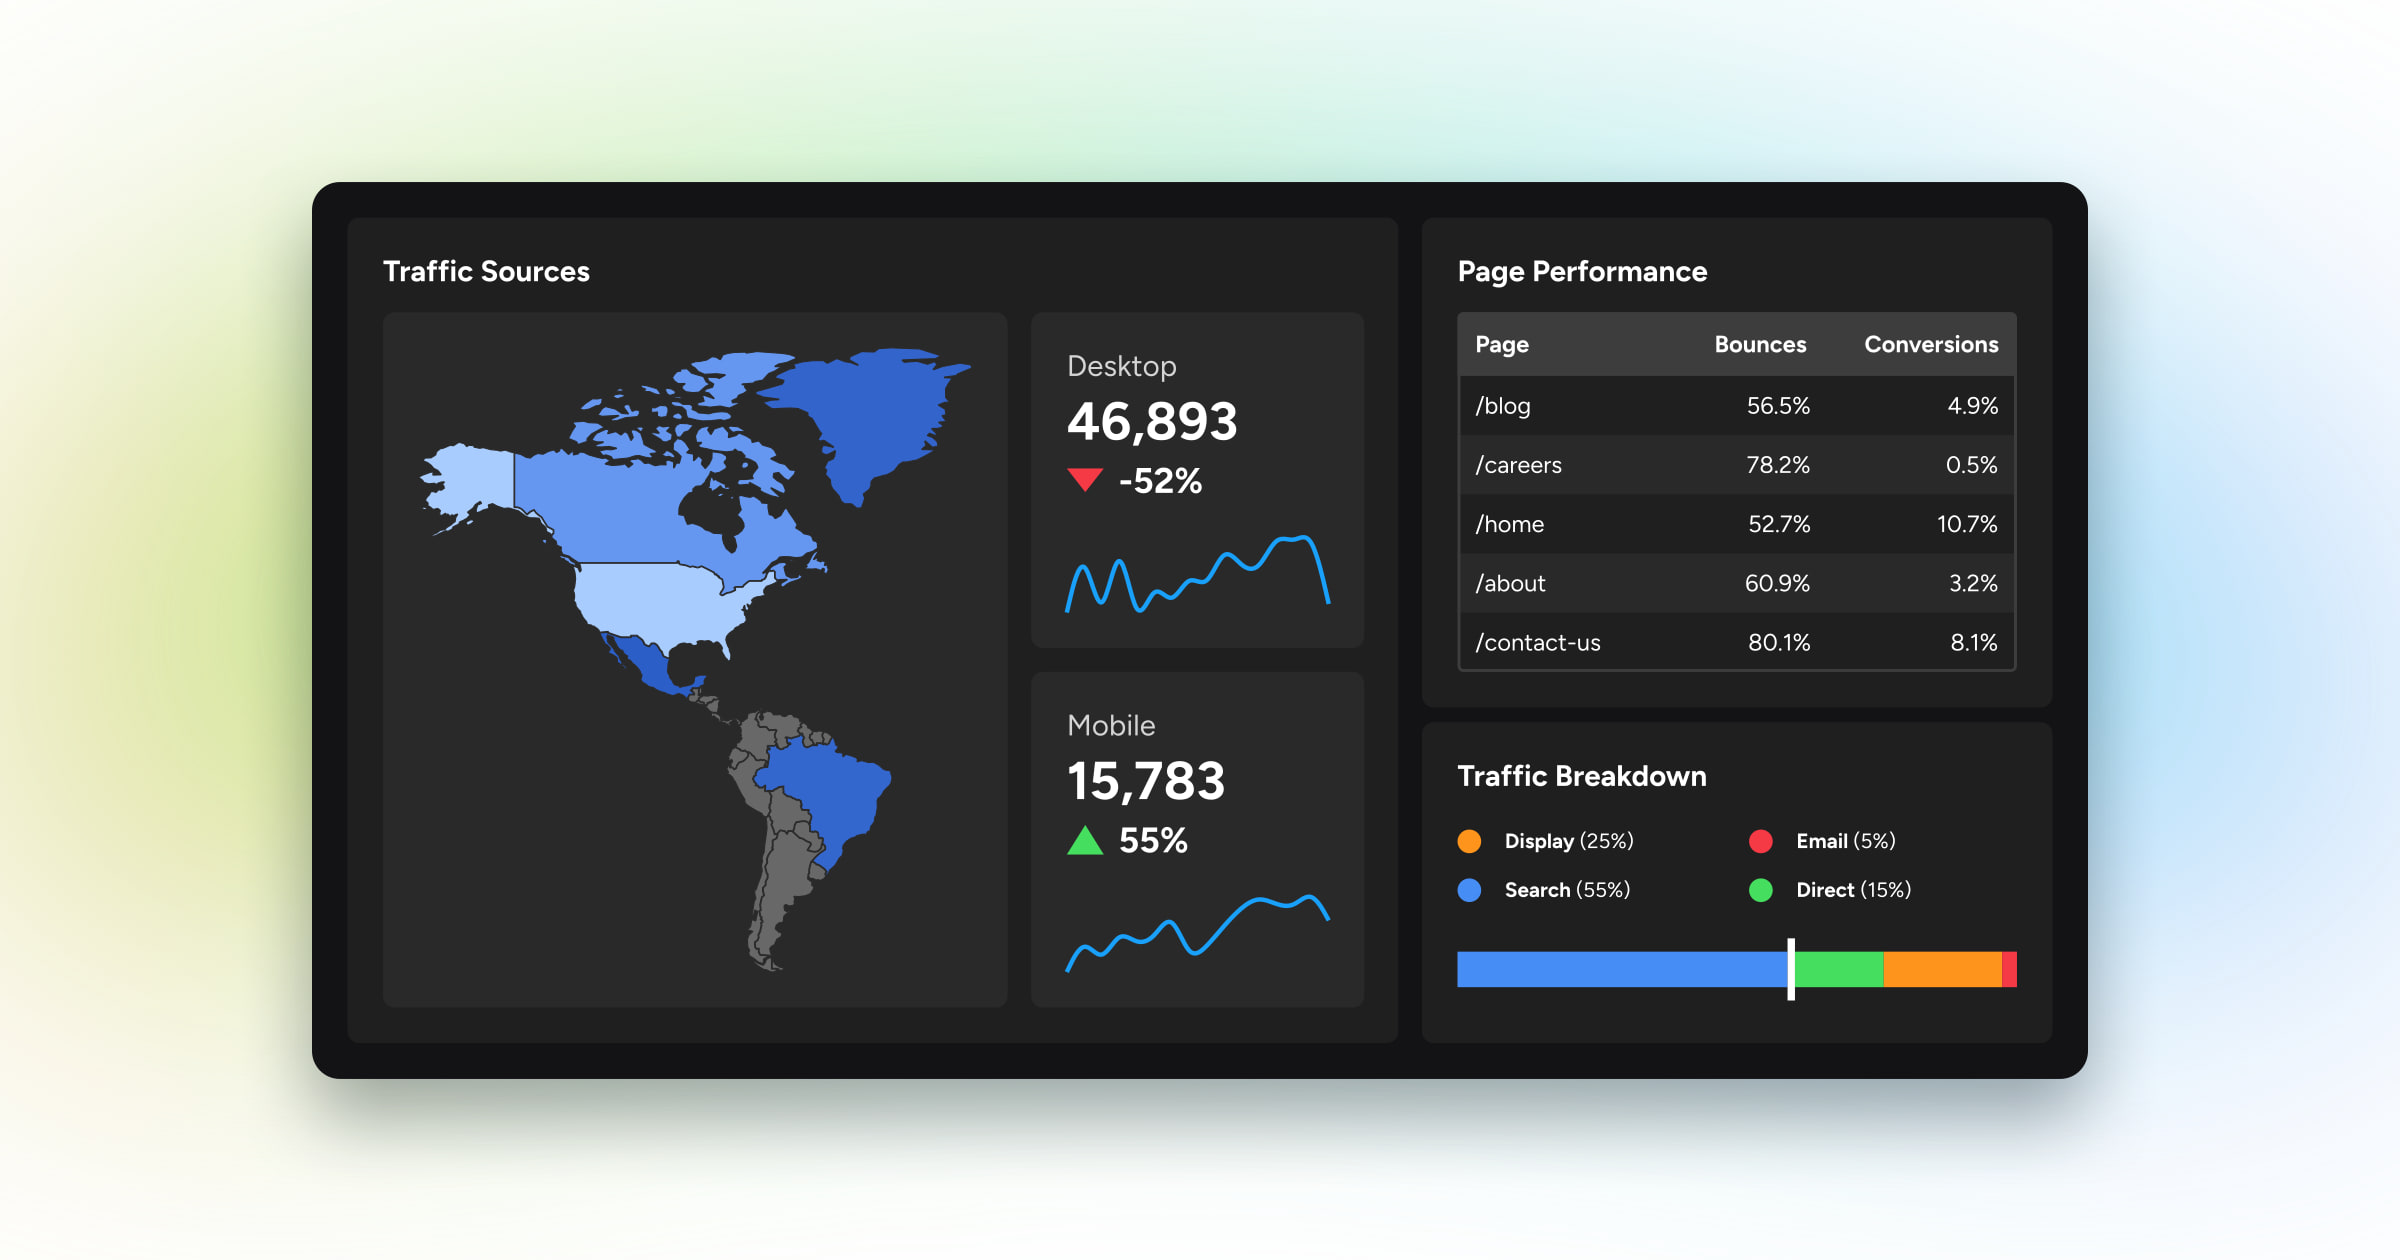
Looking at Klips for dashboards and reporting? This roundup collects what real customers say about it, the pros and cons that come up most, and practical guidance to help you decide whether it fits your team.
Klips is Klipfolio’s dashboard and reporting product, used by thousands of small and mid-sized teams. Most buyers want to know one thing: is it good for everyday KPI tracking and executive dashboards? The short answer is yes, especially if you want flexible data connections, real-time views and strong customization without the overhead of heavier BI tools.
Customers consistently praise its connectivity, time to value and support. They also point to a learning curve once you move into advanced features. The quotes below are grouped by the themes buyers ask about most, so you can weigh them against your own use case.
What real users say about Klips
Flexibility and integration
Most teams start with scattered spreadsheets, app dashboards and exports. Klips pulls those sources together.
- “Used as a solution that can pull data from various different sources and that data can be used to create dashboards.” (Gulam Gaus Warsi, Leadbook)
- “Aggregating our client data from multiple platforms and centralizing.” (Art Stiefel, Trajectory)
- “All my reporting requirements have been met. Salesforce, HubSpot, Mailchimp, Google Drive, and other business applications are quite easy to integrate with.” (TrustRadius review)
- “It has a powerful and flexible visualization interface and is one of the very rare platforms that allows you to connect to virtually any data source.” (Stéphane Hamel)
- “If you have complex data that needs cleaning… Klipfolio is for you!” (Crozdesk review)
Takeaway: if your data lives in cloud apps, files or databases, you can bring it into one place and shape it for your team.
Real-time data and visualization
When leaders want an always-on view of the business, automatic refresh and clear visuals matter.
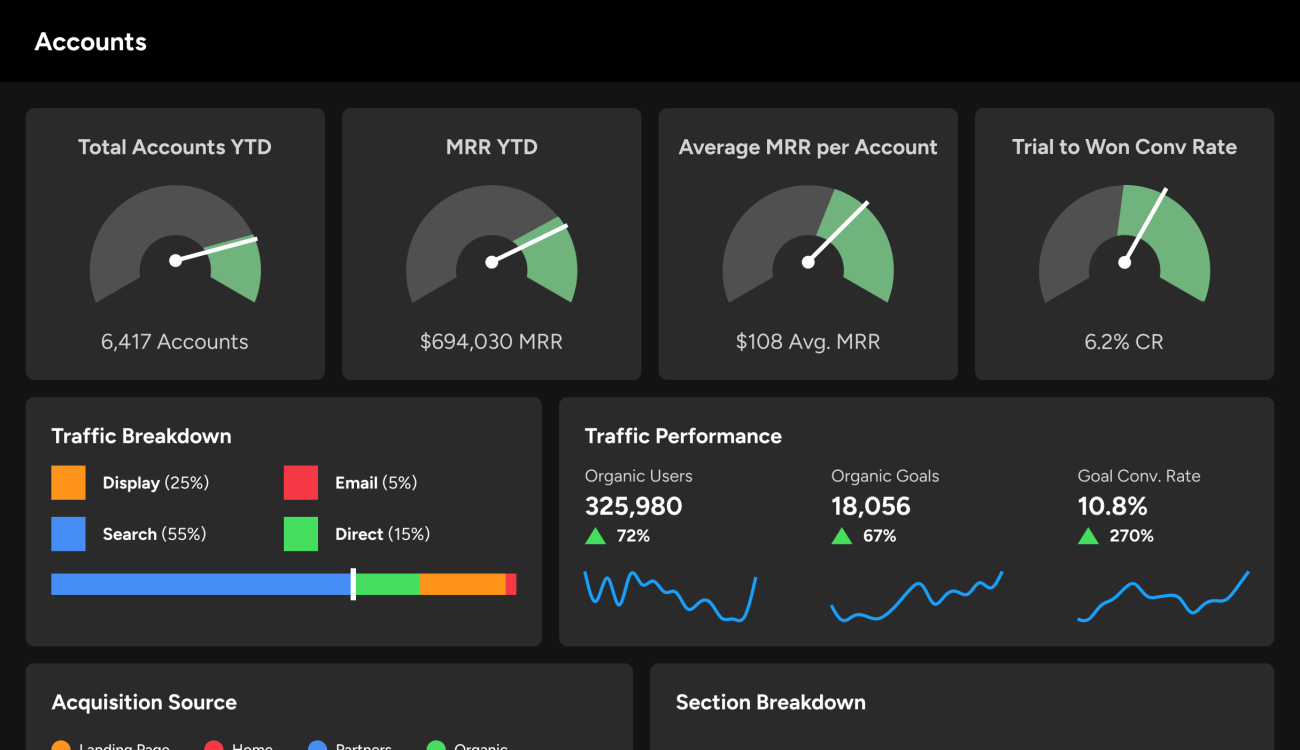
- “We no longer spend time at the executive level pulling data from multiple sources for a report that’s stale after 1 day. Our executives are all logging into Klipfolio and tracking real-time metrics of the company to drive business decisions.” (Brian Dainis, Curotec)
- “The information you need is at your fingertips in a matter of seconds.” (TrustRadius review)
- “It has saved me a ton of time by updating automatically, and their visualizations are fantastic.” (Crozdesk review)
- “Data and Klipfolio dashboards are the backbone of our company’s success.” (Piyush Parikh, Equinox Agents)
- “Since the implementation of Klipfolio, we are much smarter about our business… It’s truly been an incredible piece of software within our organization.” (Elliot Campbell, Trace Medical)
Ease of use, with trade-offs
Many teams find the interface approachable for day-to-day work, while power users go further with formulas and data modelling.
- “Super simple and easy to set up, move and size components, and display.” (TrustRadius review)
- “Its interface feels approachable even if you’re not deeply technical, yet it offers sophisticated backend tools for more advanced users.” (Research.com review)
- “The learning curve is high, but there is plenty of documentation and their support is stellar.” (Crozdesk review)
- “There are YouTube tutorials that explain how to make klips.” (TrustRadius review)
What this means for you: building straightforward dashboards is quick. Custom API work, multi-source joins and complex formulas take more time and skill.
Value for money
Buyers want fair pricing and a clear return.
- “Affordable alternative to high priced BI tools.” (Crozdesk review)
- “We think it’s worth the money.” (TrustRadius review)
- “Its scalable design and flexible pricing make Klipfolio an accessible choice for small and medium-sized enterprises.” (Research.com review)
Takeaway: the return is strongest when Klips replaces manual reporting and consolidates tools.
Customer support
Responsive help gets teams live quickly.
- “I have never seen so many useful resources, step-by-steps, and such an extensive resource portal.” (Crozdesk review)
- “Whenever I have a question, the customer service is always there to answer it.” (TrustRadius review)
- “We were able to get our dashboard up and running in under a week… I can truly recommend Klipfolio.” (Michalis Koumbarakis, CV Pics)
Design and customization
Teams care about branding, layout control and clarity on TVs, phones and in reports.
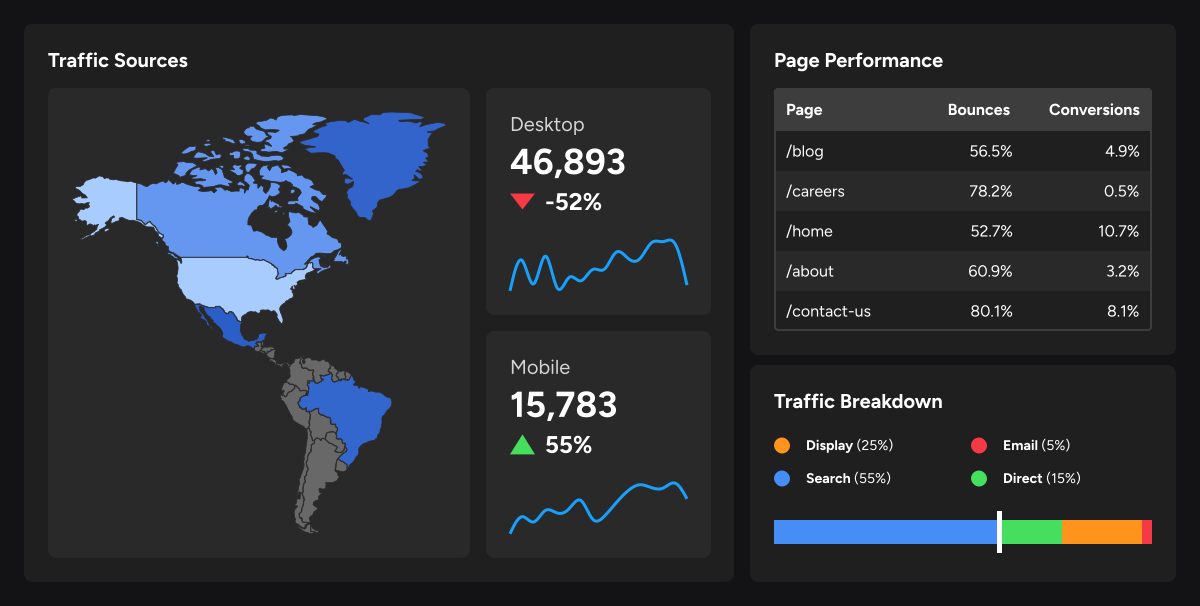
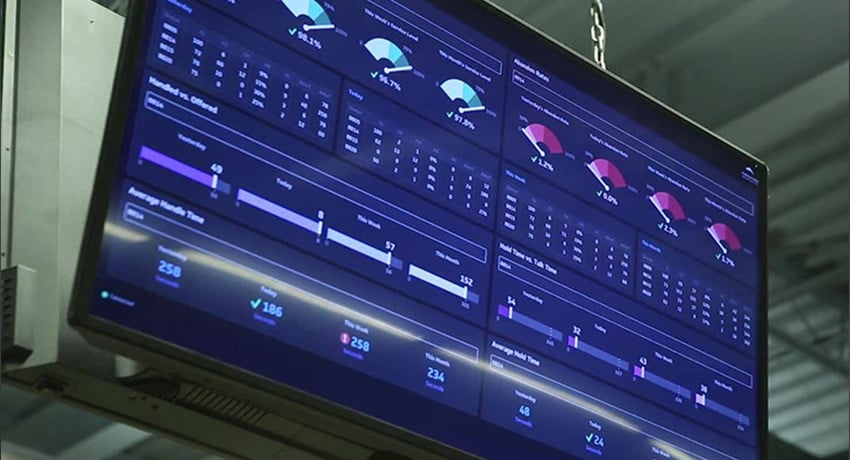
- “Great looking dashboards that fits very nicely on a big screen.” (Stéphane Hamel)
- “The creators of Klipfolio are true masters of visualization, displaying real-time data in clear beautiful charts, graphs, and diagrams.” (Rodrigo Rojas, TimeHunter)
- “Freedom to Customize: Add your own logo; customize the look, feel, and functionality of visualizations and dashboards.” (Crozdesk review)
Impact on decisions
Dashboards only matter if they change how people work.
- “Make complex data easy to understand and visualize.” (Joe Sae, UWM)
- “By dashboarding our most important KPIs, we’re able to remain focused and make day-to-day decisions with the big picture in mind.” (Sven Walther, Soshal)
- “Main benefit for us is to view data in one place.” (TrustRadius review)
- “Klipfolio helps me understand what ‘normal’ is.” (Dan Crane, InfoAddict)
When to ask for help
Custom APIs, complex modelling and heavy transformations can call for technical skills. Customers who got there recommend leaning on experts.
- “Figure out the graphs you want… and bring it to a Klipfolio Data Hero.” (Scott McKenzie, Tantalus)
- “Don’t be afraid to ask for help… It is worth every penny.” (Elliot Campbell, Trace Medical)
Klips pros and cons
Pros
- Connects to almost anything: spreadsheets, cloud apps, APIs and SQL, with room for custom data sources and modelling
- Real-time dashboards that leaders actually check
- A strong visualization library, TV mode and brandable dashboards for desktop and mobile
- An approachable everyday interface with room to grow into advanced formulas
- Helpful support, extensive documentation and a partner network
- Good value for small and mid-sized teams replacing manual reporting
Cons
- A learning curve for complex builds, API work and multi-source data prep
- Non-technical users may need starter templates or coaching
- Perfecting layouts and advanced interactivity can take a few iterations
Is Klips worth it?
Klips is a strong fit if you:
- Need to centralize KPIs from many apps and files
- Want leadership to see real-time metrics on TVs, phones or emailed PDFs
- Have a manager or analyst comfortable with formulas and light data prep
- Care about brand control and layout flexibility
Klips may be less ideal if you:
- Expect a one-click build for complex data models
- Prefer rigid, pre-built dashboards with minimal configuration
- Need a data-science analytical workbench
If the first list sounds like your team, Klips will likely meet your needs with room to grow.
Testimonials by use case
Marketing and sales reporting
- “We used to spend hours logging into different apps to monitor our marketing efforts. Now, Klipfolio makes it easy to see all the data we need in one place.” (Stephen Kunz, Qualtry)
- “We love the visuals that Klipfolio adds to our data… it makes it so much easier to digest the data we get from our consumer emails.” (Liz Bazner, A&W)
- “Data when you need it… see results in real time.” (Jean Devenish, webproof.com)
- “If you want to show stuff to C-level people on a regular basis, the nice shiny dashboards… are the business.” (Reddit user)
Finance and operations
- “We pull in financial data from several data points and look into the future… on target to grow by 40–50% this year thanks to our insights from Klipfolio.” (Brian Dainis, Curotec)
- “We don’t need to wait for the next report… now, with Klipfolio, we understand in real time.” (Taras Velychko, MagneticOne Group)
Team alignment and habits
- “Being able to monitor your KPIs anywhere at any time ensures that they are always on your mind.” (Josh Flores, Comet Backup)
- “Give it a try… when your dashboard is showing you all of your engagement efforts in one place. The conversations will begin and people will become more engaged.” (Arthur Boone, Cresa)
For full stories, see our customer case studies.
How to get the best results with Klips
- Start with one critical dashboard and keep the scope tight.
- List the 5 to 10 KPIs that matter most, then design for the “2:20:200” reading pattern. (Marcus Taylor, Venture Harbour)
- Connect your data sources, and note the owner, refresh cadence and reliability of each.
- Start from dashboard examples to speed up the build, then customize.
- If you hit a wall, book a quick session with support or a partner. It saves days.
The verdict
If your team needs flexible connections, real-time visibility and polished presentation, Klips is a strong pick. It rewards a little setup with dashboards that become a daily habit. Run a small pilot with one team, confirm the value, then expand to other departments.
Updated 2026-11-11
Continue learning
Best practices for TV and wallboard dashboards
Klips MCP Server: Use AI to Work with Your Data

Project Management Dashboard: Guide to KPIs and Examples
The consolidating stack: 3 years of SMB data connection trends
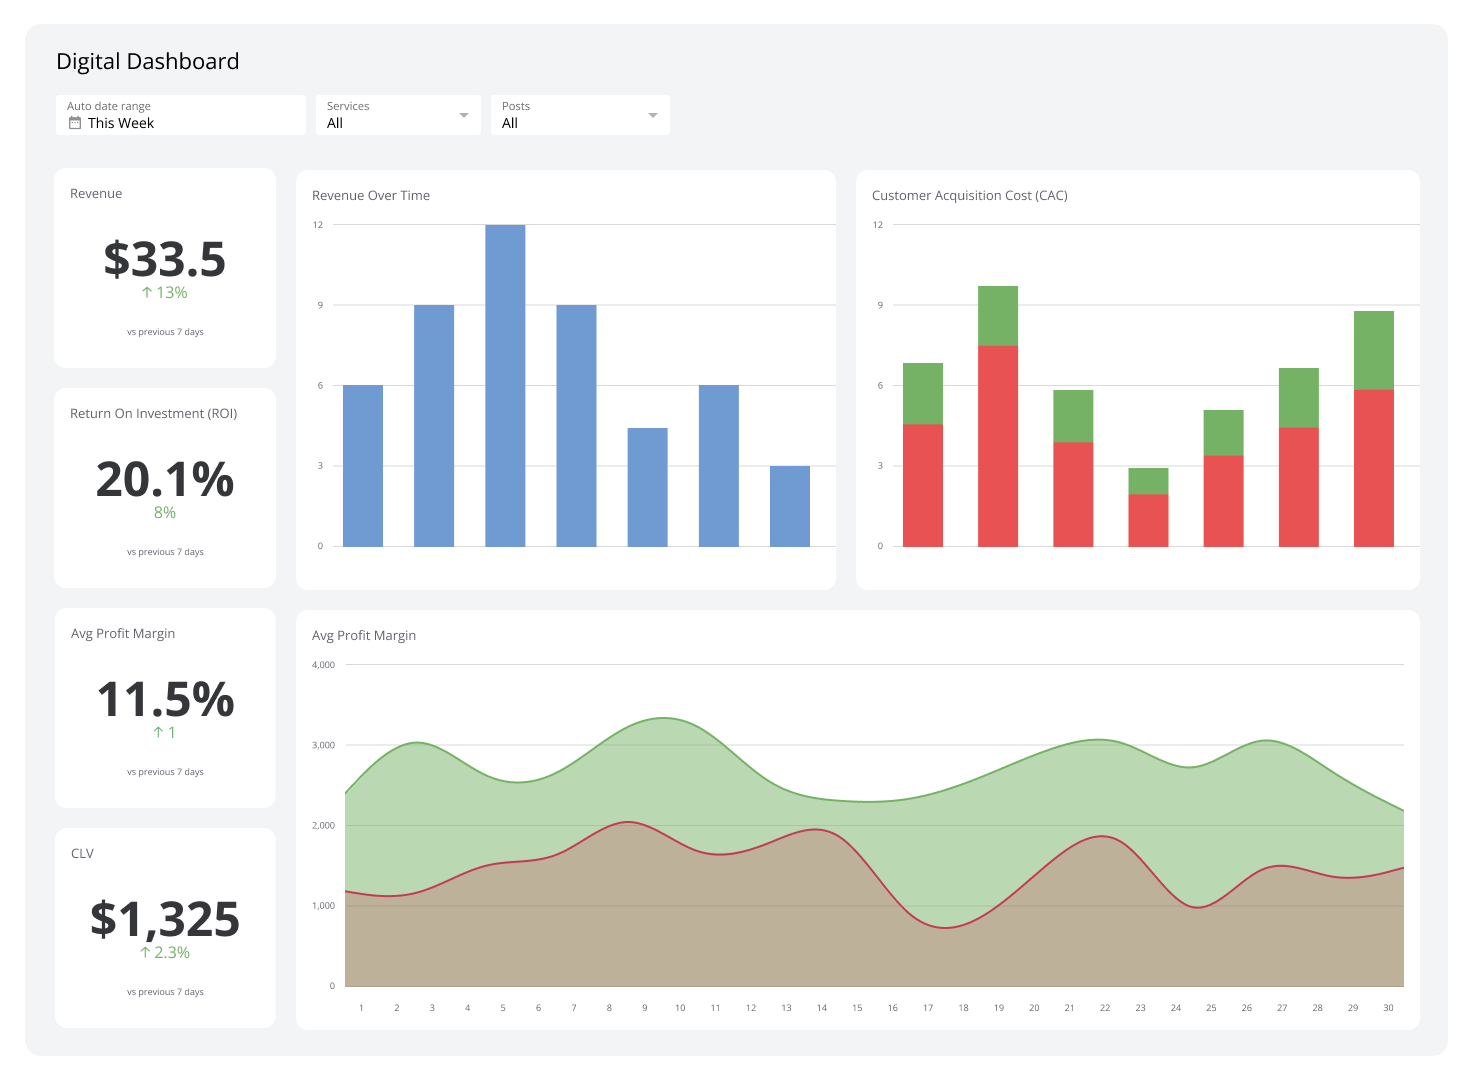
What Is a Dashboard? Types, benefits, and how to build one
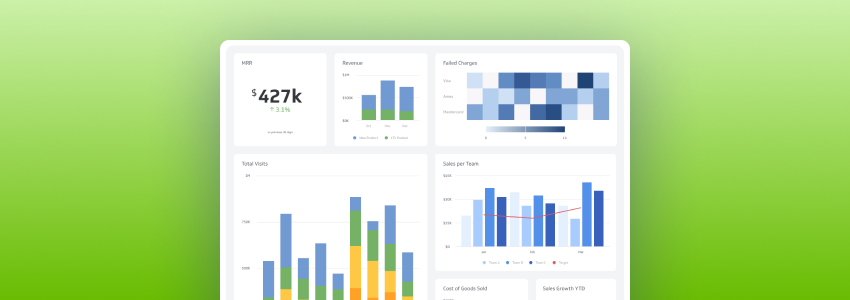
KPI report building: how to track and share key metrics
Most recent
- NOV 10The owner is the data team: SMB data stack research
- OCT 16Klips MCP Server: Use AI to Work with Your Data
- SEP 2310 ways to automate Klips with the Klips API
- SEP 14Automate Klips: from repetitive tasks to managing reporting at scale
- AUG 20The consolidating stack: 3 years of SMB data connection trends
- MAY 28Dashboard Data Security and Privacy: A Five-Layer Framework