
The owner is the data team
Who builds a small business data stack? Three years of Klipfolio data show founders leading, distinct role habits, and where integration support tickets pile up.
Klipfolio Research: November 2026
Our first report, The Consolidating Stack, showed what small and mid-sized businesses connect to. This one asks who is doing the connecting, and what happens when the connections break.
Every connection a customer makes can carry a job role. Pair that with three years of anonymized data, a look at what customers ask our support team about, and a review of third-party research, and a clear picture forms of the person behind the stack.
Five findings stood out:
- The founder is the data team. Founders and executives account for about 40% of role-identified connections, up from 36% to 44% over the period, while marketing slipped from 22% to 15%.
- Every role has a fingerprint. Marketers connect advertising platforms at 2.5 times the SMB average, finance staff connect accounting tools at 2.3 times, and data and technical staff connect databases at 1.8 times.
- Technical staff did not drive the consolidation. Their stacks barely moved. The simplifying happened among founders and marketers.
- Integration friction is uneven. Social, finance, and e-commerce connectors generate more support tickets than their usage would predict. Databases generate far less.
- Outside research mostly agrees. It explains two of the biggest moves: a Google Analytics shutdown and a run of Meta API deprecations.
Methodology, in brief: All figures are percentage shares, not absolute counts. Data covers accounts below 1,000 employees only, compared across the same two-month window (Jul–Aug) in each of three consecutive years. Job role is recorded for roughly one in six connections, consistently across all three periods; the role analysis draws on over 3,000 role-identified connections pooled across the three snapshots. Seventeen role labels were grouped into six personas (listed below), and the Sales group is too small for trend analysis. The support analysis is an aggregate keyword review of more than 4,000 anonymized support tickets from 2024 to 2026; no individual ticket or customer is identified. Full caveats are in the Notes and cautions section at the end.
| Persona | Job roles included |
|---|---|
| Founder / Executive | Founder/Executive |
| Marketing | Marketing |
| Sales | Sales |
| Finance | Finance |
| Data & Technical | Data Analyst, Data Engineer/Architect, Database Administrator, Development, Business Analyst, Data Steward |
| Managers & Ops | Manager, Product Management, Support, Human Resources, Other, and the two builder-type labels |
1. Who is building the stack?
Among connections where a role is known, one group dominates.
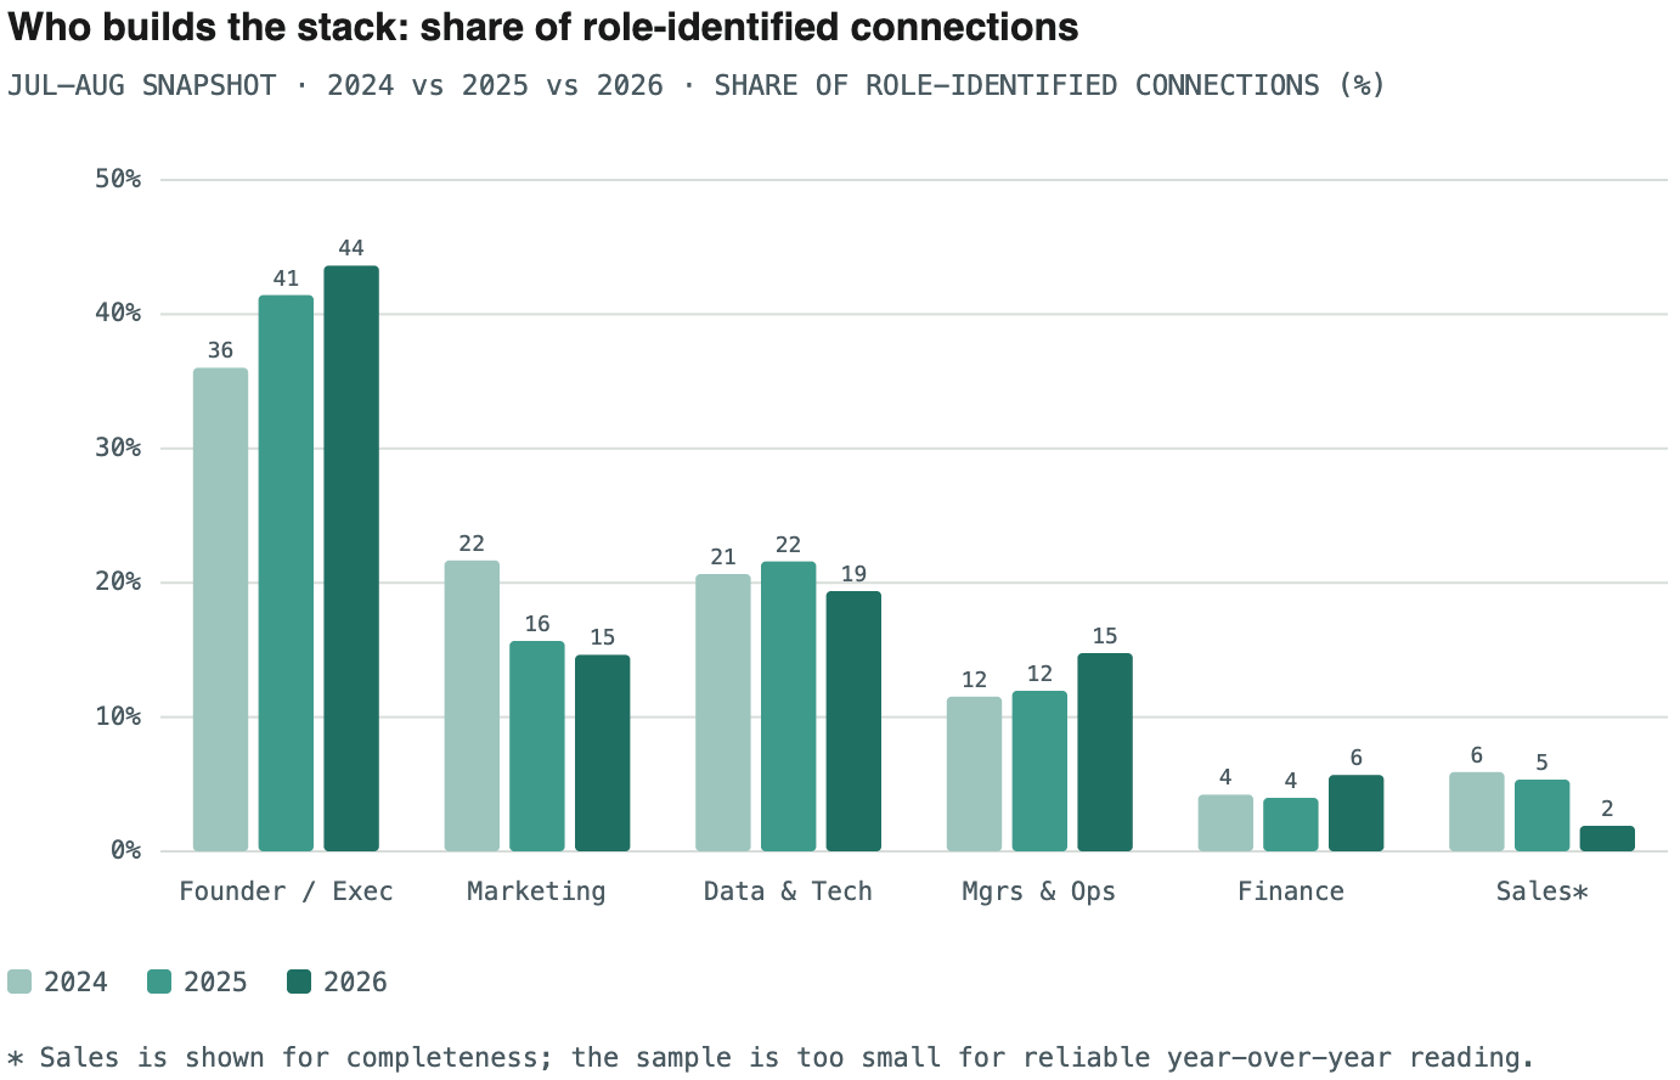
Founders and executives make roughly 40% of the role-identified connections across the full period, and their share rose from 36% in 2024 to 44% in 2026. Marketing moved the other way, from 22% to 15%. Data and technical roles held at about one in five (21%, 22%, then 19%), while Managers & Ops edged up from 12% to 15% and Finance from 4% to 6%.
That is consistent with older survey evidence. A Salesforce survey of small business owners found that most owners were personally responsible for technology buying decisions and that the large majority of small businesses had no IT staff. That figure is from 2016, so treat it as direction rather than a current benchmark. Dresner Advisory Services reports that executive management and finance are consistently among the functions that drive business intelligence, though it is not an SMB-specific study and also finds operations and IT leading.
Our take: In a company without IT staff, the person who sets up the analytics tool is usually the person who signs the checks. The "data team" is one busy person with a day job, which argues for tools that need minimal setup and little upkeep. That is an interpretation of the pattern, not something the data measures directly.
2. Every role has a fingerprint
Pooling the three periods gives a more stable picture of what each persona connects. The index below compares each role's mix to the average across all roles.
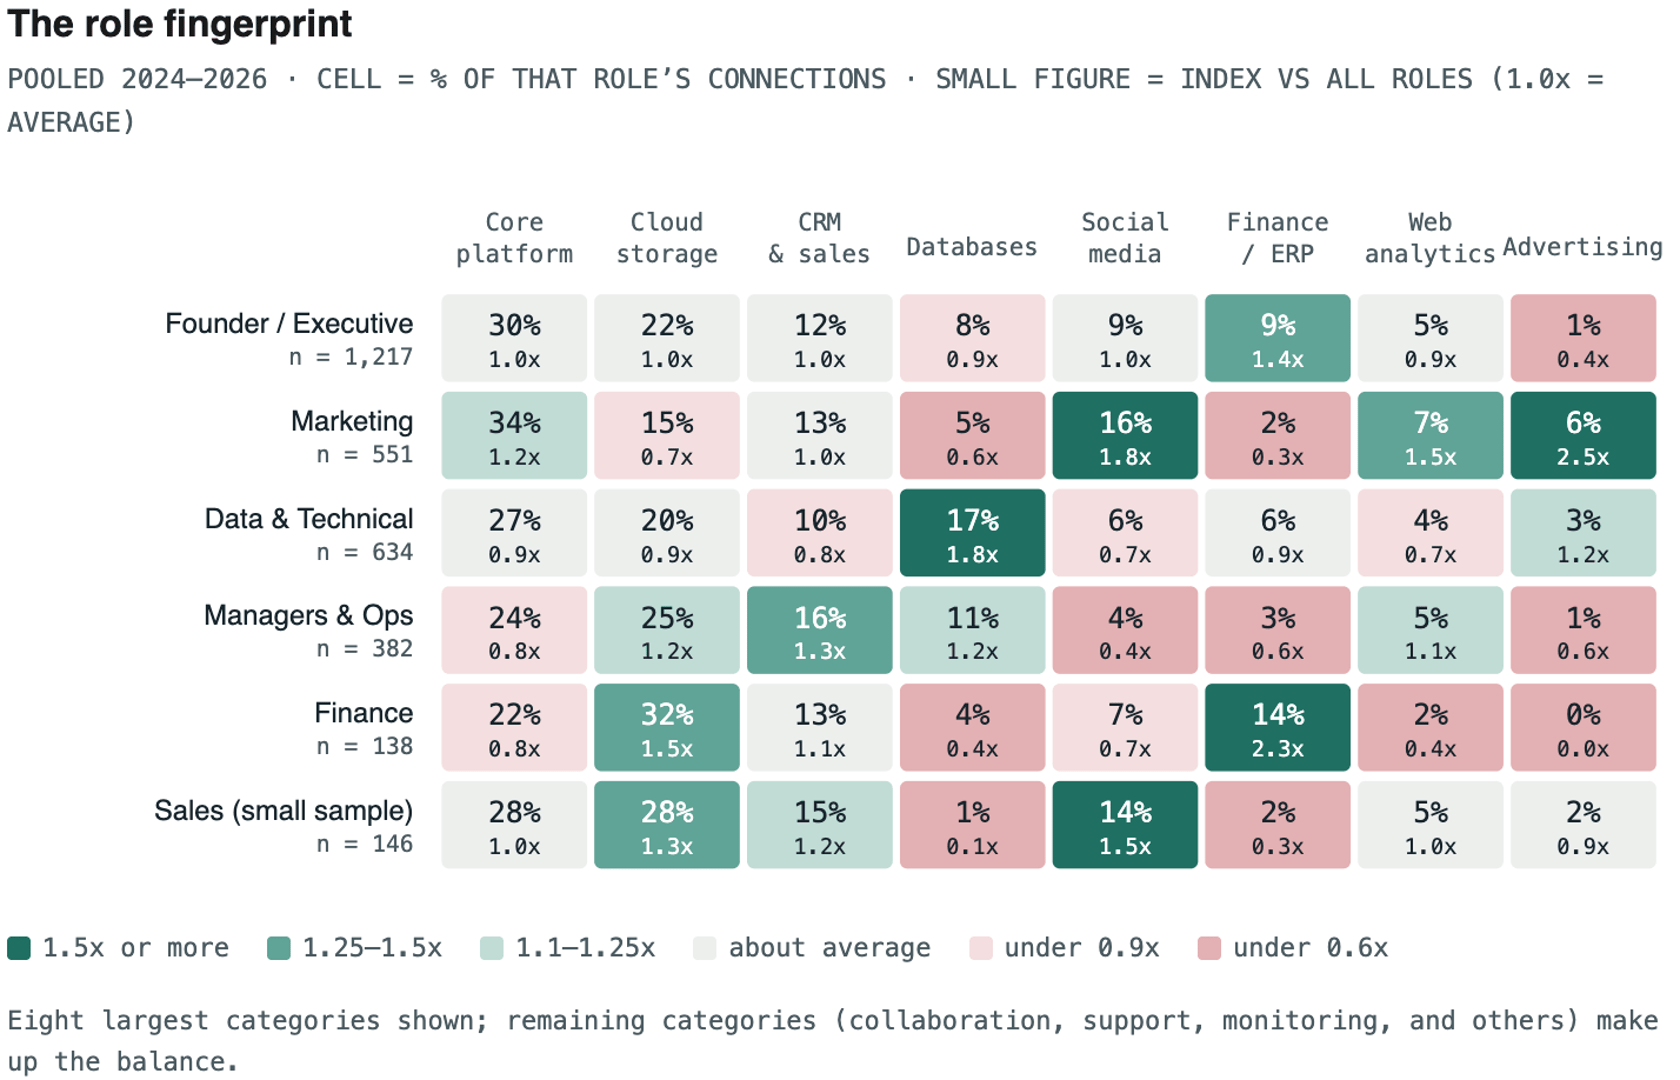
- Marketing leans toward advertising platforms (2.5x the average), marketing automation (2.5x), social media (1.8x), and web analytics (1.5x). It under-indexes on databases (0.6x) and finance tools (0.3x).
- Finance over-indexes on accounting and ERP tools (2.3x) and cloud storage (1.5x), and very rarely connects databases (0.4x). Spreadsheets and shared drives are the finance team's native habitat.
- Data & Technical staff over-index on databases (1.8x) and IT monitoring (2.4x), and under-index on social media (0.7x).
- Founders and executives look most like the overall average, with one tell: they over-index on finance and accounting tools (1.4x) and rarely connect advertising platforms (0.4x). The owner watches the books, and someone else runs the ads.
- Managers & Ops lead on project tools (2.5x) and e-commerce (1.9x), though both rest on small counts.
Core platform connectors, which are mostly spreadsheet and Google-based, sit between 22% and 34% for every role. That makes them the common floor under every persona. The practical reading is that "SMB analytics" is really several different jobs sharing one spreadsheet-shaped foundation.
3. Who drove the consolidation?
In the first report, social media, web analytics, and advertising lost share while cloud storage, core platform, and database connectors gained it. Role data lets us ask whose stacks changed.
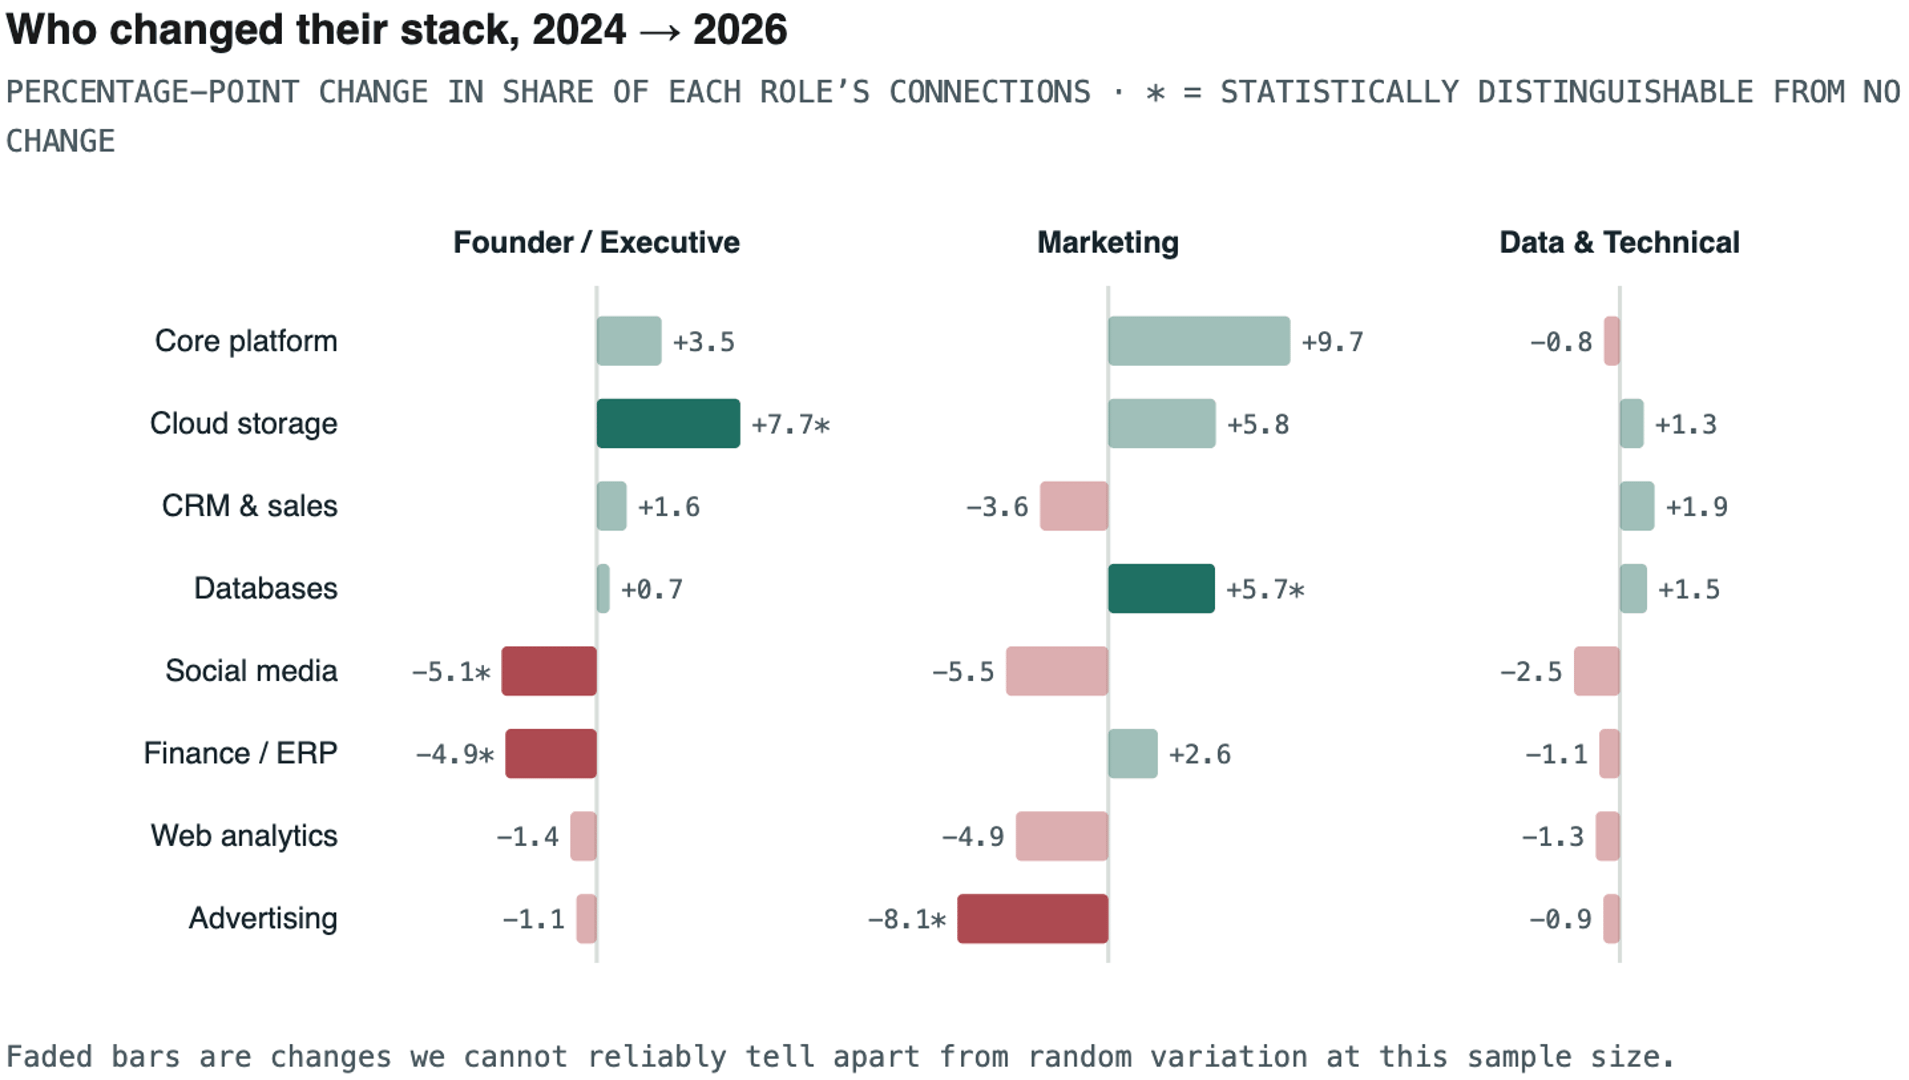
Two groups moved clearly. Among founders and executives, cloud storage rose by about 8 points, while social media and finance tools each fell by about 5 points. Among marketers, advertising connections fell by about 8 points as a share of their stack, and database connections rose by about 6. The data and technical group is notable for what did not happen: every change was within roughly 2.5 points and none could be distinguished from random variation.
We also asked whether the shift came from who is connecting (the persona mix) or from what each persona connects (within-role change). Almost all of it is within-role.
| Category | Total change (pts) | From shifting persona mix | From within-role change |
|---|---|---|---|
| Social media | −5.3 | −0.6 | −4.6 |
| Advertising & paid media | −2.9 | −0.4 | −2.5 |
| Web analytics & SEO | −2.8 | −0.1 | −2.7 |
| Finance, accounting & ERP | −1.1 | +0.6 | −1.7 |
| Databases | +1.7 | +0.4 | +1.3 |
| Core platform | +4.2 | −0.4 | +4.5 |
| Cloud storage & productivity | +7.0 | +0.1 | +6.9 |
So the consolidation is not simply "fewer marketers." Within roles, people are connecting fewer social, analytics, and advertising tools and leaning more on shared drives and spreadsheets.
Caution: The role-identified subset moves more sharply than the full customer base. Social media fell by 5.3 points here versus 1.8 points in the first report. Treat this section as directionally interesting, with a grain of salt: it shows who is changing and which way, not how large the overall shift is. The marketing sample is also small in the most recent period, and we ran many comparisons, so treat individual significant results as leads rather than conclusions.
4. What the support desk adds
Usage shows what customers connect. Support tickets show where connecting gets hard. We counted mentions of eight connector families in customer support tickets (excluding cancellations, sales questions, system notifications, and a few other non-product categories) and compared each family's share of those mentions with its share of connector usage. A value above 1.0x means a family generates more support tickets than its usage alone would predict.
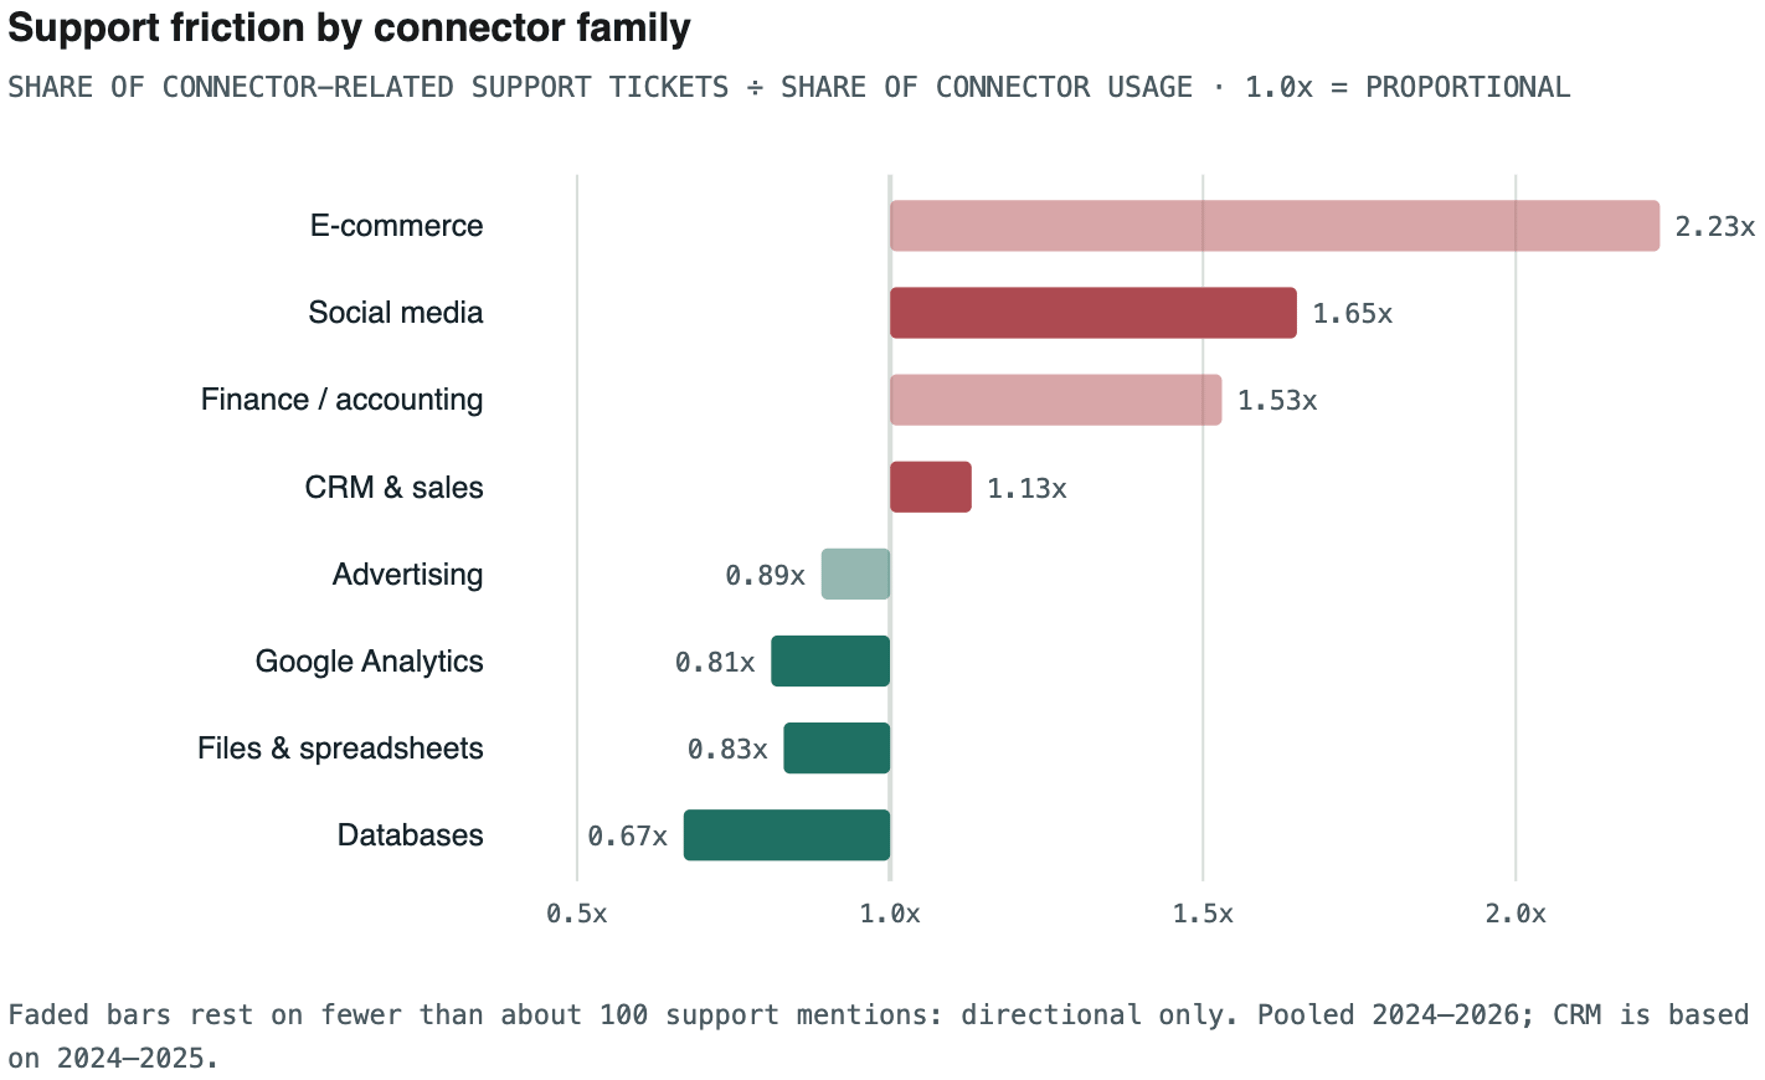
Databases are the low-friction category at about 0.7x: they account for a much larger share of usage than of support tickets. Social media (1.6x) and finance tools (1.5x) run well above proportional, CRM sits modestly above (1.1x), and e-commerce is higher still, although its count is small. Files and spreadsheets are the largest single topic in support tickets but sit below proportional (0.8x) because they are also the largest share of usage.
Friction alone does not explain who loses share. Social media is both high-friction and declining, and databases are low-friction and gaining. But advertising and Google Analytics lost share while running below proportional friction, which points to other forces covered in the next section.
The Google Analytics signal
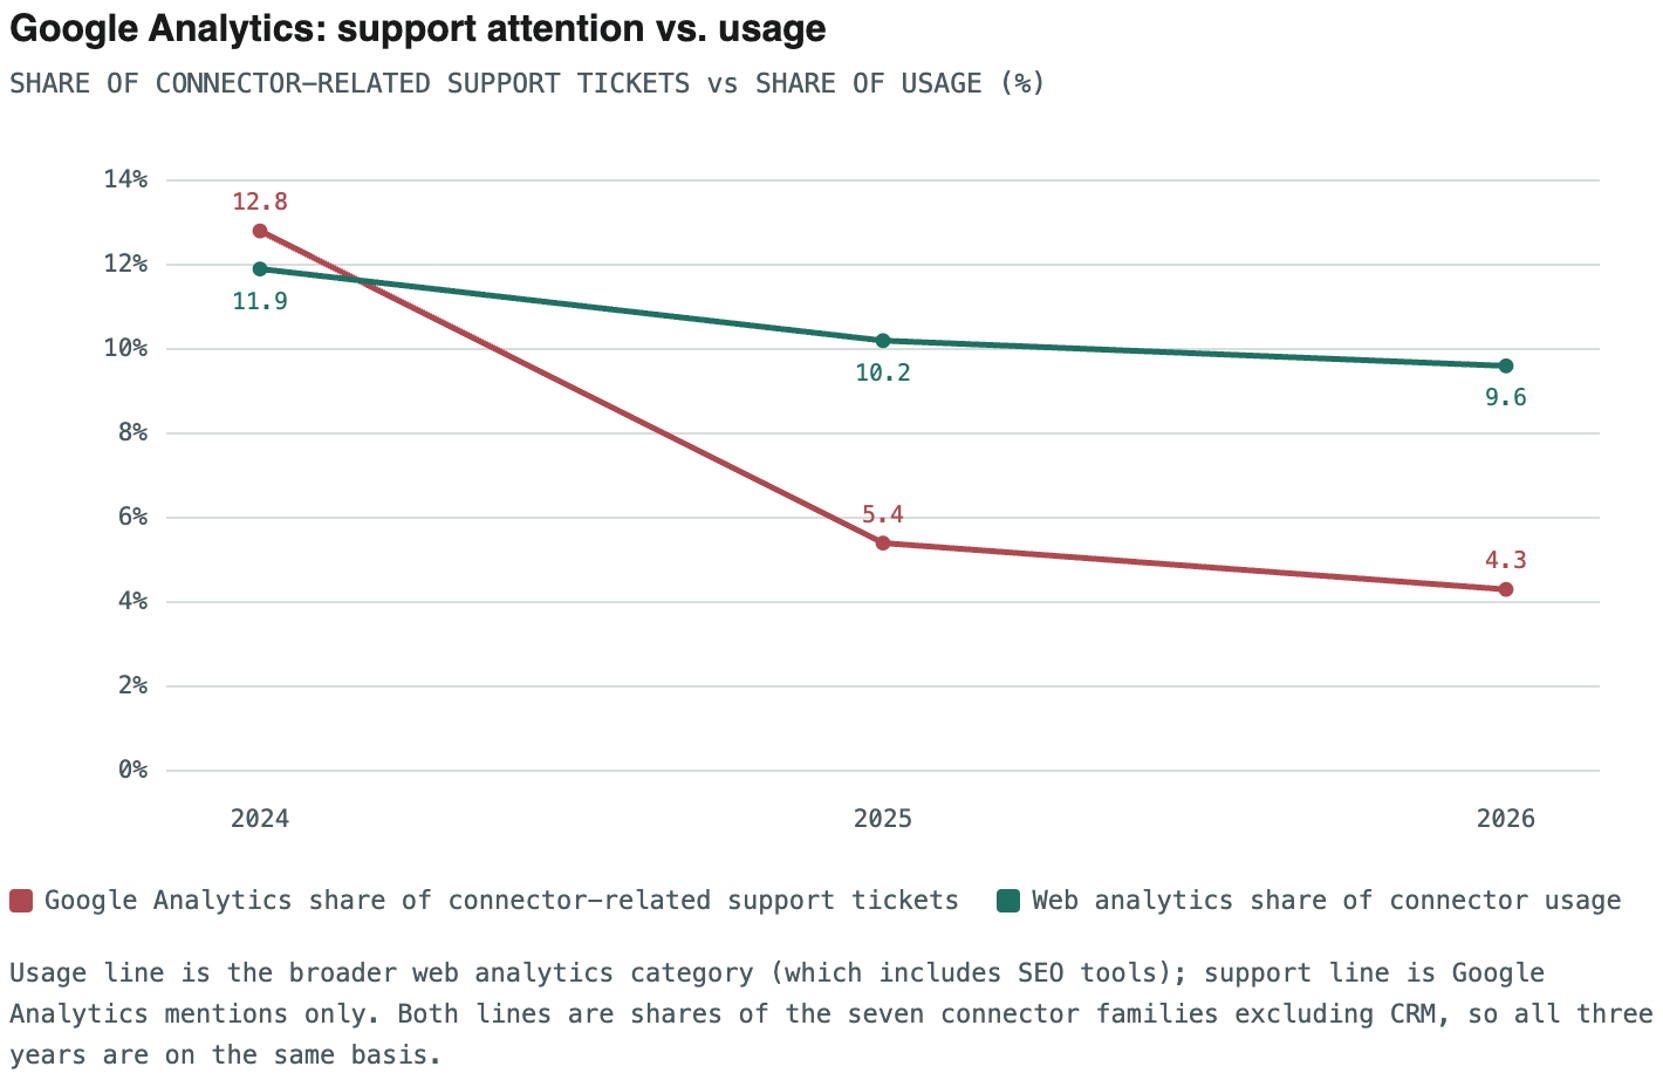
Google Analytics mentions fell from about 13% of connector-related support tickets in 2024 to about 4% in 2026, much faster than the web analytics category lost share of usage. Google ended access to Universal Analytics properties and deleted their data starting the week of July 1, 2024, the same month our data window opens, so 2024 captures the migration scramble. Once customers moved to GA4 or left, the tickets dried up. Because the underlying counts are modest, read this as a clear direction rather than a precise measurement.
A null result worth reporting: We tested whether some roles are more exposed to friction by weighting each role's connector mix by the friction index above. Every role came out within about 5% of average, from 0.95x for Data & Technical to 1.05x for Finance and Sales. Support tickets cannot be linked to job role directly, so this is a modeled estimate, but it suggests friction is a feature of connector families, not of roles.
5. Are we seeing what others see?
We checked each major finding against outside research. Most are corroborated, and two have specific external explanations.
| Our finding | Outside evidence | Read |
|---|---|---|
| Founders and owners are the primary builders | Salesforce's small business survey (2016) found most owners were responsible for technology buying and most firms had no IT staff. Dresner's 2025 BI study lists executive management and finance among the top drivers of BI. | Consistent, though the Salesforce data is dated and Dresner is not SMB-specific. |
| Marketing connections losing share | Gartner's 2026 CMO Spend Survey reports martech at 19.4% of marketing budgets, a five-year low versus 26.6% in 2021, with total marketing budgets roughly flat near 7.8% of revenue. | Consistent. Gartner's panel leans toward large companies, so SMB behavior may differ. |
| Google Analytics falls sharply from 2024 | Google shut down Universal Analytics, removing access and deleting data from the week of July 1, 2024. | Explains the timing directly. |
| Social media is high-friction and declining | Meta deprecated Facebook Page Insights metrics in waves (September 2024, June 2025, November 2025, and again in June 2026). Social tools such as Sprout Social, Supermetrics, and AgencyAnalytics all published notices about the changes. | Explains the friction. This is an industry-wide issue, not specific to us. |
| Spreadsheet-shaped platforms are the floor under every role | A survey reported by MarTech Series found 84% of professionals prefer spreadsheets for last-mile analysis, including many who already have access to a BI tool. | Consistent. We could not confirm the survey's date, so treat it as directional. |
| Whether AI is changing what SMBs connect | The Census Bureau's Business Trends and Outlook Survey puts AI use at roughly 17–20% of US firms from December 2025 to May 2026, with no significant change among firms under 20 employees in that window. | Not testable in our data yet; see below. |
The enterprise lens: where SMBs differ from Gartner and Dresner
Gartner and Dresner describe how larger organizations behave, which makes them a useful contrast.
- Who drives analytics. Dresner's 2025 study finds operations and IT most often drive business intelligence, followed by executive management and finance. In our SMB data, the founder or executive is the single largest builder (40% of role-identified connections), and technical roles are about one in five. With no IT department to lead, the executive fills the gap.
- Marketing technology. Gartner finds martech's share of marketing budgets at a five-year low, yet 62% of CMOs still plan to increase martech investment, and 15.3% of marketing budgets now go to AI. That reads as reallocation: fewer tools, with money moving toward consumption-based platforms and AI. In our SMB data, marketing connections are losing share and the marketing persona is shrinking as a share of builders, with no visible new category absorbing the shift. For SMBs this looks more like a retreat to core tools than a reallocation.
- Direction agrees; mechanism may not. Both lenses show consolidation. In larger companies a CMO decides to rationalize; in small ones the owner simply has less time and fewer people to maintain the connections.
That last point is our interpretation. Neither Gartner nor Dresner is built to test it, and neither is SMB-specific.
On AI specifically: our connector data has no AI-tool category, so it can neither confirm nor rule out a shift. If the owner is the data team, the owner is probably also the AI buyer, which makes this the most interesting question for the next report.
Notes and cautions for interpreting this data
- Role covers about one in six connections. Role-identified connections may not represent the full customer base, and in this analysis they moved more sharply than the whole.
- Personas are groupings. We collapsed seventeen role labels into six. Sales and Finance rest on small samples, and Sales is excluded from trend commentary.
- We tested many comparisons. With that many cuts, a few will look significant by chance. We mark differences that clear a standard threshold, but treat them as leads.
- The data window is 2.5 years. Reliable data begins in July 2024, and each year is a Jul–Aug snapshot.
- Support analysis is keyword-based. A ticket can mention several connectors, "files and spreadsheets" is a broad family, and several families have fewer than about 100 mentions. One outlier (2026 CRM mentions) was excluded.
- Tickets and roles cannot be joined. The role analysis and the support analysis are two lenses on the same customers, not a single linked dataset.
- Outside sources vary in quality and fit. Gartner and Dresner skew toward larger organizations, the Salesforce survey is from 2016, and the spreadsheet survey's date is unconfirmed.
- No industry cut yet. The industry dimension is not currently available for these metrics.
- This is Klipfolio's own customer base, not a random sample of all SMBs.
What this might mean going forward
If the owner really is the data team, the winning products and connectors will be the ones that work after a single setup session and keep working. That favors stable sources such as databases and shared drives, and it penalizes connectors that depend on third-party APIs that change on a quarterly schedule. Integration maintenance is an invisible cost that lands directly on a person who has no time for it.
Two questions are worth tracking. First, whether AI assistants change who builds the stack: if owners can ask questions in plain language, the role gap between founders and analysts could narrow further, or the connection itself could become invisible. Second, whether the friction gap between connector families widens as API deprecations continue. We plan to revisit both, with an industry view added once that data is available, in next year's refresh.
Data and tables
Every chart in this report is reproduced below as a table. All figures are percentage shares or indexes. Sample sizes (n) are aggregates across the full period.
Chart 1: Share of role-identified connections by persona
Jul–Aug snapshots. Each column sums to 100% across personas. Sales is too small for reliable year-over-year reading.
| Persona | 2024 | 2025 | 2026 |
|---|---|---|---|
| Founder / Executive | 36.0% | 41.4% | 43.6% |
| Marketing | 21.7% | 15.7% | 14.6% |
| Data & Technical | 20.7% | 21.6% | 19.4% |
| Managers & Ops | 11.5% | 12.0% | 14.8% |
| Finance | 4.2% | 4.0% | 5.7% |
| Sales (small sample) | 5.9% | 5.4% | 1.9% |
Chart 2: The role fingerprint
Pooled 2024–2026. First table: each category as a percentage of that persona's connections (the eight largest categories shown, so rows do not sum to 100%).
| Persona | Core platform | Cloud storage | CRM & sales | Databases | Social media | Finance / ERP | Web analytics | Advertising | n (pooled) |
|---|---|---|---|---|---|---|---|---|---|
| Founder / Executive | 30.0% | 21.7% | 12.2% | 8.4% | 8.8% | 8.8% | 4.6% | 1.0% | 1,217 |
| Marketing | 33.6% | 15.2% | 12.5% | 5.4% | 15.6% | 1.8% | 7.3% | 5.8% | 551 |
| Data & Technical | 26.7% | 20.3% | 9.8% | 16.9% | 5.8% | 5.5% | 3.6% | 2.8% | 634 |
| Managers & Ops | 24.1% | 25.1% | 16.0% | 11.0% | 3.7% | 3.4% | 5.5% | 1.3% | 382 |
| Finance | 22.5% | 31.9% | 13.0% | 3.6% | 6.5% | 13.8% | 2.2% | 0.0% | 138 |
| Sales (small sample) | 28.1% | 28.1% | 15.1% | 0.7% | 13.7% | 2.1% | 4.8% | 2.1% | 146 |
Second table: the same data as an index versus all roles, where 1.00x is the all-role average.
| Persona | Core platform | Cloud storage | CRM & sales | Databases | Social media | Finance / ERP | Web analytics | Advertising |
|---|---|---|---|---|---|---|---|---|
| Founder / Executive | 1.04x | 1.01x | 0.98x | 0.90x | 0.99x | 1.44x | 0.94x | 0.43x |
| Marketing | 1.17x | 0.71x | 1.01x | 0.58x | 1.75x | 0.30x | 1.48x | 2.55x |
| Data & Technical | 0.93x | 0.95x | 0.79x | 1.80x | 0.66x | 0.91x | 0.74x | 1.24x |
| Managers & Ops | 0.84x | 1.17x | 1.29x | 1.18x | 0.41x | 0.56x | 1.12x | 0.57x |
| Finance | 0.78x | 1.49x | 1.05x | 0.39x | 0.73x | 2.26x | 0.44x | 0.00x |
| Sales (small sample) | 0.98x | 1.31x | 1.22x | 0.07x | 1.54x | 0.34x | 0.98x | 0.90x |
Chart 3: Change in share of each role's connections, 2024 to 2026
Percentage-point change. An asterisk marks a change that is statistically distinguishable from no change; unmarked changes cannot be reliably told apart from random variation at this sample size.
| Category | Founder / Executive | Marketing | Data & Technical |
|---|---|---|---|
| Core platform | +3.5 | +9.7 | −0.8 |
| Cloud storage | +7.7* | +5.8 | +1.3 |
| CRM & sales | +1.6 | −3.6 | +1.9 |
| Databases | +0.7 | +5.7* | +1.5 |
| Social media | −5.1* | −5.5 | −2.5 |
| Finance / ERP | −4.9* | +2.6 | −1.1 |
| Web analytics | −1.4 | −4.9 | −1.3 |
| Advertising | −1.1 | −8.1* | −0.9 |
Chart 4: Support friction by connector family
Share of connector-related support tickets divided by share of connector usage, pooled 2024–2026. CRM is based on 2024–2025 only. A value of 1.00x is proportional.
| Connector family | Friction index | Sample |
|---|---|---|
| E-commerce | 2.23x | Directional (fewer than about 100 mentions) |
| Social media | 1.65x | Adequate |
| Finance / accounting | 1.53x | Directional (fewer than about 100 mentions) |
| CRM & sales | 1.13x | Adequate |
| Advertising | 0.89x | Directional (fewer than about 100 mentions) |
| Google Analytics | 0.81x | Adequate |
| Files & spreadsheets | 0.83x | Adequate |
| Databases | 0.67x | Adequate |
Chart 5: Google Analytics, support tickets versus usage
Both columns are shares of the seven connector families excluding CRM, so all three years are on the same basis. The usage column is the broader web analytics category, which includes SEO tools.
| Year | Google Analytics share of connector-related support tickets | Web analytics share of connector usage |
|---|---|---|
| 2024 | 12.8% | 11.9% |
| 2025 | 5.4% | 10.2% |
| 2026 | 4.3% | 9.6% |
Sources: Klipfolio internal connector usage data (accounts under 1,000 employees) and aggregated, anonymized support ticket analysis. External: Salesforce Research, 2016 Connected Small Business Report (via MediaPost, mediapost.com/publications/article/293938); Dresner Advisory Services, 2025 Wisdom of Crowds BI Market Study (via BigDATAwire); Gartner 2026 CMO Spend Survey (via Chief Marketer, Webtonic, and PPC Land); Google Analytics Help, "Google Analytics 4 has replaced Universal Analytics" (support.google.com/analytics/answer/11583528); Meta for Developers, "Deprecated Facebook Page Insights Metrics" (developers.facebook.com/documentation/pages-api/platforminsights/page/deprecated-metrics), with partner notices from Sprout Social, Supermetrics, and AgencyAnalytics; MarTech Series, spreadsheet preference survey; U.S. Census Bureau, "Large Firms With at Least 20 Employees Biggest AI Users" (census.gov/library/stories/2026/05/ai-use-businesses.html). Prepared for internal review; verify before external publication.
Updated 2026-11-10
Continue learning

The consolidating stack: 3 years of SMB data connection trends

Startup dashboard guide: how Klipfolio tracks every KPI

Metrics layer: One set of definitions for your team

The complete guide to NDR and CAC Payback Period

Cloud Business Intelligence: A Practical Guide to Smarter Reporting
Dashboard design: principles, visualizations, and best practices
Most recent
- OCT 16Klips MCP Server: Use AI to Work with Your Data
- SEP 2310 ways to automate Klips with the Klips API
- SEP 14Automate Klips: from repetitive tasks to managing reporting at scale
- AUG 20The consolidating stack: 3 years of SMB data connection trends
- MAY 28Dashboard Data Security and Privacy: A Five-Layer Framework
- MAR 30The CEO's guide to metrics that actually matter