
What is a metrics layer? Give your team one set of definitions
A metrics layer defines each metric once so everyone gets the same answer. Learn how it works, its benefits, challenges, and best practices for your business.

A metrics layer is a shared set of metric definitions that sits between your raw data and the people who use it, so everyone gets the same answer. If sales, finance, and marketing each calculate revenue differently, the layer settles which number is right.
Here's how a metrics layer works, what it gives you, and where it gets hard.
What is a metrics layer and how does it work?
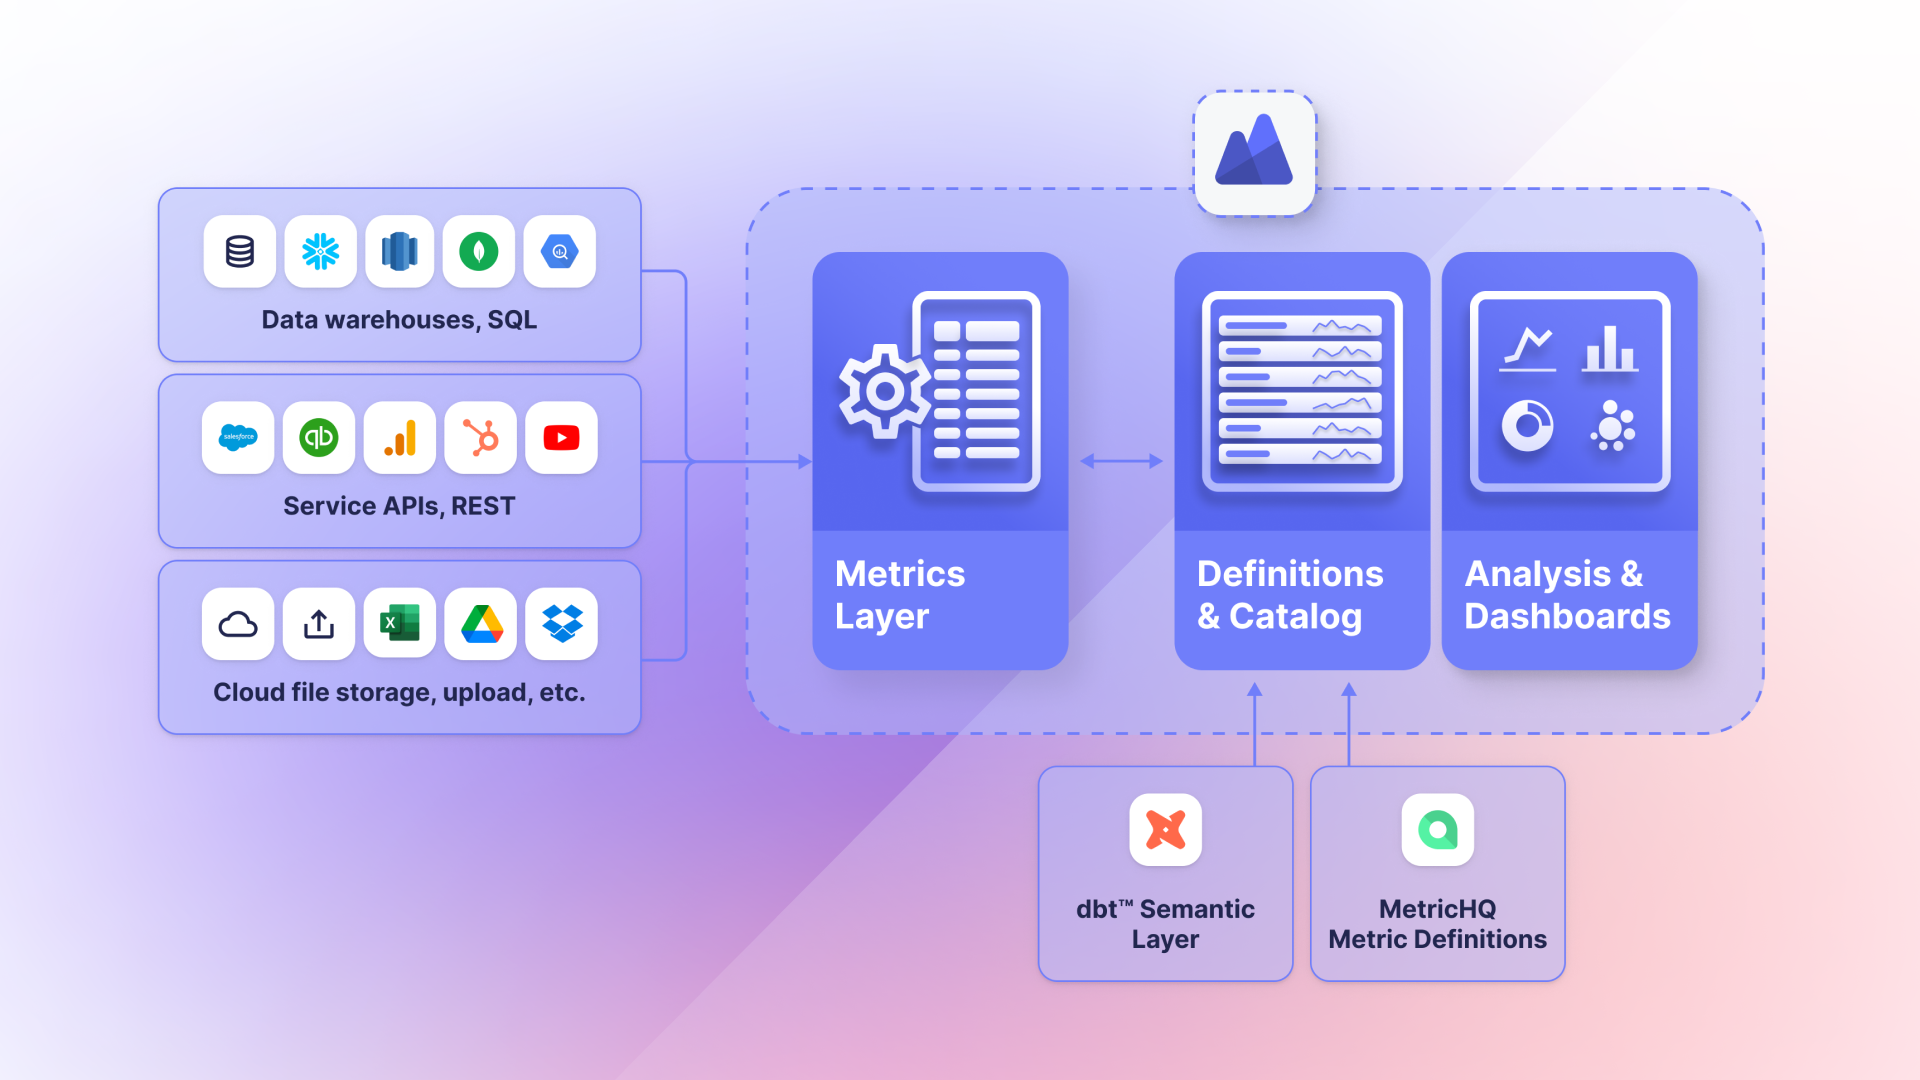
A metrics layer is an abstraction layer that defines each metric once, apart from the tools that produce the data. It turns data from many sources into numbers that are refined, defined, and standardized.
Each of your metrics is defined at a global level and separated from its original source. Data is transformed into a common format, and metric data is stored in the layer in storage built for metrics. The result is a stable, single source of truth for the numbers you run the business on.
When the definitions are shared, your team stops debating whose number is right and starts deciding what to do about it.
Metrics layer vs. semantic layer
The metrics layer and semantic layer both help businesses interpret data, but they do different jobs. The differences show what a metrics layer is for.
Focus
Defining and managing business metrics, calculations, and KPIs is the metrics layer's main job. When you want to track something specific, like sales or customer feedback, the layer measures it the same way every time.
That consistency matters when you compare results over time or across departments. You can trust that this quarter's number is comparable to last quarter's, and to the number another team reports.
A semantic layer is about giving data meaning. It usually sits on top of a data warehouse and presents data in business terms instead of raw numbers or codes.
Consider a company with billions of rows across many tables in one or more data warehouses, each with a different structure. That data isn't business-ready. Semantic layers describe how to pull the relevant portions, typically with a SQL query, for use in reporting tools and other applications. That bridges the gap between raw data and human understanding.
Function
A metrics layer works as a refining step. Before data is used, the layer cleans it, removes errors and inconsistencies, and aggregates and stores only the subset you need.
That matters because decisions built on faulty data can lead to misallocated resources, misguided strategies, or even regulatory penalties. The layer acts as a quality checkpoint, so you act on the most accurate and relevant numbers.
A semantic layer works more like a translator. It makes complex data relatable. It doesn't store data; it stores a query describing what to pull from a data warehouse for a given meaning, typically using an extract, load, transform approach.
That context helps people who aren't data specialists, such as marketing managers and executives, use data in their roles without wading through technical detail.
Integration
The metrics layer focuses on internal consistency. Whether data comes from the sales team or the marketing team, everyone measures things the same way. That helps companies with several departments that need to work from the same numbers.
The semantic layer focuses on interpretation. Many businesses run on several tools, and the semantic layer helps those systems "speak" to each other by standardizing how data is interpreted. That reduces mismatches between systems.
Benefits of a metrics layer
Consistency and accuracy are the headline benefits. Here's what else you can expect when your team works from one set of definitions.
Increase consistency
With a metrics layer, there's no ambiguity. Marketing and finance look at the same numbers and read them the same way.
Consistent definitions across spreadsheets, databases, files, and cloud-based tools reduce errors from misinterpretation. When everyone is on the same page, teams communicate better and decide faster.
Have a single source of truth
A single source of truth (SSOT) means one main source for each piece of information, so everyone has the same, most current version. The metrics layer removes discrepancies that cause conflict between teams.
You also stop cross-checking numbers from several places. That frees you to decide what to do next instead of validating the data.
Promote continuity
As data accumulates, the metric and its definition stay constant, and storage stays controlled. Historical comparisons remain valid.
Over several years, data shifts with market trends, company growth, restructuring, or changes in accounting practices. With a metrics layer, you can track progress with confidence, spot trends, and plan and forecast from a solid base.
Improve transparency
When data is presented clearly and consistently, everyone sees it the same way. If marketing reports higher engagement, finance can see what that means and how it affects their work. That builds cross-team understanding and cooperation.
Parts of a metrics layer
Specifics vary by organization, but a typical metrics layer has three components.
Metric catalog
A metric catalog is a central repository where every metric is defined and stored. When someone needs to know how a metric works, they check the data catalog and find the details.
That cuts time spent hunting for definitions and makes sure everyone uses the current version. A central place also makes metrics easier to update as the business changes.
Semantic layer
The semantic layer adds context and meaning to the calculations and definitions in the metrics layer. Metrics become more than numbers.
Think of it as a detailed product label: it tells you what the product is, how it's made, who made it, and what it's made of. Because it identifies owners and sources, it also promotes accountability, so questions about a number get answered quickly.
Data abstraction
Data abstraction separates metrics from their original source, so interpretation is standardized. It removes discrepancies that come from different sources or interpretations.
You can be confident that your metrics aren't skewed by inconsistencies in the original data. That makes the numbers more reliable for the decisions that depend on them.
Challenges in implementing a metrics layer
A metrics layer has real advantages, but it takes work. These are the issues you might meet.
Complex implementation
Setup requires alignment across business units and data systems. Someone has to gather the data, understand it, and define metrics that fit the business. That takes time and often some expertise.
Connecting the layer to existing systems also takes careful planning and testing, so it doesn't disrupt ongoing work.
Maintenance
A metrics layer needs regular maintenance so the business logic keeps pace with your strategy. That means checking that metric definitions still match company goals and updating them when they don't.
As new data arrives and the business evolves, the layer needs adjustments. Without them, it goes stale and produces inaccurate or irrelevant numbers.
Create custom dashboards for you and your team.
Get started with KlipsResistance to change
People used to their own way of reading data may resist a shared set of definitions. Provide training and support during the transition.
Explain how the layer makes numbers clearer and more accurate, and answer concerns promptly. That earns buy-in and gets everyone on board.
Importance of data governance to a metrics layer
The metrics layer and data governance both protect the accuracy and consistency of your data. The layer provides the repository and rules; governance makes sure the rules are followed and the data is used appropriately.
Integrity
Governance checks the data that goes into the metrics layer. Standards and processes filter out inconsistencies and errors before they reach it, so every analysis and decision rests on a solid base.
When leaders audit a metric, they can trust it's built on clean, validated data. That reduces doubt and builds confidence in the outcome.
Security
Proper data governance goes beyond unauthorized access. It also covers corruption, loss, and duplication, with protocols for backups, recovery, and redundancy checks. Even after a technical glitch, the data stays intact and retrievable.
Clear policies also define user roles and permissions, so only the right people can change or view critical metrics.
Proper use
Data privacy and ethics matter. Governance makes sure the metrics layer follows both internal policies and external regulations.
That protects the organization from legal trouble and builds trust with clients and customers. Standardized use of data also keeps actions and strategies consistent across departments.
Best practices for implementing a metrics layer
These practices keep a metrics layer useful once it's in place.
Set clear objectives
Start with where you want to go. Whether you want to consolidate data sources, improve consistency, or make numbers easier to reach, a defined goal steers the whole effort.
Prioritize data quality
The layer is only as good as the underlying data and the business logic defined within it. Remove inconsistencies, correct errors, and fill in missing values.
Standardize formats, cross-reference reliable sources, and use validation rules. Add data to the layer only once it's clean.
Define your metrics thoroughly
Don't just name a metric; describe it. State what it measures, how it's calculated, and what it's for. That prevents confusion later.
For example, Customer Retention Rate measures the percentage of customers who continue to use your service over a period. Specify the formula: customers at the end of the period, minus new customers acquired during it, divided by customers at the start, multiplied by 100. Note that its purpose is to gauge customer loyalty and satisfaction.
Integrate with current systems
Your metrics layer should work with your existing data infrastructure, meaning the tools you already use. That might involve APIs, connectors, or custom scripts. A smooth connection keeps data flowing consistently.
Invest in user education
Train the people who will read the metrics. Give them the knowledge to find and interpret the numbers, and your team will make better decisions from them.
Keep training ongoing and matched to experience, from a beginner's course on the basics to deeper classes for those who need them. The goal is for people to value the numbers, not just know where to find them.
Commit to regular reviews
Review your metrics layer on a schedule, such as in your monthly or quarterly business review. If a metric stops mattering or a new one emerges, the layer should adapt.
Regular reviews help you spot issues early. You might recalibrate a metric to match your goals or change how data is collected to improve accuracy.
Metrics layer in different industries
Every industry has its own data needs, and a metrics layer adapts to them. Here are four examples.
Healthcare
A metrics layer can unify data from hospitals, providers, labs, pharmacies, and billing. That supports patient care, research, and administration. Tracking recovery metrics across treatments, for example, shows which methods work best.
On the administrative side, metrics like average patient wait time or the number of rescheduled appointments point to where processes need work.
Finance
The finance sector handles vast amounts of data, from stock prices to individual transactions. A metrics layer gives analysts and decision-makers consistent metrics, whether they're studying market trends or assessing credit risk.
A bank might unify credit score calculations across branches or regions to support fair lending decisions. Loan default rates and investment returns can then inform strategy and risk management.
E-commerce
E-commerce platforms handle product listings, customer behaviour, sales, and reviews. A metrics layer standardizes metrics for sales performance, customer engagement, inventory, and product popularity.
An online store might track a product category over time or study seasonal sales. That informs stock levels, pricing, and promotions.
Metrics like conversion rates, average order value, and cart abandonment rates show where to improve the shopping experience.
Real estate
Real estate depends on data for valuations, market trends, and investment opportunities. A metrics layer can unify property listings, historical sales, rental yields, and local market trends.
An agency might track average time on market or the gap between listing and selling prices by neighbourhood. That shows which areas are becoming more desirable and which property types are in demand.
Property maintenance costs, tenant turnover, and rental income consistency help property managers and investors build stronger portfolios.
Metrics layer: from raw data to decisions
A metrics layer gives any organization that runs on data one set of definitions to work from. It consolidates and organizes complex data so it's easier to interpret.
It isn't a one-off project. It needs ongoing attention, and the best practices above keep it accurate, accessible, and tied to the decisions you make. If your teams still debate whose number is right, start by agreeing on the definitions of your five most important metrics.
Create custom dashboards for you and your team.
Get started with KlipsFAQs
Updated 2026-10-15
Continue learning

Metrics layer vs semantic layer: Which fits your business?

KPI vs metrics vs measures: What's the difference?

Dashboard Data Security and Privacy: A Five-Layer Framework
What Is a Dashboard? Types, benefits, and how to build one

What is a KPI? Types, limitations, and how to make KPIs work for your business

AI data visualization: Why chart choice still matters
Most recent
- SEP 2310 ways to automate Klips with the Klips API
- SEP 14Automate Klips: from repetitive tasks to managing reporting at scale
- AUG 20The consolidating stack: 3 years of SMB data connection trends
- MAY 28Dashboard Data Security and Privacy: A Five-Layer Framework
- MAR 30The CEO's guide to metrics that actually matter
- MAR 18What is a KPI? Types, limitations, and how to make KPIs work for your business