
Measures, metrics, and KPIs: What's the difference?
Learn the difference between measures, metrics, and KPIs with clear definitions, practical examples, and a four-step workflow so your team tracks goals with confidence.

A measure is a raw data field, a metric is a calculation built from measures, and a KPI is a metric with a target and a deadline.
Why clarity matters as your business grows
You hear KPI, metric, and measure used as if they mean the same thing. They don't. As your business scales, clean definitions reduce debate, speed up decisions, and keep your dashboards honest. Think of them as a stack of increasing strategic value:
- Measures: The raw ingredients (data fields)
- Metrics: The recipes (calculations)
- KPIs and goals: The scoreboards (strategic targets)
Getting this hierarchy right moves you from reporting "what happened" to diagnosing "why it happened" and deciding "what to do next."
1. Measures: The raw data field
A measure is the most basic numeric value or raw data field in your source systems, such as your CRM, e-commerce platform, or data warehouse.
A measure is a column of numbers before any calculation, averaging, or counting is applied. Measures have no inherent context, goal, or time limit. They are the atomic data points everything else is built on.
Key characteristics
Measures are the foundation of your reporting. They are raw numeric units such as dollars, counts, minutes, or leads.
Examples of measures (the raw input field)
- The dollar amount of every sale transaction.
- The duration (in seconds) of every website session.
- The count of every support ticket created.
How measures become metrics
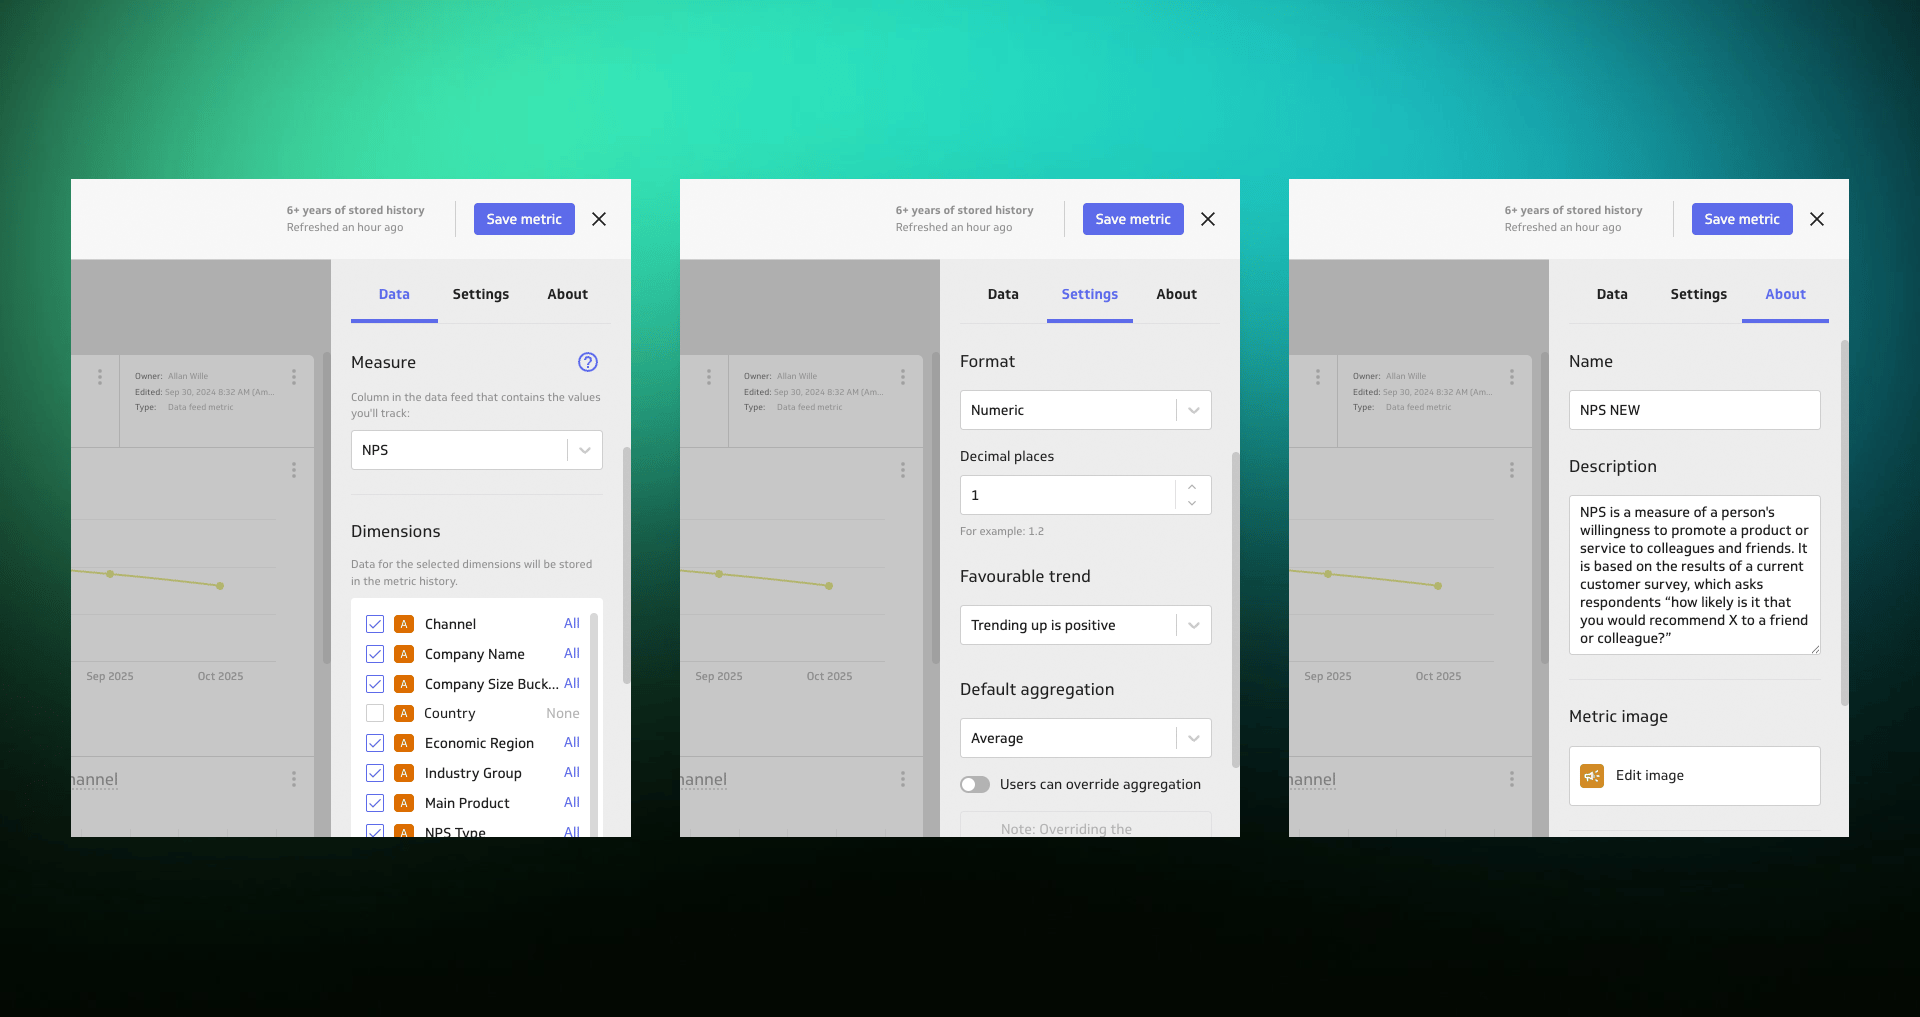
When you connect a data source, the field you select, such as "Sales Amount" or "Customer ID," is your measure. The history of those raw values is stored, then aggregated (SUM, COUNT, AVERAGE, MIN/MAX) when you create a metric.
2. Metrics: Performance with context
A metric combines one or more measures and applies a definition, aggregation, and date granularity to track and assess performance.
A metric is the result of a calculation, or expression, that gives raw data the context needed to answer a business question. Standardizing the math, whether it's a rate, ratio, or average, keeps performance tracking consistent across the organization.
Key characteristics
Metrics turn raw measures into trusted, consistent, business-defined building blocks:
- Contextual: They express how well a specific process or funnel step is working.
- Standardized: They use a single, agreed formula the same way every time, preventing "version drift" in reporting.
| Measures (raw inputs) | Metric (performance calculation) |
|---|---|
| Sales Amount | Total Sales: Sum(Sales Amount) |
| Revenue, Orders | Average Order Value (AOV): Sum(Revenue) / Count(Orders) |
| Marketing Spend, New Customers | Customer Acquisition Cost (CAC): Sum(Spend) / Count(New Customers) |
Metrics are your first stop when diagnosing a change. If sales dip, check Average Order Value or Conversion Rate to pinpoint where in the process to focus.
Putting metrics to work
To create a metric, pick your measures, apply the aggregation and formula, and define the date granularity: daily, weekly, or monthly. Then use dimensions such as channel or product to slice the metric and see where a result comes from.
3. KPIs and goals: Strategic targets and direction
A Key Performance Indicator (KPI) is a strategic metric tightly linked to a top business objective. The "Key" is crucial: KPIs are the handful of metrics leadership uses to judge whether the business is winning.
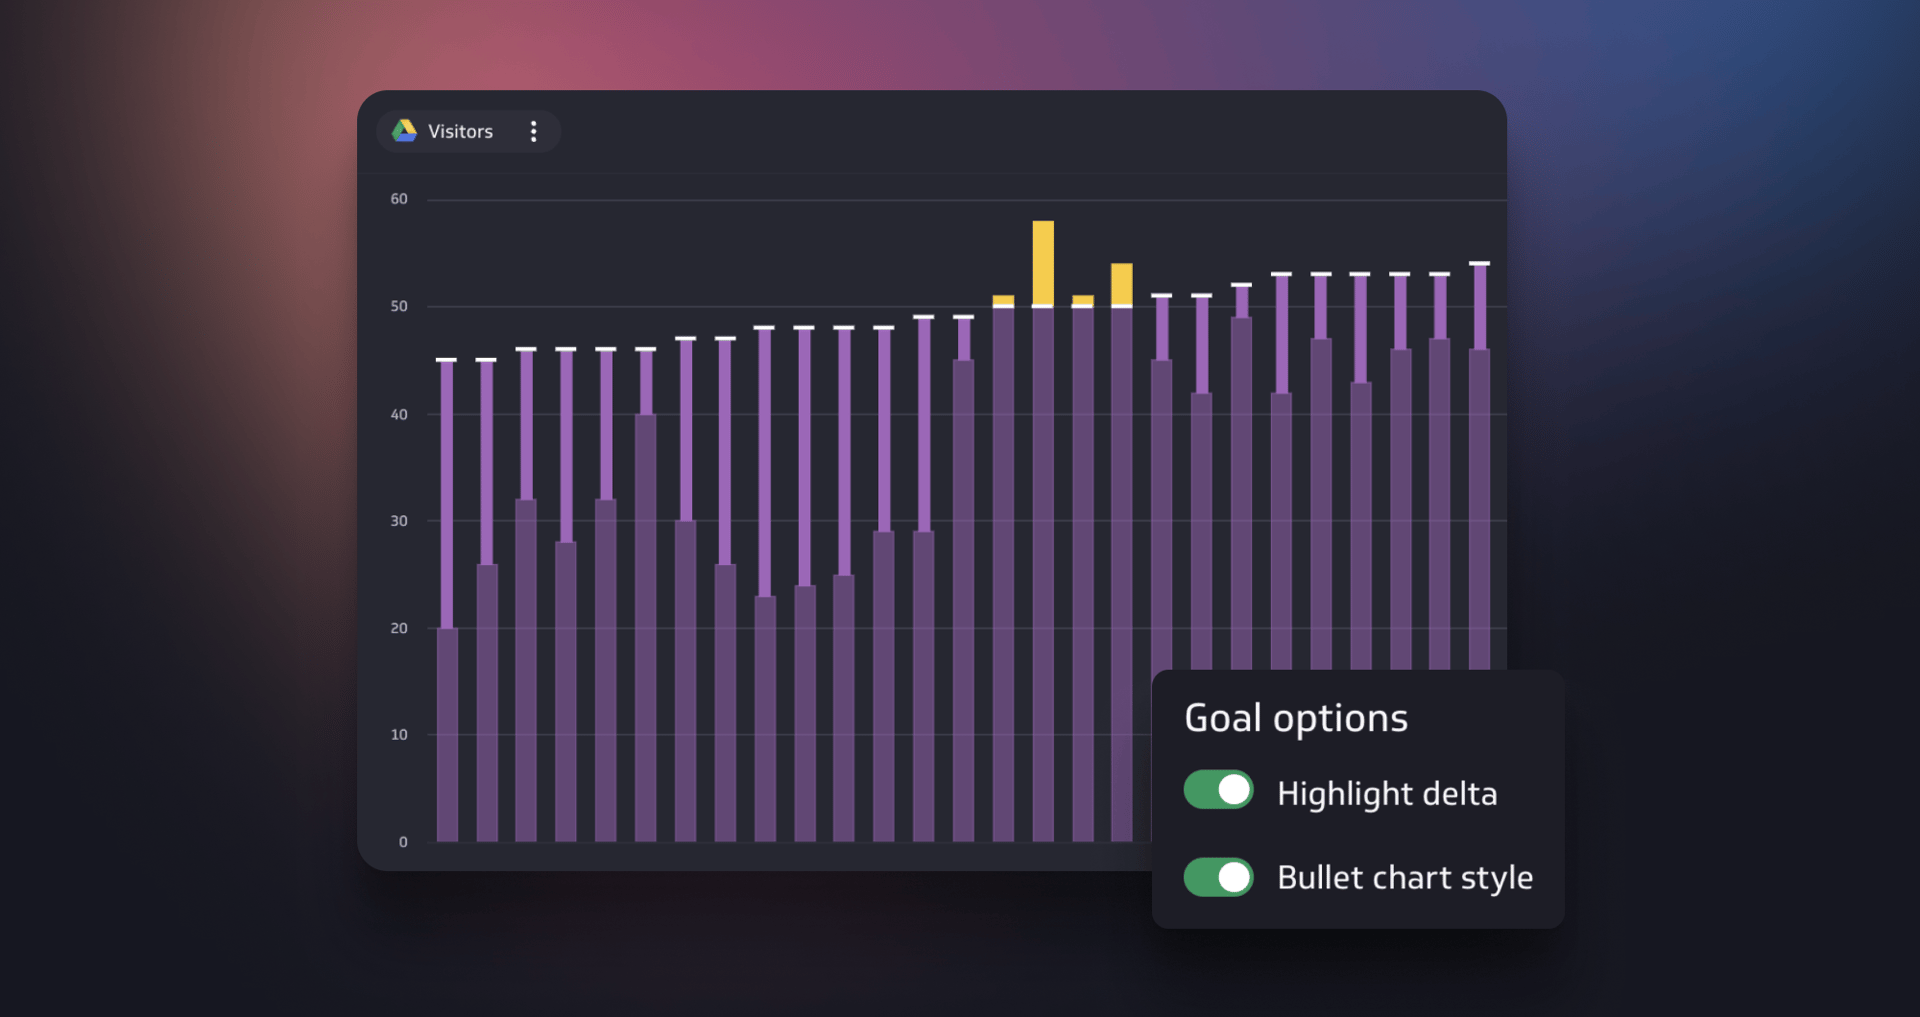
A KPI is a metric that has been given a goal line and a deadline.
Create custom dashboards for you and your team.
Get started with KlipsThe role of goals
A goal is the business intent that gives purpose and direction to a metric.
- KPI (the intent): The high-level objective, for example, "Improve profitability."
- Goal (the mechanism): The specific target value and time frame applied to the metric.
Metric vs. KPI in one glance
| Concept | What it is | Example |
|---|---|---|
| Measure | Raw values. | Orders, Sales Amount, Visitors |
| Metric | Performance calculation. | Conversion Rate: Count(Wins) / Count(Visitors) |
| KPI (metric + goal) | Strategic target with a deadline. | Achieve a 4% e-commerce Conversion Rate in Q4. |
Putting it together: The bike store example
Picture a small custom bike store whose owner is focused on sustainable growth.
| Component | Strategic purpose | Metric / measure |
|---|---|---|
| KPI (the goal) | Increase recurring "bike tune-up" revenue and scale efficiency. | Hit $5,000 in Monthly Recurring Revenue from bike tune-ups by end of Q2. |
| Core metrics | The levers to pull to move the KPI. | Customer Retention Rate, Average Revenue per Customer, Customer Acquisition Cost. |
| Measures (inputs) | The raw data feeds required for the calculations. | Ad Spend, New Customers, Existing Customers, Revenue. |
This setup works because every team member knows that improving Retention and lowering CAC directly influences the Monthly Recurring Revenue goal, the store's ultimate KPI.
Why consistent metric definitions matter
Inconsistent definitions are one of the most common reasons teams lose trust in their data. When two people calculate "Monthly Revenue" differently, every meeting becomes a debate about numbers instead of a discussion about decisions.
Define each metric once, with an agreed formula, a clear description, and a named owner. Everyone then pulls from the same source, uses the same logic, and sees the same answer.
A shared metric catalog earns its value here. Rather than rebuilding the same calculation in five dashboards or five spreadsheets, you define it once and reuse it everywhere. When the definition changes, you update it in one place, and every dashboard and report reflects the change.
Whatever tool you use, each metric should carry its definition, formula, and owner, so your team always knows what a number means, where it comes from, and whether to trust it.
Putting the framework to work
1. Connect sources and identify measures
Connect the platforms you already use, such as Shopify, Stripe, Google Ads, and spreadsheets, and select the base numeric fields you care about. These are your measures, the atomic units for building meaningful metrics.
2. Define and agree on metrics
Set the aggregation type, the format (currency, number, percentage), and the formula where applicable, for example, Revenue / Orders. One agreed definition ends debate about the math and builds trust in the numbers across your organization.
3. Set goals to create KPIs
Turn your strategic metrics, such as MRR or Retention Rate, into formal KPIs by setting a goal: a specific numeric target and a deadline, such as $5,000 by June 30. Add comparisons to prior periods so leadership sees at a glance whether the business is on track or slipping.
4. Share and act
Build a dashboard that tells a clear story about your KPIs. Review it weekly to spot changes early and act before targets slip.
Quick reference: Definitions you can share with your team
Here are the three core terms, ready to copy into a team doc or shared dashboard.
- Measure: A raw numeric field from a source system, for example, "Sales Dollars."
- Metric: A calculation that describes performance using one or more measures, for example, "Average Order Value."
- KPI: A strategic metric with a specific target and time frame, for example, "Reach $5,000 MRR by June 30."
Create custom dashboards for you and your team.
Get started with KlipsWhere to start today
Getting your metrics framework in place doesn't require a big project. Start with these five steps:
- Pick one business objective for the next quarter.
- List the two or three metrics that move it most.
- Identify the measures required for those metrics.
- Build the metrics and add a goal.
- Share the dashboard and schedule a weekly review.
Start with one objective and one agreed definition for each number. Once your team trusts those numbers, meetings shift from debating the data to deciding what to do next.
Updated 2026-10-14
Continue learning

Metrics layer: One set of definitions for your team

What is a KPI? Types, limitations, and how to make KPIs work for your business

What are business metrics? Definition and examples

The complete guide to NDR and CAC Payback Period

The CEO's guide to metrics that actually matter

Metrics layer vs semantic layer: Which fits your business?
Most recent
- SEP 2310 ways to automate Klips with the Klips API
- SEP 14Automate Klips: from repetitive tasks to managing reporting at scale
- AUG 20The consolidating stack: 3 years of SMB data connection trends
- MAY 28Dashboard Data Security and Privacy: A Five-Layer Framework
- MAR 30The CEO's guide to metrics that actually matter
- MAR 18What is a KPI? Types, limitations, and how to make KPIs work for your business