
Metrics layer vs semantic layer: Which approach fits your business?
Compare a metrics layer vs semantic layer vs hybrid approach. See how each affects who builds your numbers, how fast leaders get answers, and what it costs.

A semantic layer defines metrics on data you already store, a metrics layer stores the metric data itself, and a hybrid approach combines both.
Each option changes who builds your numbers, how fast leaders get answers, and how much you spend to keep them consistent. This article compares the three so you can choose the path that fits your data and your team. Along the way it covers metrics, the semantic layer, the metrics layer, and the hybrid approach.
The semantic layer approach
A semantic layer lets data teams define metrics once, on top of the data warehouse, so decision-makers get the same definition every time. It is gaining attention as the next step in data transformation toolkits, particularly with advances in GenAI integration and composable analytics. The data team defines and manages the metrics, and the business team consumes them. Examples include dbt Semantic Layer from dbt Labs, Cube, AtScale, and Looker Modelling from Google.
A semantic layer does not store data. It assigns meaning (metric definitions) and structure (semantics) to data through added metadata. Metric definitions give everyone a consistent, easily understood view of the data. They also give analysis tools a simple, consistent way to query metrics.
Semantic layers define metrics on top of the existing data in the data warehouse. Metric queries are translated into raw SQL to retrieve and process the data that is returned to a data analysis tool.
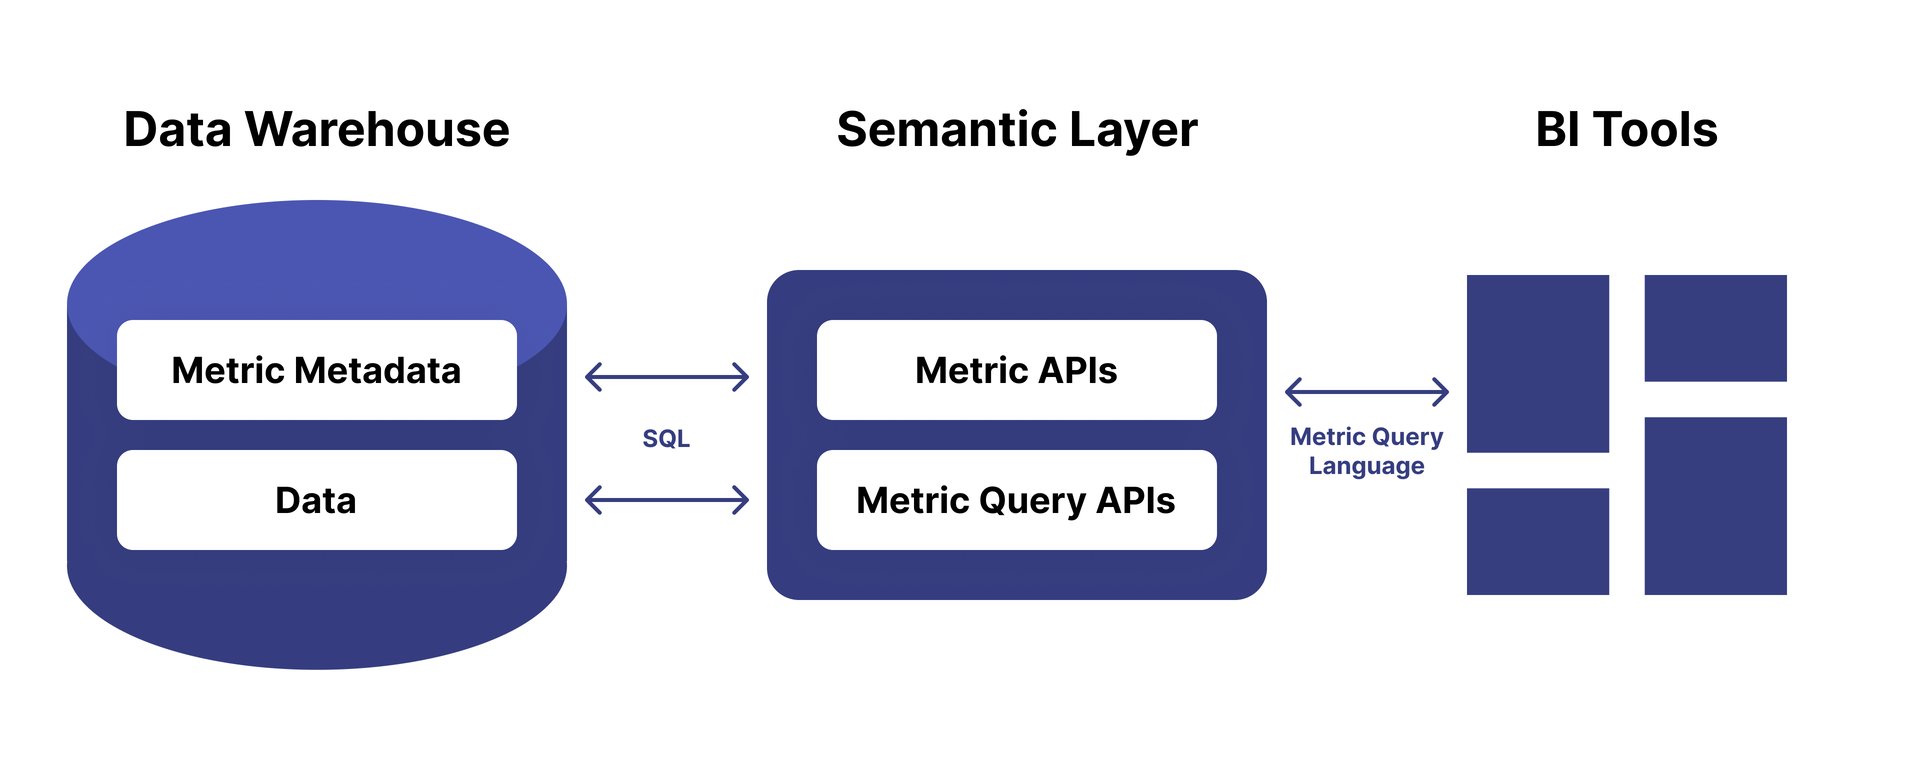
When someone queries a metric, the layer turns the query into raw SQL using the rules the data team wrote in the metric definition. The data can be read as a metric even though it isn't structured that way in storage.
A semantic layer doesn't require you to restructure raw data or move it to other storage. Data teams keep managing data the way they're used to. For example, an existing investment in dbt to model, transform, or clean warehouse data carries straight into the dbt Semantic Layer.
The metrics layer approach
A metrics layer stores both the definition and the data for each metric, so leaders can get answers without depending on a warehouse. Metrics layers expose metric artefacts that are used much like those from semantic layers. The difference is that a semantic layer metric holds rules for querying raw data, while a metrics layer artefact holds data and meaning together.
When you create a metric, you define transformation rules so source data can be ingested in the right structure. Those rules run at regular intervals to capture new data. Every metric stores its data the same way, regardless of where it came from or how it was originally structured.
Metrics layers store everything relevant to a metric, including its definition and its data. Transformation and ingestion rules convert raw data into a format that's more efficient for querying and storing metric data.
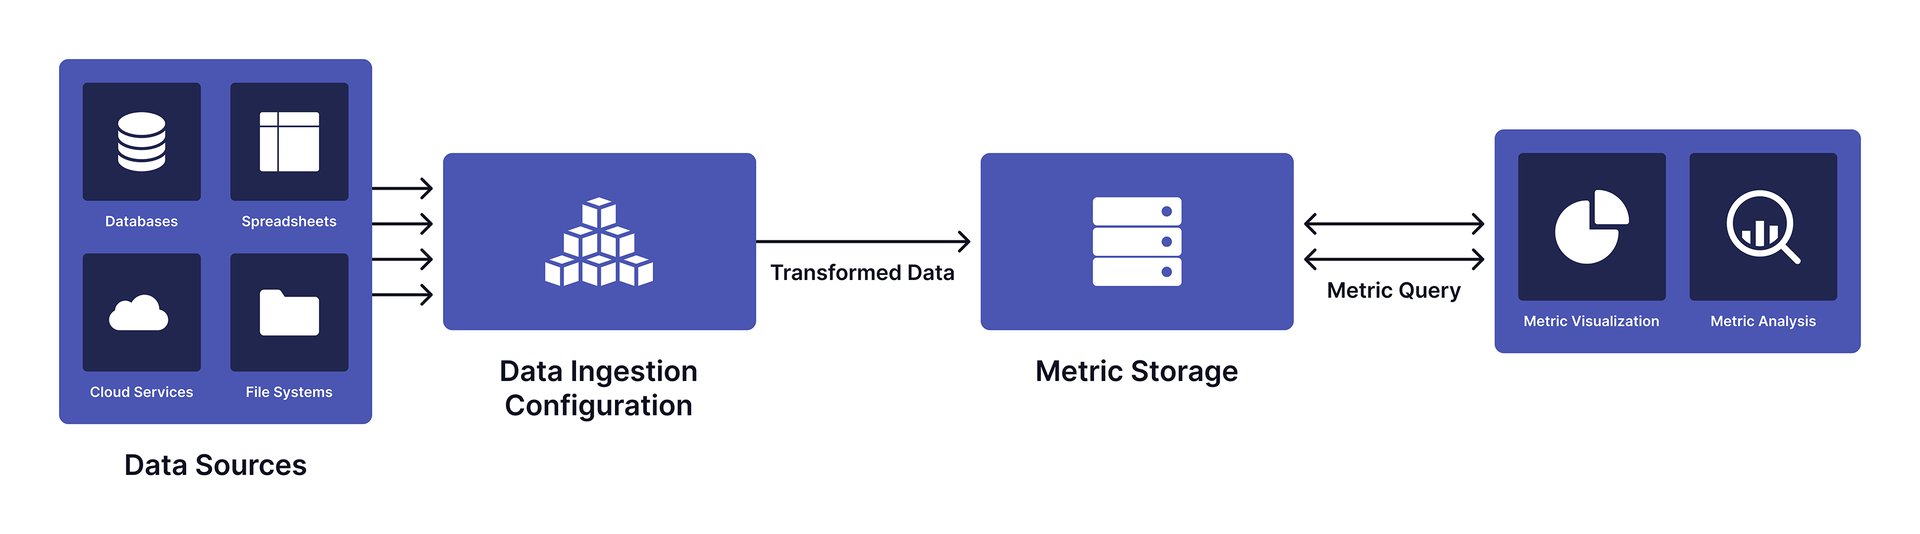
Dashboard tools with a built-in metrics layer make metrics faster to set up and easier to share. They also keep a metric's history even when the source system doesn't, which supports deeper time-series analysis across every metric. Self-serve analysis and visualization tools work directly with the stored metric data. Because definition and storage live in one place, the data stack is simpler and less expensive to maintain.
The hybrid approach
A hybrid approach lets you combine metrics from a semantic layer and a metrics layer in one place. This works because both types of metrics are consumed in similar ways. You can combine metrics from either system to create new ones, often with a formula. For example, a "Profit" metric can be "Revenue metric minus Expenses metric." This property is called composability, and the resulting metrics are often called calculated metrics.
You can also show metrics from both types of layers in the same visualization or report by combining the data through a common data context, similar to a data join.
Hybrid tools often include metric management features such as permissions and metric certification. They provide a common catalog of metrics in one place, so every team finds and uses the same numbers.
Hybrid approaches support a wide range of data sources and the optimized storage of a metrics layer. They also give access to metrics that data teams define and manage in a semantic layer.
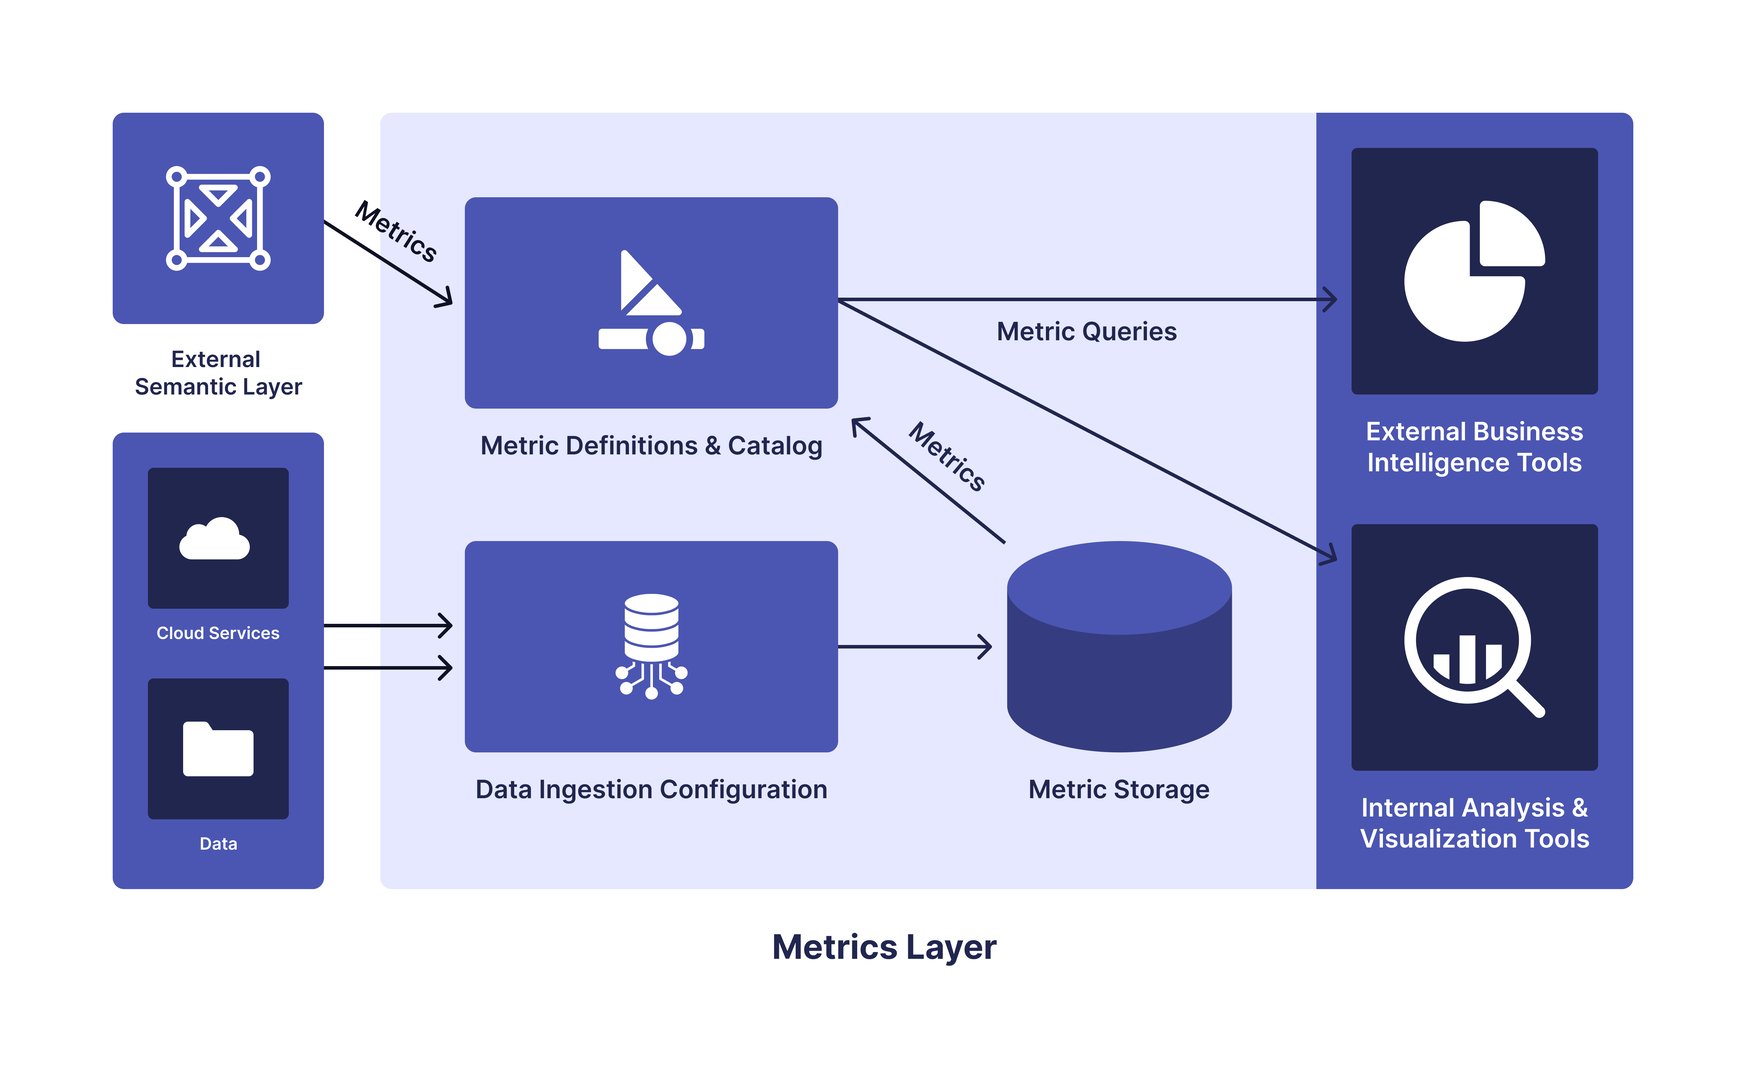
Some hybrid tools build metrics from many data sources and APIs while also processing external metrics from dbt. Both kinds of metrics sit in one central location and feed dashboards, visualizations, and analyses across the organization.
Which approach is right for my business?
Because semantic layers and metrics layers produce metrics with similar capabilities, the right choice depends on how your team manages data and metrics. Five questions will help you decide whether to use a semantic layer, a metrics layer, or both.
Where is my data stored?
If your company has consolidated data in a warehouse, a semantic layer fits best. Mature, data-driven organizations often have already refined their collection and consolidated their data. They've also invested in proper data governance around a small set of storage systems, usually traditional databases accessed with SQL. A semantic layer sits over that storage and needs no major data migration or new governance rules.
Growing companies often don't have that setup. They rely on out-of-the-box services to store most of their data, or on spreadsheets and other files. Built-in storage and the ability to pull from a broad set of APIs and data sources make a metrics layer more appealing here.
Being able to connect to a large set of services and APIs is a benefit of tools with a built-in metrics layer.
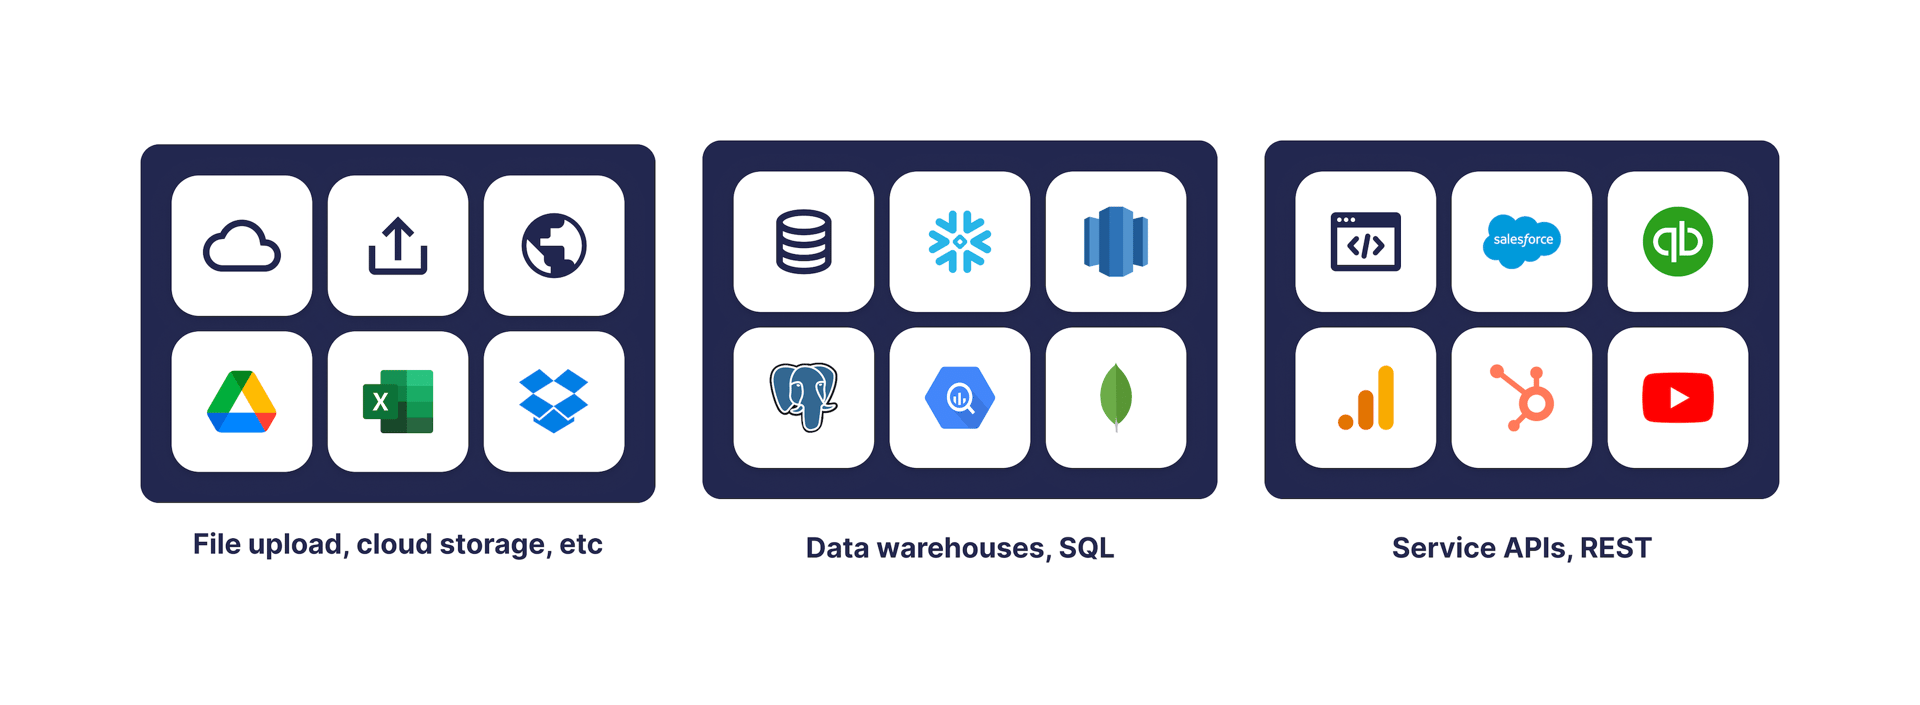
Many large organizations centralize core business data but keep department-specific data elsewhere. A hybrid approach is often best for them because both kinds of data become usable metrics.
How much data do I have, and how is it distributed?
If you have very large volumes of data, a data warehouse with a semantic layer is the strongest choice. Warehouses are designed to store data in quantity and, when data is properly structured and queried, to make all of it efficiently accessible.
Some organizations don't manage large quantities of data themselves. If the data is already refined and available through APIs, a metrics layer is probably easier to set up and manage.
Where large central storage and departmental data tools coexist, a hybrid approach gives you the flexibility to use everything available.
Does my organization have an experienced data team?
If you don't have a dedicated data team, a metrics layer is usually the better fit. Metrics must be correctly defined and efficient to query, and the expertise needed to ensure that depends on the system.
In a semantic layer, the metric's definition and performance depend on the underlying storage and the transformation rules in the metric. Data is retrieved with SQL queries, and performance can vary greatly. A data team with the technical expertise to tune metric definitions is needed.
Metrics layers already have optimized storage and query layers. They're built for metrics, not generalized data storage, so less technical expertise is needed to define effective metrics.
Many large companies need to combine centralized data systems with departmental data. A hybrid solution still requires data experience, but it consolidates everything in one place so users can consume it all as metrics.
How will metrics be provided to business teams?
The capabilities of a metric artefact are virtually identical whether it comes from a semantic layer, a metrics layer, or a hybrid. What differs is how you manage metrics and give business teams access to them.
Semantic layers require a dedicated data team to build and manage metrics. That helps governance and access control, but it slows things down when leaders need a new number, since only the data team can build it.
With metrics layers, data consumers can self-serve. They can combine existing metrics, import metric definitions from well-known data services, or create metrics from their own data. Leaders get answers when they need them. The risk is metric bloat: too many metrics, and no clear sense of which one to trust.
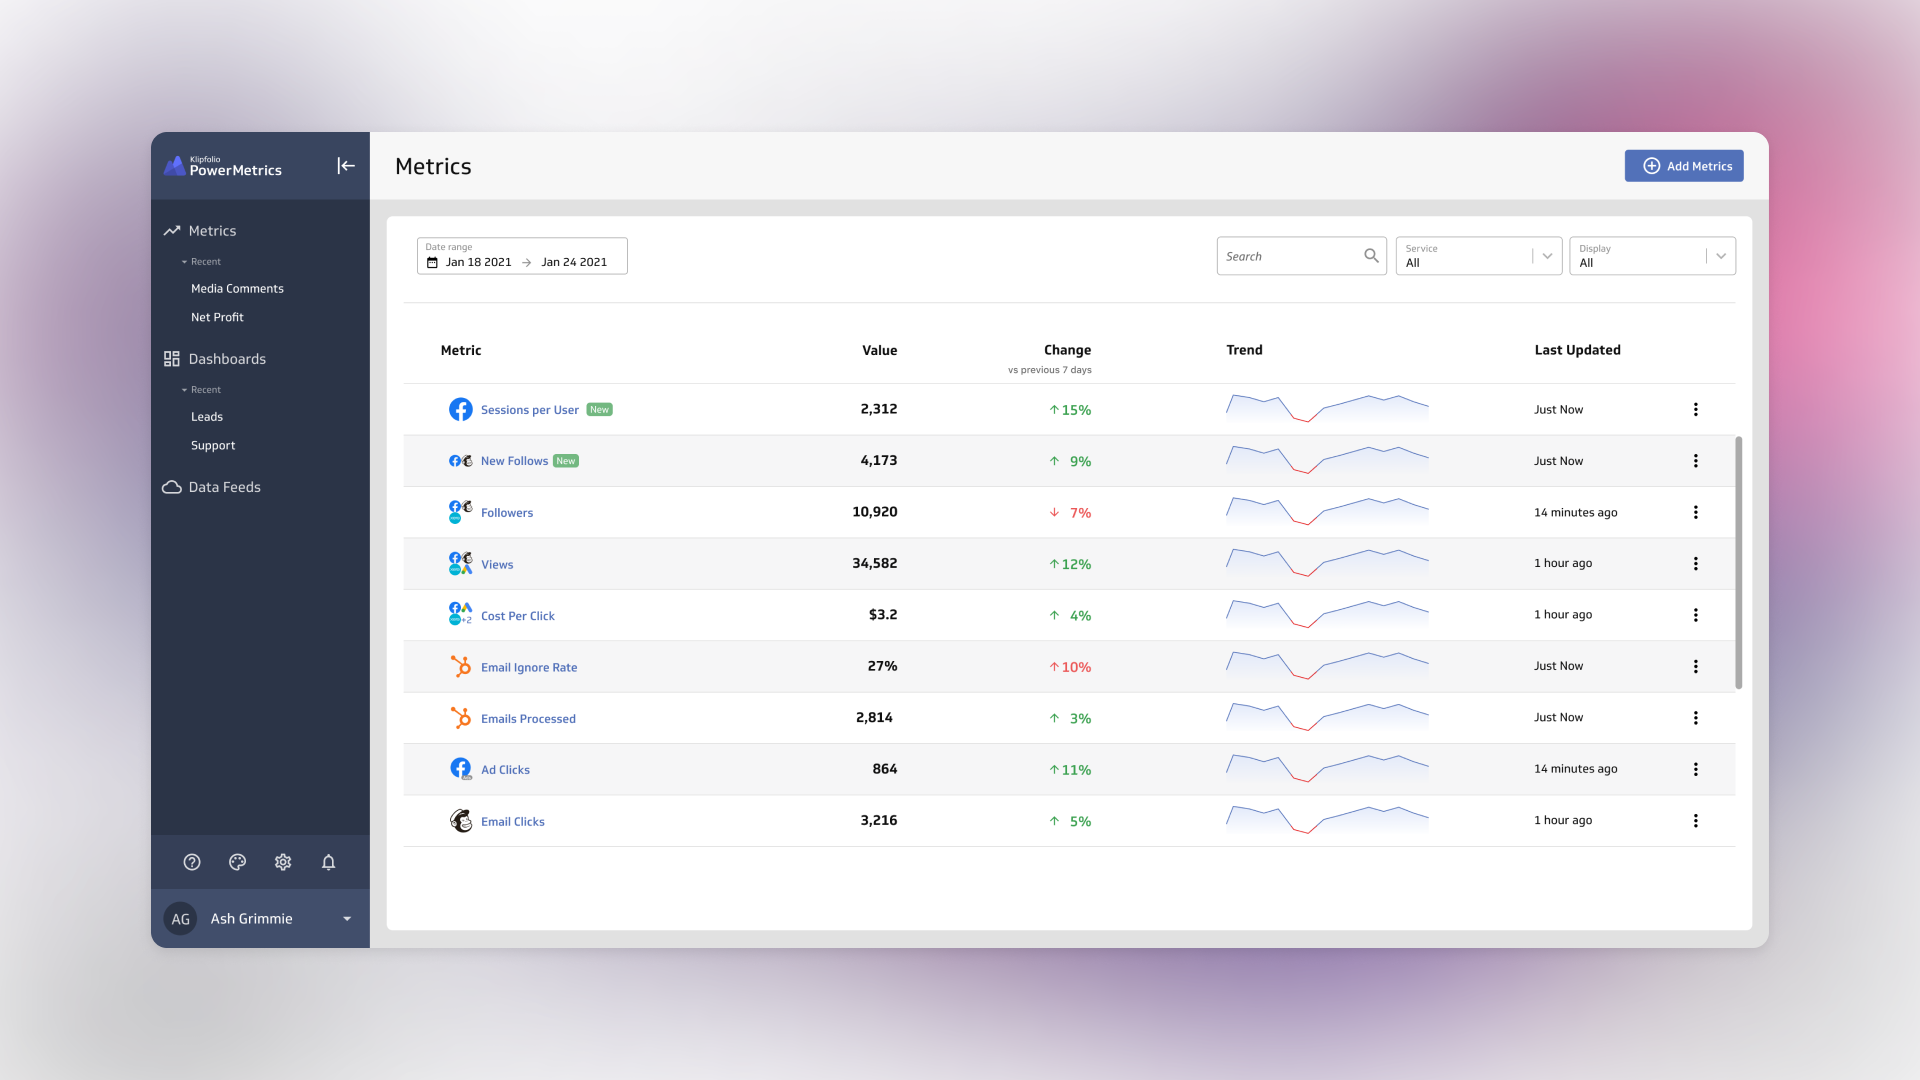
Hybrid approaches give everyone one place to see and manage metrics, whatever their source. This single point of access is often called a metric catalog. It lets data teams control which metrics are exposed and mark verified ones for official use. With a catalog, leaders can get the metrics they need to make informed business decisions without asking the data team for help.
A metric catalog gives data users access to metrics built by the data team. Built-in dashboarding features let them work with and share data directly.
How much do I want to invest?
A semantic layer costs more to put to work because it is part of a larger modern data stack. It usually provides only metric definitions and APIs to reach the data. You then need downstream analytics or lightweight dashboard tools, such as Mode or Lightdash, so people can view and process the metrics.
Tools with a metrics layer are complete: they include metric definition, management, visualization, and analysis. These in-a-box options are usually less expensive and often sold as SaaS, which lowers the upfront commitment.
Hybrid solutions are built on metrics layers, so they include lightweight analysis and visualization tools. You don't need extra investment to consume semantic layer metrics. APIs may also be available for the metric catalog or the data produced by the built-in analysis tools.
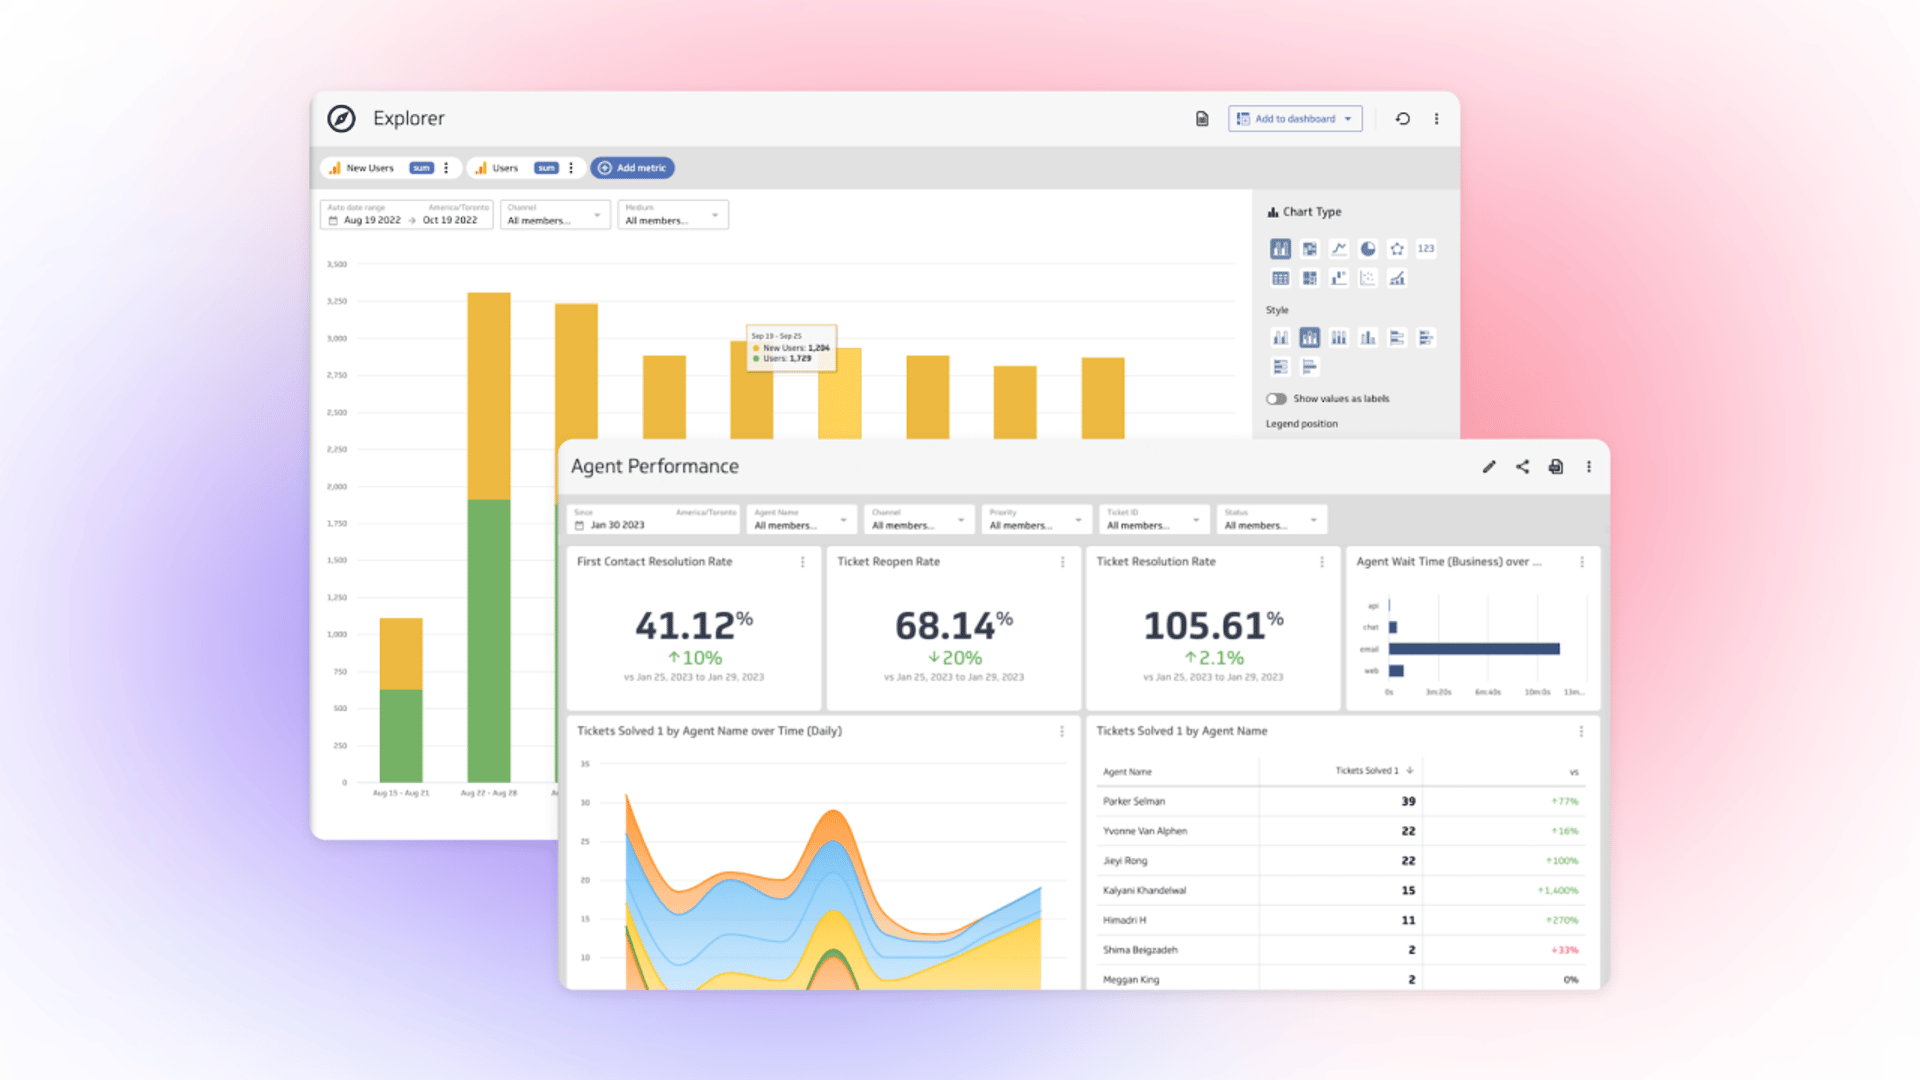
A visualization and analytics layer built for metrics makes them easier to consume.
Your data, your choice
The right choice gives your leaders trusted numbers to decide with, and it has to fit your infrastructure and your needs. Any of the approaches in this article can manage, process, and analyze your data.
Technology decisions should support your company's future direction and growth. Of the three, the hybrid approach is the most future-proof. It allows a broader set of data sources while keeping a true semantic layer for data volume and governance, which matter more as your team grows. It also lets you start with either a semantic layer or a metrics layer and expand from there.
Updated 2026-10-15
Continue learning

Metrics layer: One set of definitions for your team

Dashboard Data Security and Privacy: A Five-Layer Framework

The consolidating stack: 3 years of SMB data connection trends

AI data visualization: Why chart choice still matters

Cloud Business Intelligence: A Practical Guide to Smarter Reporting

KPI vs metrics vs measures: What's the difference?
Most recent
- OCT 16Klips MCP Server: Use AI to Work with Your Data
- SEP 2310 ways to automate Klips with the Klips API
- SEP 14Automate Klips: from repetitive tasks to managing reporting at scale
- AUG 20The consolidating stack: 3 years of SMB data connection trends
- MAY 28Dashboard Data Security and Privacy: A Five-Layer Framework
- MAR 30The CEO's guide to metrics that actually matter