Hotel Dashboard
Track occupancy, ADR, and RevPAR to grow revenue and guest loyalty.
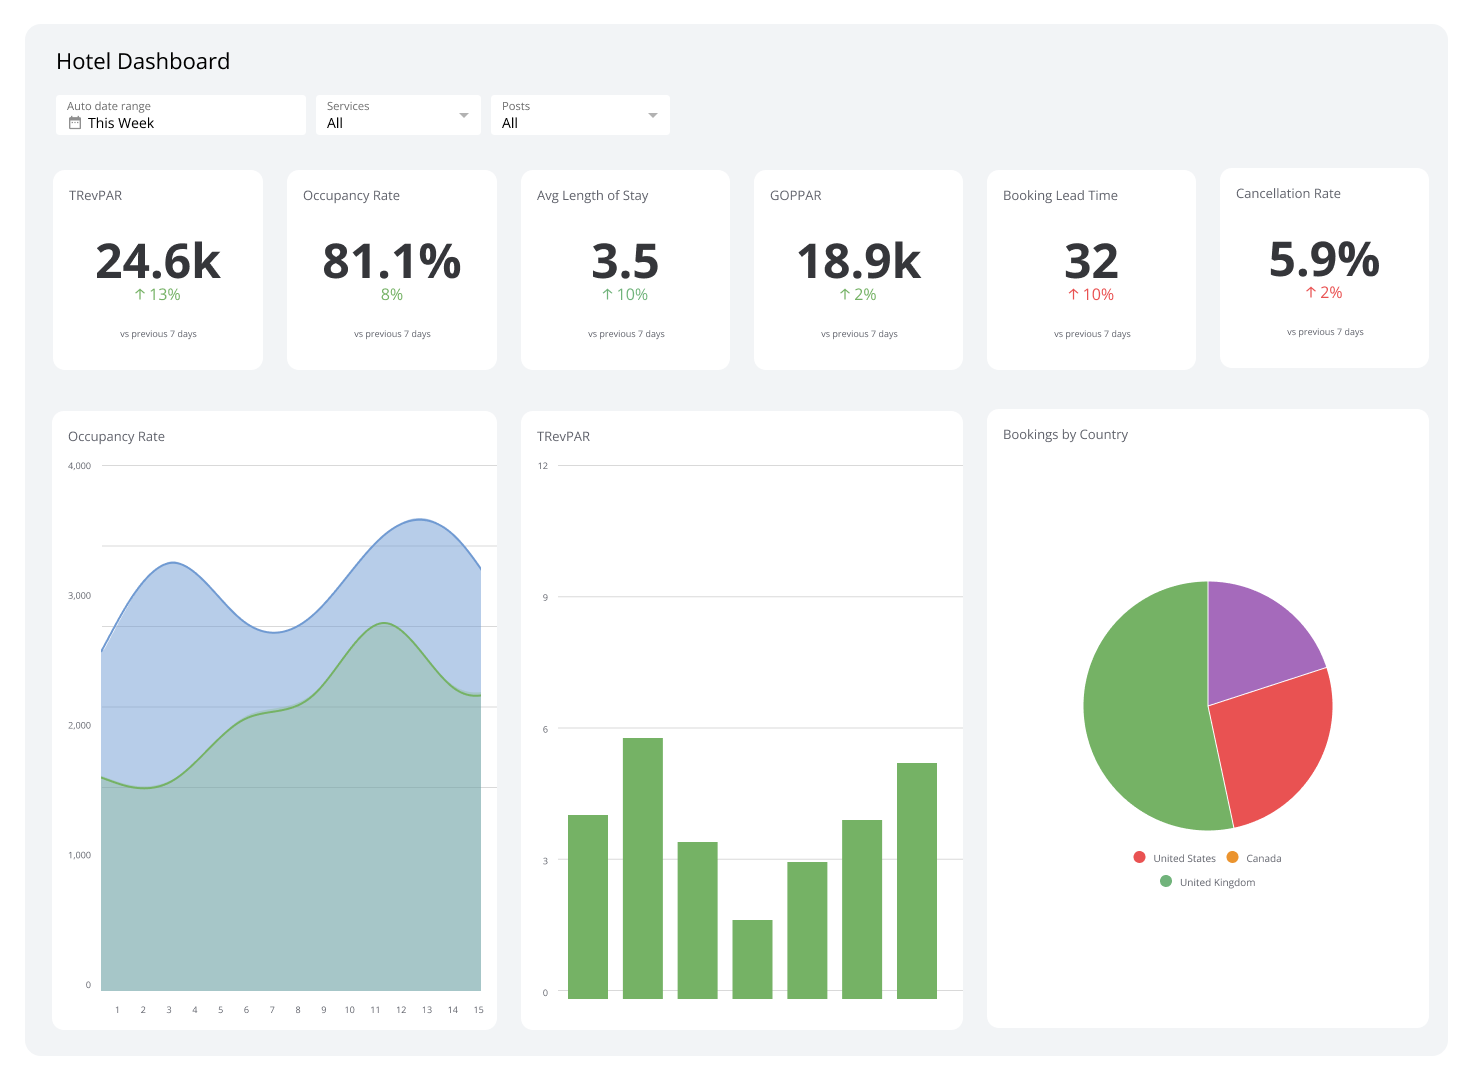
What is a Hotel Dashboard?
A hotel dashboard is a single view that pulls occupancy, revenue, and guest data from your property management system, booking engines, and review platforms into one reliable picture.
Most hotel managers are making decisions with numbers scattered across systems, spreadsheets, and end-of-day reports. A hotel dashboard replaces that with one current, consistent view of how your property is performing, without having to ask someone to pull a number or paste figures together yourself.
With the right metrics in front of you, you can spot booking trends before they become problems, catch service gaps before guests post reviews, and adjust pricing with confidence instead of guesswork.
Examples of Hotel Dashboards
Hotel Performance Dashboard
A Hotel Performance Dashboard gives you a complete picture of financial and operational health in one place. Occupancy, average room rates, total revenue, and guest satisfaction scores all appear together, so you can assess whether you're hitting targets without waiting for a weekly report or asking your team to compile one.
The real value is in what you can act on. A dip in satisfaction scores alongside a revenue uptick might signal that a rate increase is hurting the guest experience. Seeing both signals at once means you can respond before the damage shows up in reviews.
| Who's it for | Hotel general managers, revenue managers, operations managers, marketing directors, finance teams, property owners, corporate executives, asset managers, front desk managers, housekeeping managers |
|---|---|
| How often it's needed | Real-time, daily, weekly, monthly, quarterly, annually |
| Covered KPIs | Occupancy Rate, RevPAR, ADR, TRevPAR, GOPPAR, Length of Stay, Booking Lead Time, Channel Mix, Cancellation Rate, Guest Satisfaction Score, Review Ratings, Repeat Guest Percentage, Cost per Occupied Room, Labour Cost Percentage, Energy Consumption per Occupied Room, Market Share, Competitive Set Performance, Forecast Accuracy, Upsell Conversion Rate, Ancillary Revenue per Guest, On-Time Check-In/Check-Out Percentage, Room Turnover Time, Food and Beverage Revenue per Guest |
Create custom dashboards for you and your team.
Get started with KlipsHotel Revenue Dashboard
A Hotel Revenue Dashboard shows everything that contributes to total income: room revenue, food and beverage, ancillary services, and how each is trending. ADR, RevPAR, and revenue by channel sit side by side, so you can see not just how much you're making, but where it's coming from and whether the mix is healthy.
A common finding: a high-volume OTA partner looks strong on bookings but weak on net revenue once commissions are factored in. This dashboard makes that visible, so you can shift strategy with a clear rationale rather than a hunch.
| Who's it for | Revenue managers, general managers, sales directors, marketing managers, finance teams, property owners, corporate executives, asset managers, front office managers, reservation teams |
|---|---|
| How often it's needed | Real-time, daily, weekly, monthly, quarterly |
| Covered KPIs | ADR, Occupancy Rate, GOPPAR, Revenue by Market Segment, Revenue by Channel, Room Nights Sold, Length of Stay, Booking Lead Time, Cancellation Rate, No-Show Rate, Upsell and Cross-Sell Revenue, Food and Beverage Revenue, Meeting and Event Revenue, Spa and Wellness Revenue, Parking Revenue, Revenue Pace, Pick-Up, Year-over-Year Growth, Market Penetration Index, Revenue Forecast Accuracy, Price Positioning vs. Competitors, Cost of Customer Acquisition, Total Revenue by Day of Week |
Guest Satisfaction Dashboard
A Guest Satisfaction Dashboard links survey results, online review scores, and social media sentiment into one view, so you know how guests feel without having to check five platforms separately. You'll see which departments are earning praise and where complaints are clustering, in real time.
Faster visibility means faster response. A spike in check-in complaints on a Friday evening is something you can address that night, not in next week's debrief.
| Who's it for | General managers, front office managers, guest relations managers, housekeeping managers, food and beverage managers, marketing teams, customer service representatives, department heads, quality assurance teams, executive leadership |
|---|---|
| How often it's needed | Real-time, daily, weekly, monthly |
| Covered KPIs | Overall Guest Satisfaction Score, Net Promoter Score (NPS), Review Ratings on OTAs and review sites, Guest Complaint Rate, Time to Resolve Complaints, Guest Survey Response Rate, Cleanliness Ratings, Staff Friendliness Score, Check-In/Check-Out Experience Rating, Room Comfort Score, Wi-Fi Satisfaction, Food and Beverage Quality Rating, Value for Money Perception, Loyalty Program Enrolment Rate, Repeat Guest Percentage, Recommendation Likelihood, Social Media Sentiment, In-Stay Feedback Score, Post-Stay Survey Results, Amenity Usage Satisfaction, Room Service Rating, Concierge Service Effectiveness, Spa and Wellness Experience Rating, Event and Meeting Planner Satisfaction, Brand Standards Compliance Rate |
Channel Performance Dashboard
A Channel Performance Dashboard tracks every booking source: OTAs, direct, corporate accounts, metasearch, and more. It compares booking volume, ADR, and commission costs across channels so you can see which ones are actually profitable, not just busy.
The insight most properties find useful: direct bookings through their own site often deliver significantly higher margins than OTA volume. This dashboard makes that case with your own numbers, so the decision to shift spend is grounded in evidence, not assumption.
| Who's it for | Revenue managers, distribution managers, e-commerce managers, marketing directors, general managers, sales teams, channel managers, OTA account managers, digital marketing specialists, executive leadership |
|---|---|
| How often it's needed | Real-time, daily, weekly, monthly, quarterly |
| Covered KPIs | Booking Volume by Channel, Revenue by Channel, Channel Contribution to Total Revenue, ADR by Channel, Cost per Acquisition by Channel, Commission Costs by Channel, Net ADR by Channel, Conversion Rate by Channel, Length of Stay by Channel, Lead Time by Channel, Cancellation Rate by Channel, Channel Mix Percentage, Year-over-Year Growth by Channel, Return on Advertising Spend (ROAS) by Channel, Mobile vs. Desktop Bookings by Channel, Loyalty Program Bookings by Channel, Direct Booking Percentage, Metasearch Performance, GDS Performance, Wholesaler Performance, OTA Market Share, Website Traffic and Conversion, Parity Compliance Across Channels, Channel-Specific Promotions Effectiveness, Channel-Specific Customer Lifetime Value |
Know your hotel's performance without having to ask
The most useful Hotel Dashboard doesn't just show you what happened. It keeps you informed without requiring you to run reports, chase numbers, or piece together data from multiple systems.
When revenue, guest sentiment, and channel performance are centralized and current, you spend less time figuring out where things stand and more time deciding what to do about it. A small team can operate with the same clarity as a much larger one.
Klips connects to your hotel's data sources and keeps everything in one reliable view. Start a free Klips trial and see what your property looks like when the numbers are always ready.