Ecommerce Dashboard
The complete guide to monitoring the metrics that matter for your online store.
What is an ecommerce dashboard?
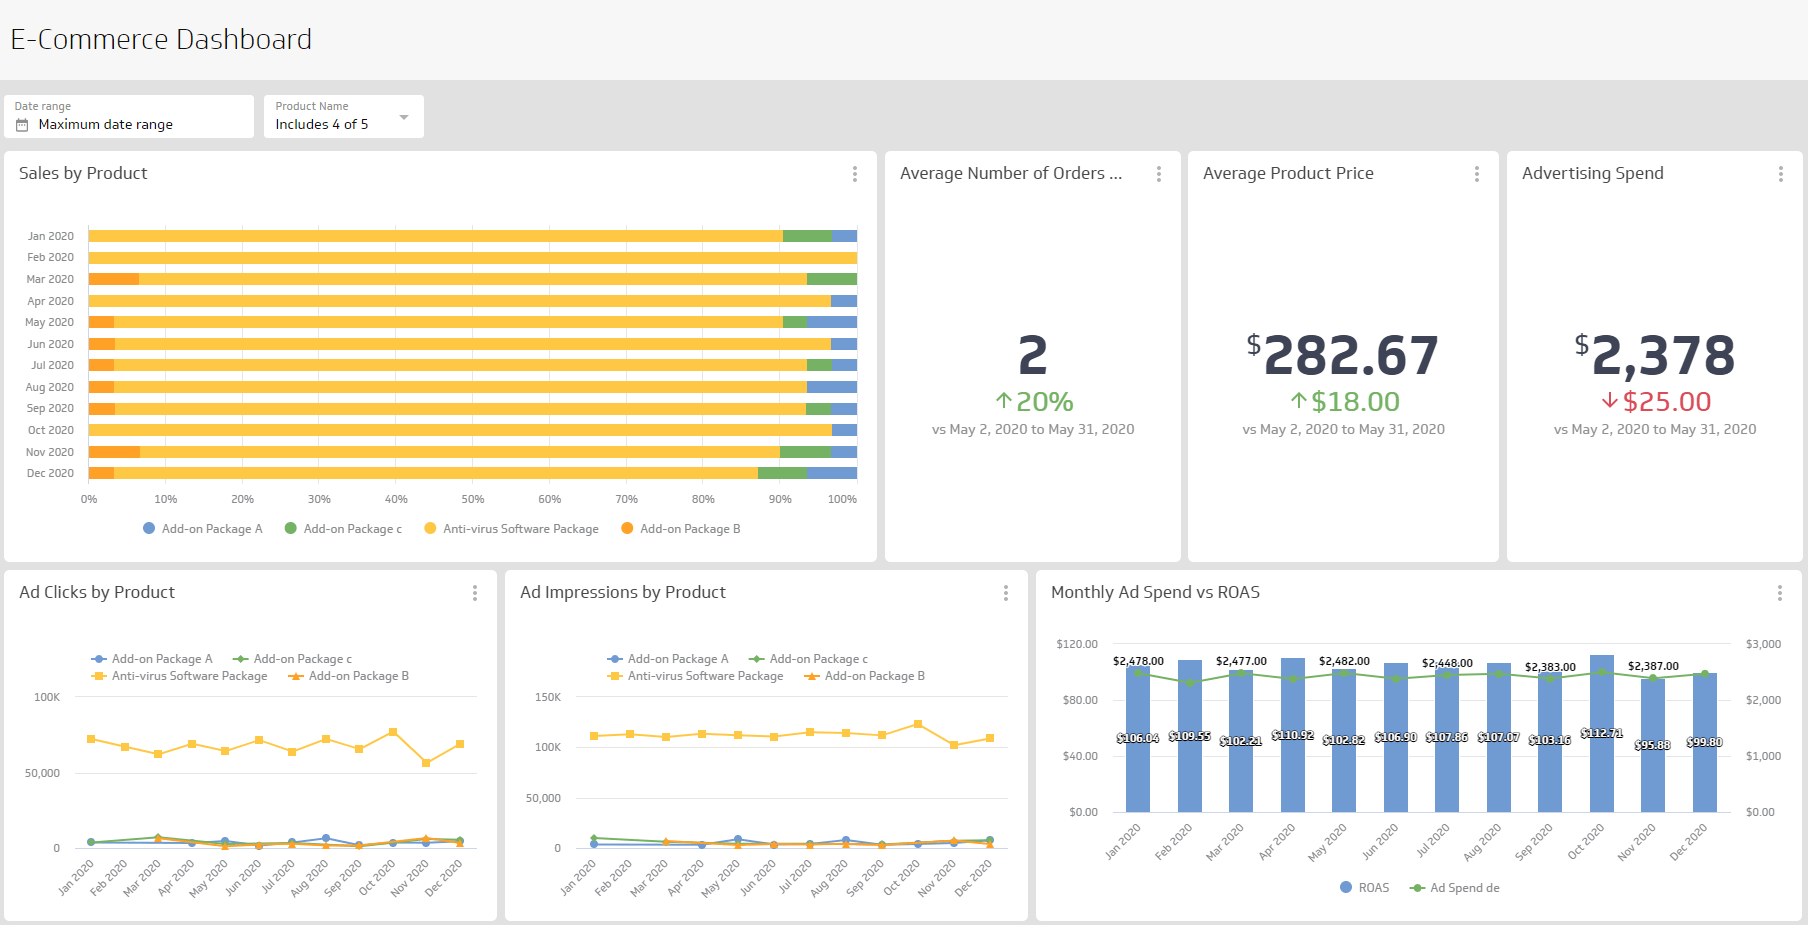
An ecommerce dashboard is a reporting tool that consolidates your online store's key performance metrics into a single, real-time view.
It pulls data from your sales platform, web analytics, advertising channels, and customer behaviour tools, giving your entire team a shared, up-to-the-minute picture of business performance. No more toggling between tabs or waiting for end-of-month reports, and no more pasting numbers into a spreadsheet or asking someone to pull a figure you needed an hour ago.
The goal is straightforward: put the right numbers in front of the right people so your team can act quickly and confidently.
Why your online store needs a dashboard
Ecommerce moves fast. Campaigns launch, traffic spikes, and conversion rates shift, often within hours. A dashboard lets you catch those changes as they happen, not after the damage is done.
Here is what a well-built Ecommerce Dashboard helps you do:
Spot trends early: Identify which channels are driving traffic and which are underperforming before you overspend.
Align your team: Everyone sees the same data, so marketing, sales, and operations stay coordinated.
Allocate budget with confidence: Real-time visibility into Cost per Acquisition and Return on Ad Spend means fewer wasted dollars.
Improve the customer experience: Behavioural data reveals where shoppers drop off and what keeps them coming back.
Know it without having to check: A well-configured dashboard surfaces what matters, so you are not hunting for answers or waiting on someone else to run a report.
The alternative, figuring it out yourself from disconnected sources, costs time your team does not have. When the numbers are reliable and always current, your team operates with the confidence of a much larger organization.
What to track on your ecommerce dashboard
What you track depends on your goals. A campaign-specific dashboard should focus narrowly on campaign KPIs. For day-to-day operations, you need a broader view that spans traffic, sales, and customer behaviour.
Here are the most important metrics to include:
Traffic and acquisition
Sessions and users: How many people are visiting your store and how often.
Traffic sources: Which channels, organic search, paid ads, email, social, referral, are bringing visitors in.
Bounce Rate: The percentage of visitors who leave without taking action.
New vs. returning visitors: A signal of both acquisition effectiveness and customer loyalty.
Traffic sources deserve particular attention on any marketing dashboard. If a significant share of your visitors comes from referrals, that insight could justify a customer referral programme. Understanding where your audience comes from is the foundation of smart budget allocation.
Sales and revenue
Total revenue: Your top-line number, tracked daily, weekly, and monthly.
Average Order Value (AOV): How much customers spend per transaction on average.
Conversion Rate: The percentage of visitors who complete a purchase.
Cart Abandonment Rate: How many shoppers add items but do not check out.
Revenue by channel: Which sources are actually generating sales, not just traffic.
Customer metrics
Customer Acquisition Cost (CAC): What you spend to win each new customer.
Customer Lifetime Value (CLV): The total revenue a customer generates over their relationship with your brand.
Repeat Purchase Rate: How often customers come back to buy again.
Refund and return rate: A signal of product quality and customer satisfaction.
Customer metrics are where the real story lives. Acquisition numbers tell you what happened last week; Customer Lifetime Value and Repeat Purchase Rate tell you whether your business is actually growing.
Marketing performance
Click-Through Rate (CTR): How effectively your ads and emails prompt action.
Cost per Click (CPC): What you pay for each visit from paid channels.
Return on Ad Spend (ROAS): Revenue generated for every dollar spent on advertising.
Email open and click rates: Engagement signals from your owned channel. See email marketing metrics to understand which numbers matter most.
How to build an ecommerce dashboard
Building a useful dashboard starts with a few key questions:
Who will use it? An executive dashboard emphasizes high-level KPIs. An operations dashboard goes deeper into fulfilment and inventory data.
What decisions does it need to support? Tie every metric back to a business question.
Where does the data live? Identify your sources, Shopify, Google Analytics 4, Meta Ads, email platforms, before you start building.
How often does it need to refresh? Sales and traffic metrics warrant hourly or daily updates; Customer Lifetime Value and Repeat Purchase Rate are more meaningful week-over-week.
Once you have answered those questions, you can narrow your metric list, choose the right visualizations, and design a layout that communicates clearly at a glance.
A clean Ecommerce Dashboard avoids clutter. Include only the metrics your audience acts on. If a number does not change a decision, it probably does not belong on the dashboard.
Create custom dashboards for you and your team.
Get started with KlipsFrom data to decisions
A well-built Ecommerce Dashboard moves your team beyond gut instinct. When everyone references the same real-time data, conversations shift from "I think traffic is down" to "traffic from paid search dropped 18% this week, here is why, and here is what we are doing about it."
That shift is the real value: faster decisions, fewer surprises, and a clearer path to growth. Your team stops waiting for answers and starts acting on them.
Ready to build your own? Explore Klipfolio Klips and see how easy it is to connect your data sources and create dashboards your whole team will actually use.