Status Dashboard
A clear guide to tracking your team's most important metrics in one place.
What is a status dashboard?
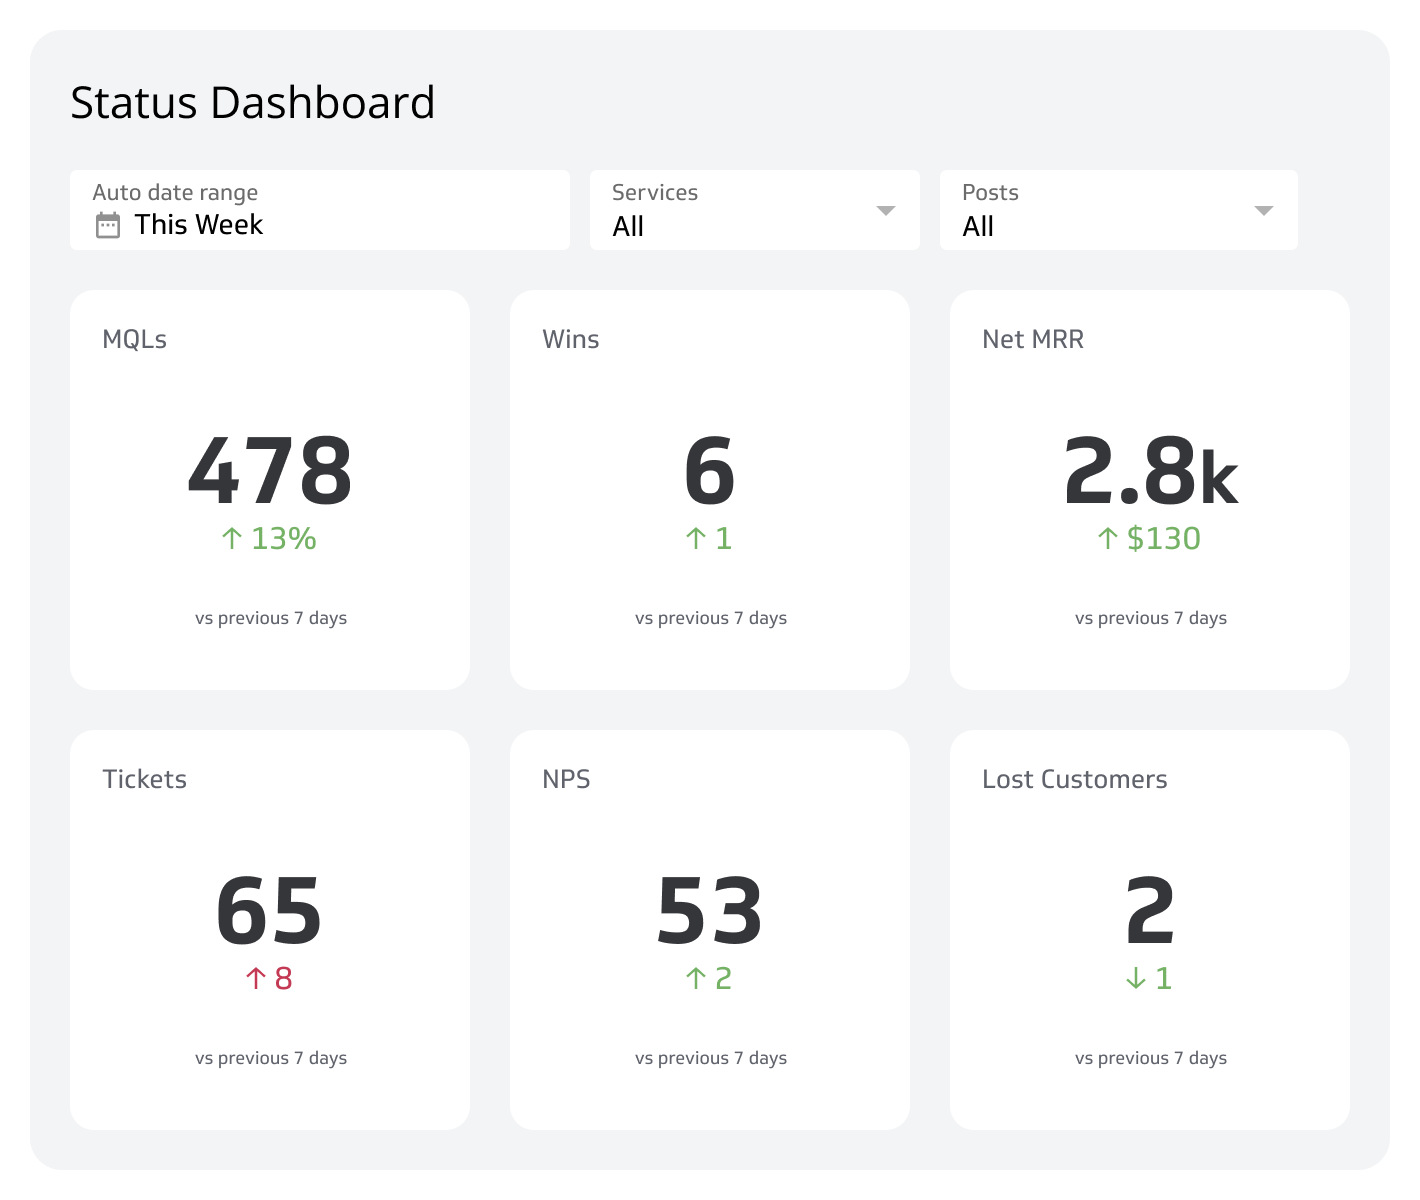
A status dashboard is a visual display that shows real-time updates on your most important KPIs and operational data, all in one place.
When your numbers are scattered across apps, spreadsheets, and inboxes, decisions slow down and teams fall out of sync. A status dashboard fixes that. Instead of waiting for someone to pull a report or pasting figures into a chatbot and explaining your business from scratch, you get a single, always-current view that tells you what's happening and what needs attention.
From IT operations to marketing campaigns, status dashboards help teams across every function stay aligned and move faster.
Key components of a status dashboard
A great status dashboard is more than a collection of charts. It combines the right data, clear visuals, and reliable connections to your sources.
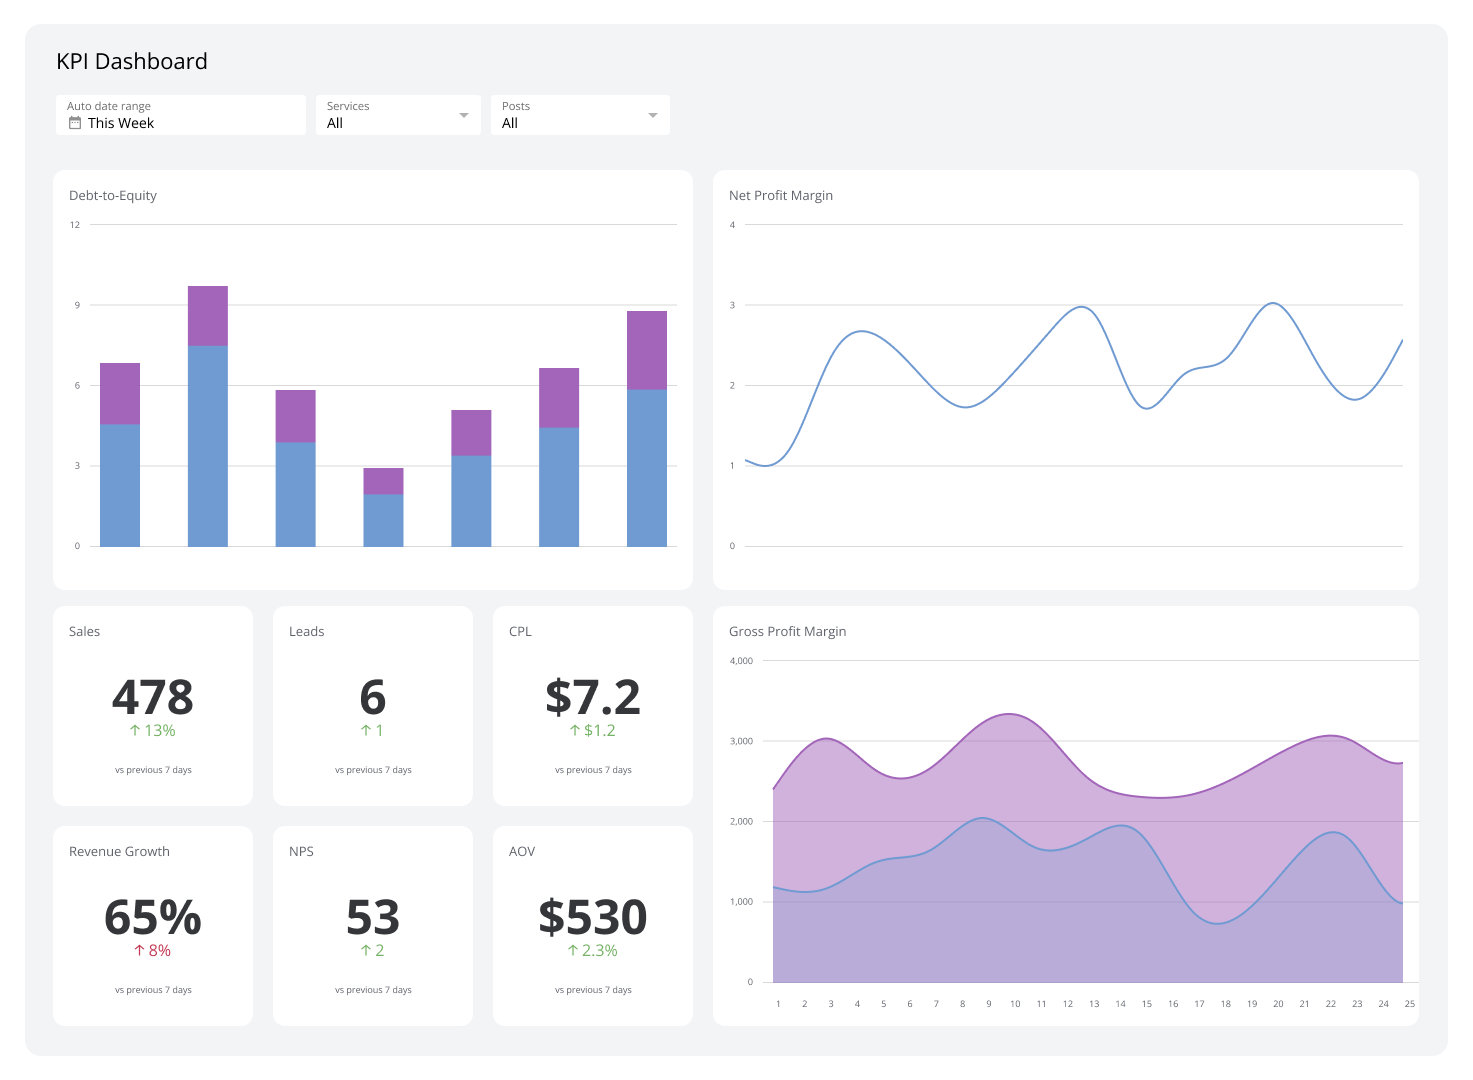
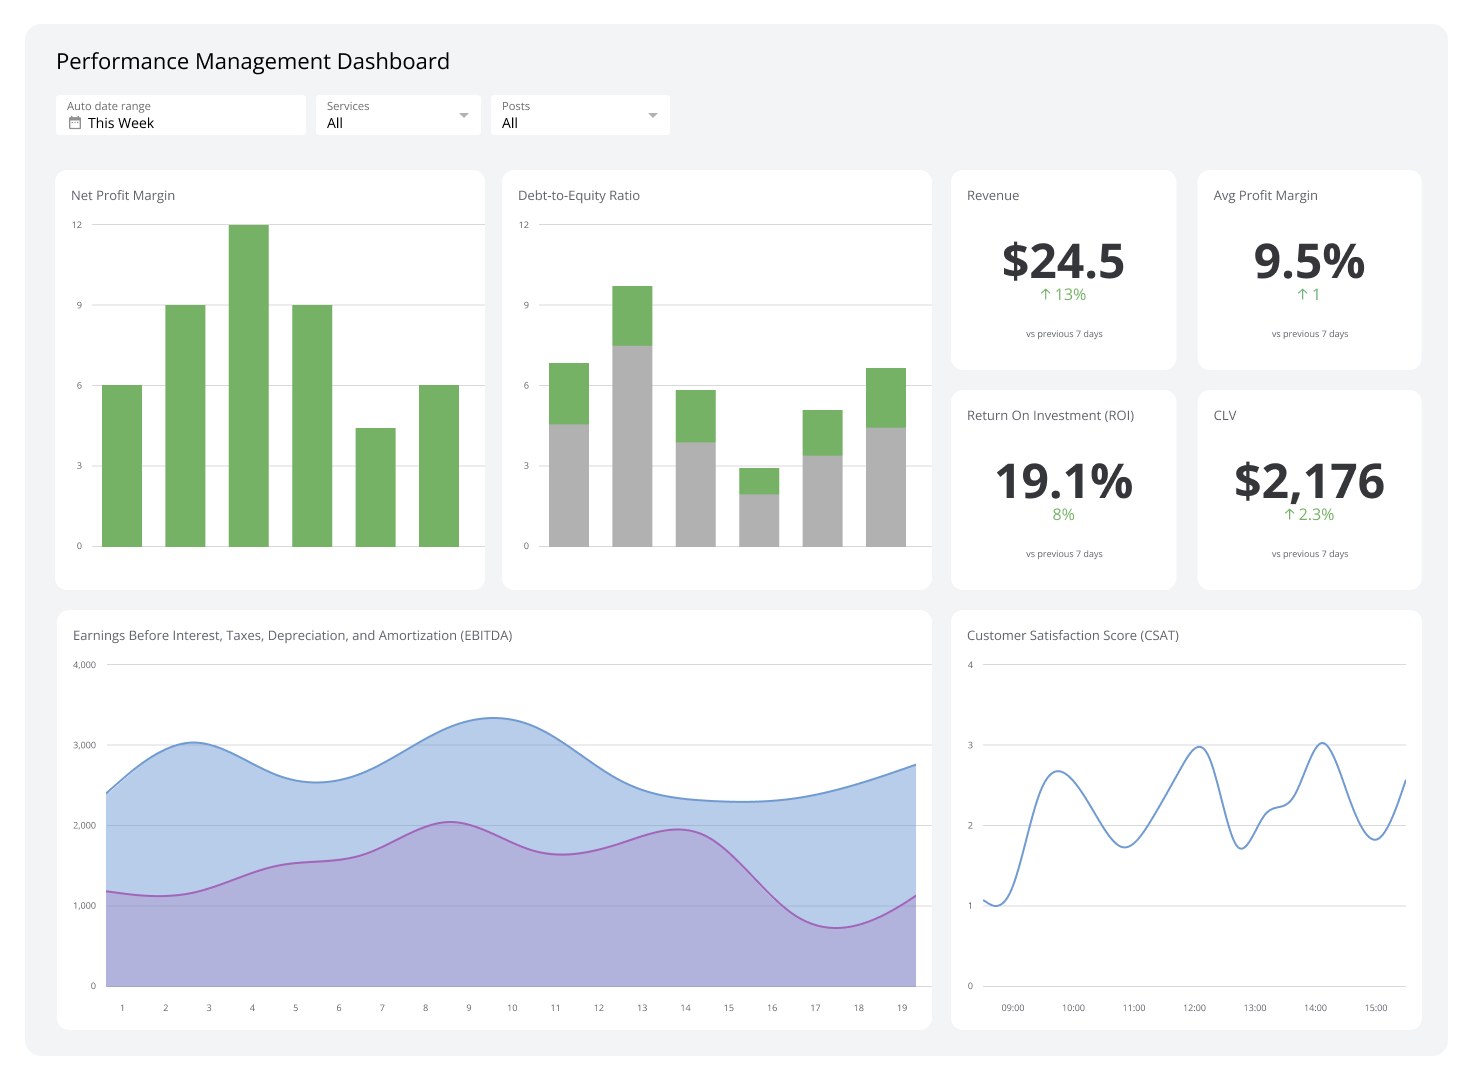
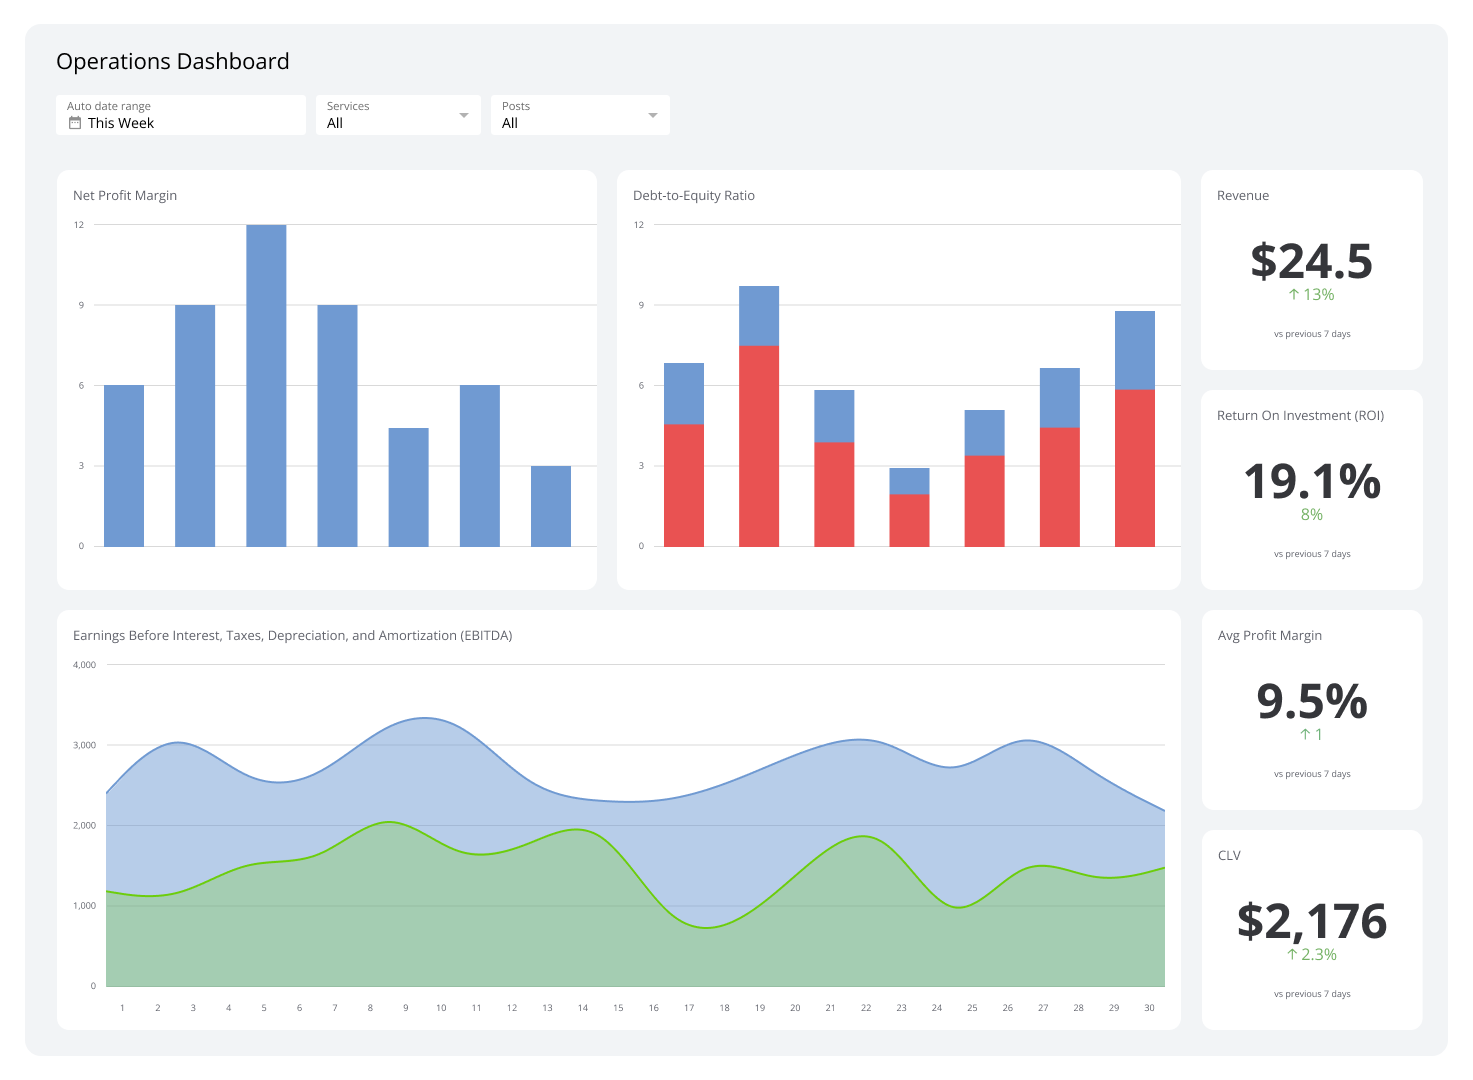
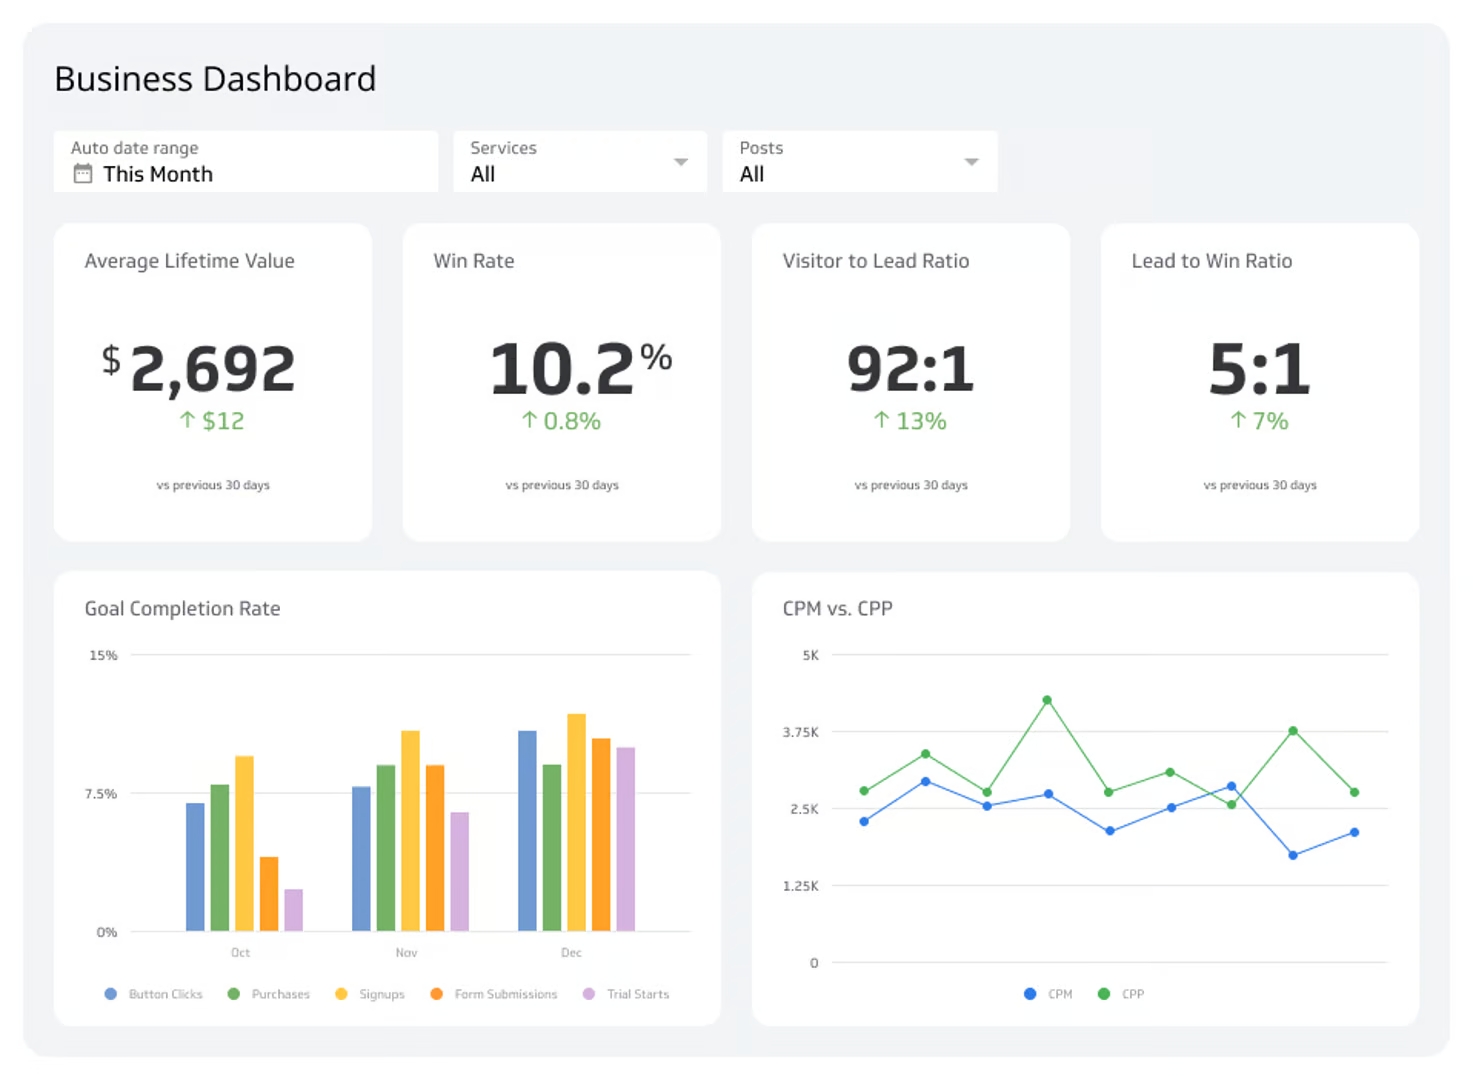
KPIs: The measures that tell you whether things are on track. A status dashboard displays KPIs in an easily readable format, like gauges or number callouts, so you can assess performance at a glance.
Real-time data: Status dashboards connect directly to your data sources and refresh automatically, so the numbers you see reflect what's actually happening right now.
Visual elements: Charts, graphs, and tables make complex data readable without analysis. The goal is a clear answer, not a dataset to interpret.
Accessible design: The layout works for everyone on your team, regardless of technical background. You should be able to read it in seconds, not minutes.
Why status dashboards matter
The goal isn't a prettier report. It's knowing what's happening in your business without having to ask, dig, or wait.
Faster decisions: When the right numbers are already in front of you, you act with confidence instead of chasing confirmation.
Less manual work: A consolidated view eliminates the time your team spends collecting, combining, and re-explaining data every week.
Team alignment: When everyone references the same live numbers, you stop arguing about whose version is right and start acting on what's true.
Early warning: Continuous monitoring means you catch a dip in performance when it happens, not at the end of the month when it's harder to fix.
Common applications for status dashboards
Status dashboards serve nearly any department or industry. Here are some of the areas where they have the most impact:
IT operations: Monitor network health, server uptime, and system performance for rapid issue detection and resolution.
Marketing: Track campaign performance, website traffic, lead generation, and return on marketing investment (ROI) to sharpen strategy in real time.
Sales: Monitor sales figures, track sales opportunities, and analyze pipeline performance to keep revenue on target.
Customer support: Track ticket resolution times, customer satisfaction scores (CSAT), and support team performance to maintain service quality.
Project management: Monitor progress against timelines, manage resources, and keep stakeholders informed without a single status meeting.
How to build a status dashboard
Building an effective status dashboard starts with knowing what you need to track and what decisions the dashboard needs to support.
Define your goals. Identify the questions your team asks most often. Start there, not with the data you have available.
Choose your metrics. Select KPIs that directly reflect progress toward those goals. Limit the dashboard to what's actionable. More metrics rarely means more clarity.
Connect your data sources. Pull data from your existing tools: CRMs, marketing platforms, support systems, cloud storage, or databases, into a single view.
Design for your audience. Tailor the layout and level of detail to whoever will use it. An executive dashboard looks different from an operations dashboard.
Klipfolio Klips gives you 130+ data connectors, Excel-like formulas for data modelling, and flexible layouts to build status dashboards that update automatically and reach your whole team, without requiring anyone to go looking for the numbers.
Create custom dashboards for you and your team.
Get started with Klips