Klip Gallery
Track your key performance measures with pre-built Klips. Get the ones that matter most to your business from the Gallery to your dashboard in minutes.
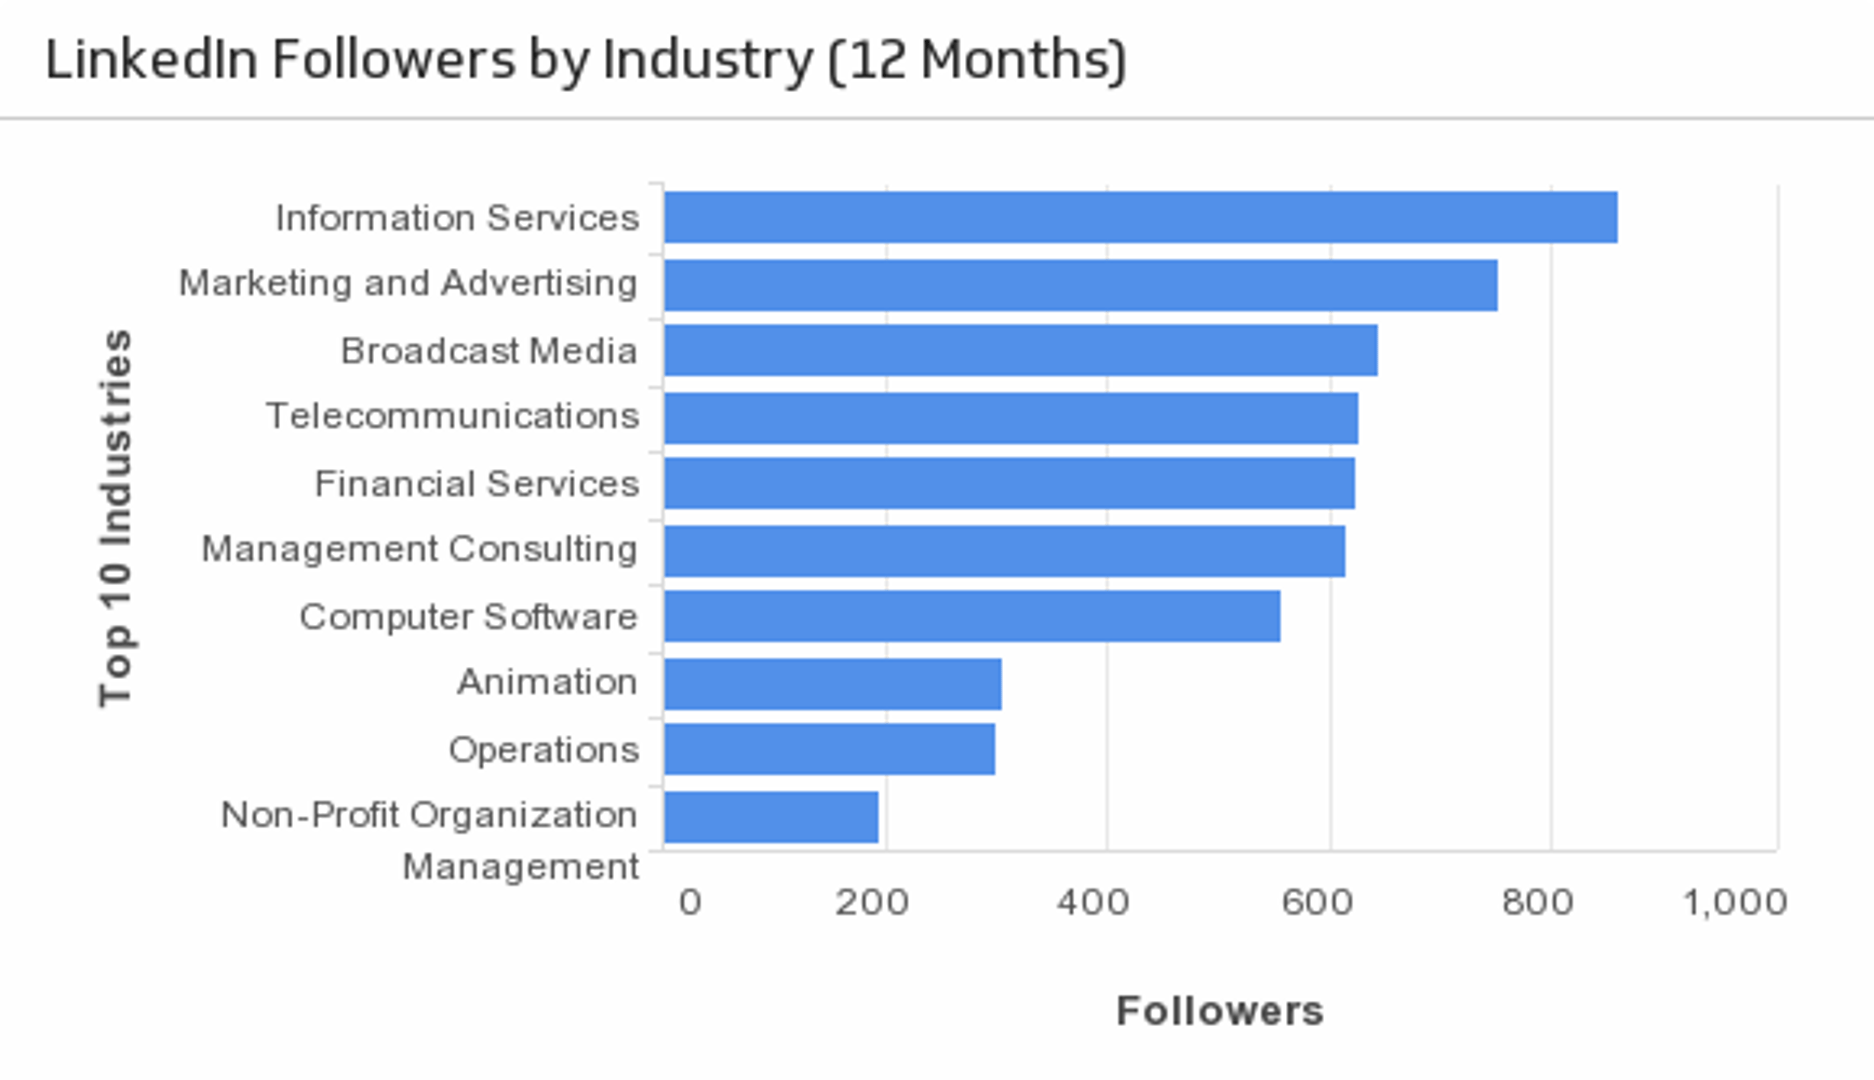
Followers by Industry
See what industries are dominant amongst your LinkedIn followers. (Past 12 months)
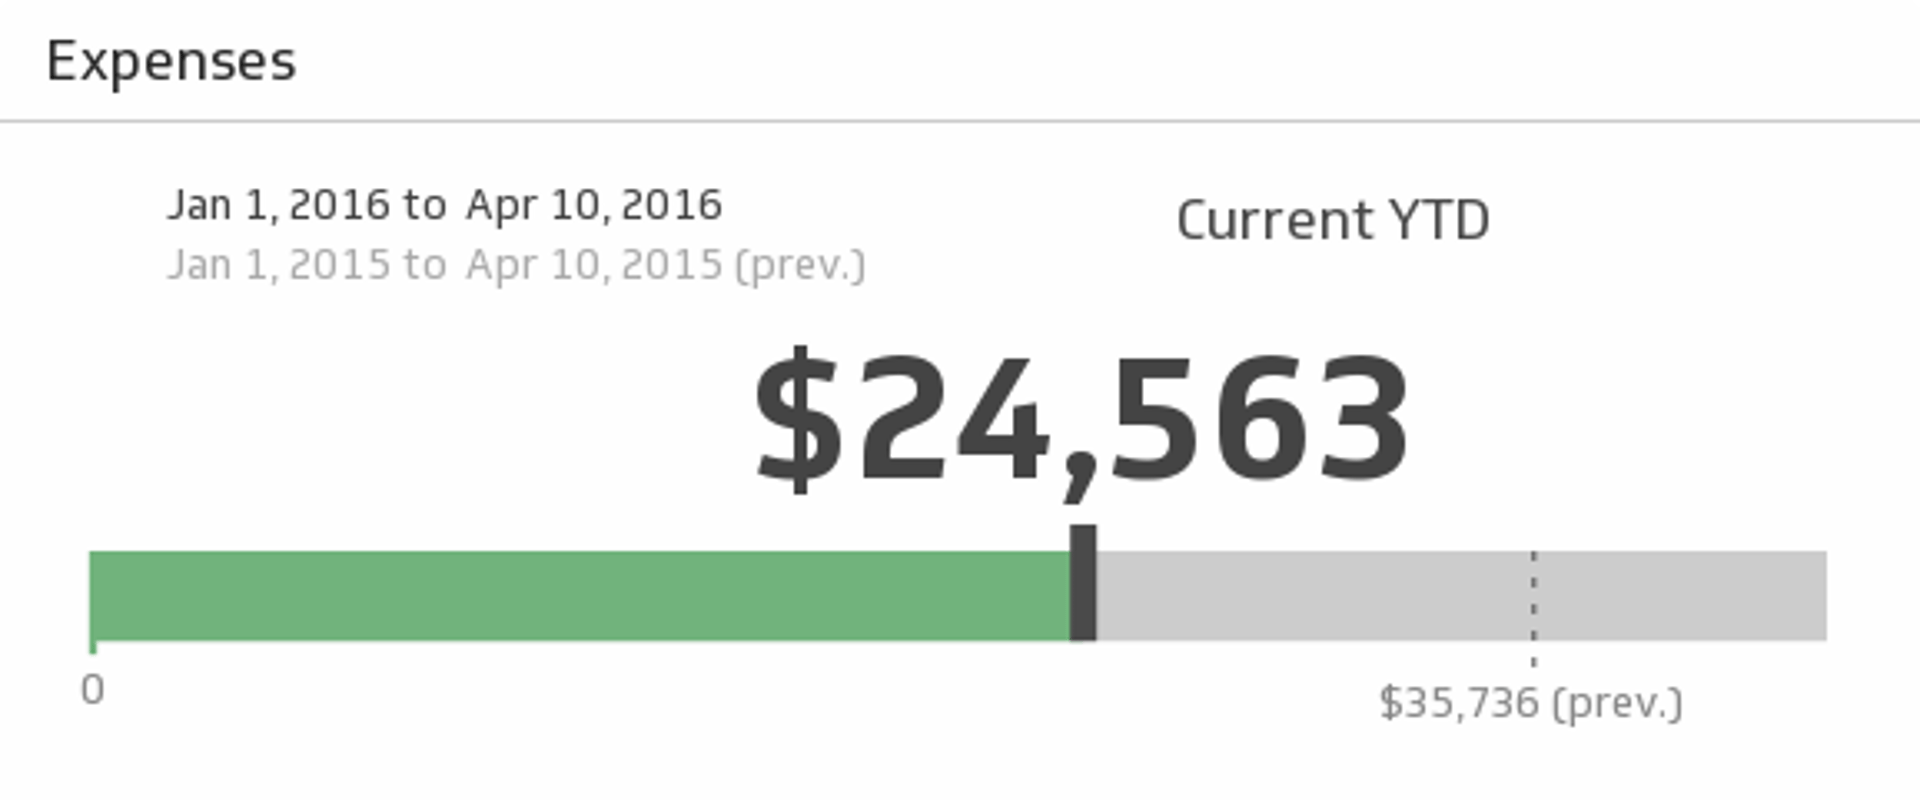
UsesFreshBooks Expenses
Monitor your business expenses for the time period of your choice and see if you spent as much during the previous period.
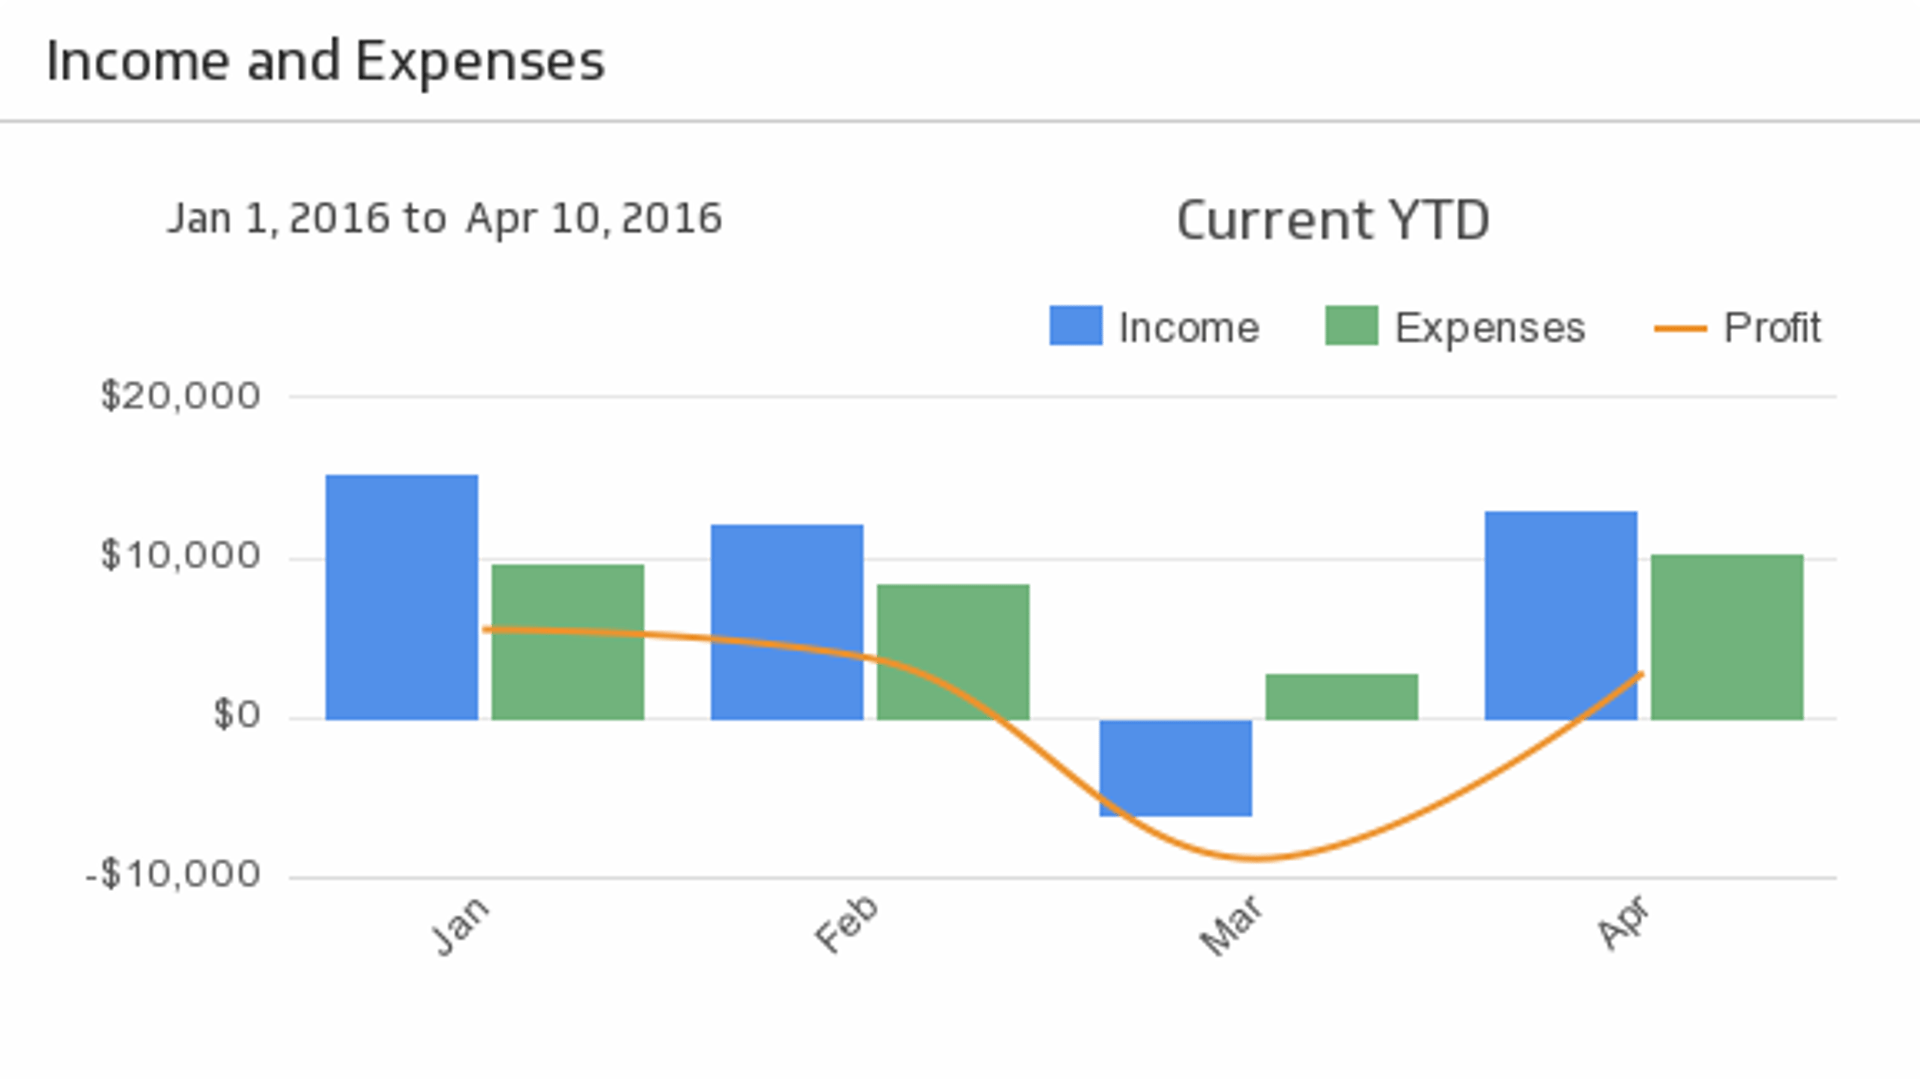
UsesFreshBooks Income and Expenses
Bring your key accounting puzzle pieces - Income, Expenses, and Profit - together to help you make actionable decisions. Choose the time period of your choice from the drop-down menu, and compare to the previous period.
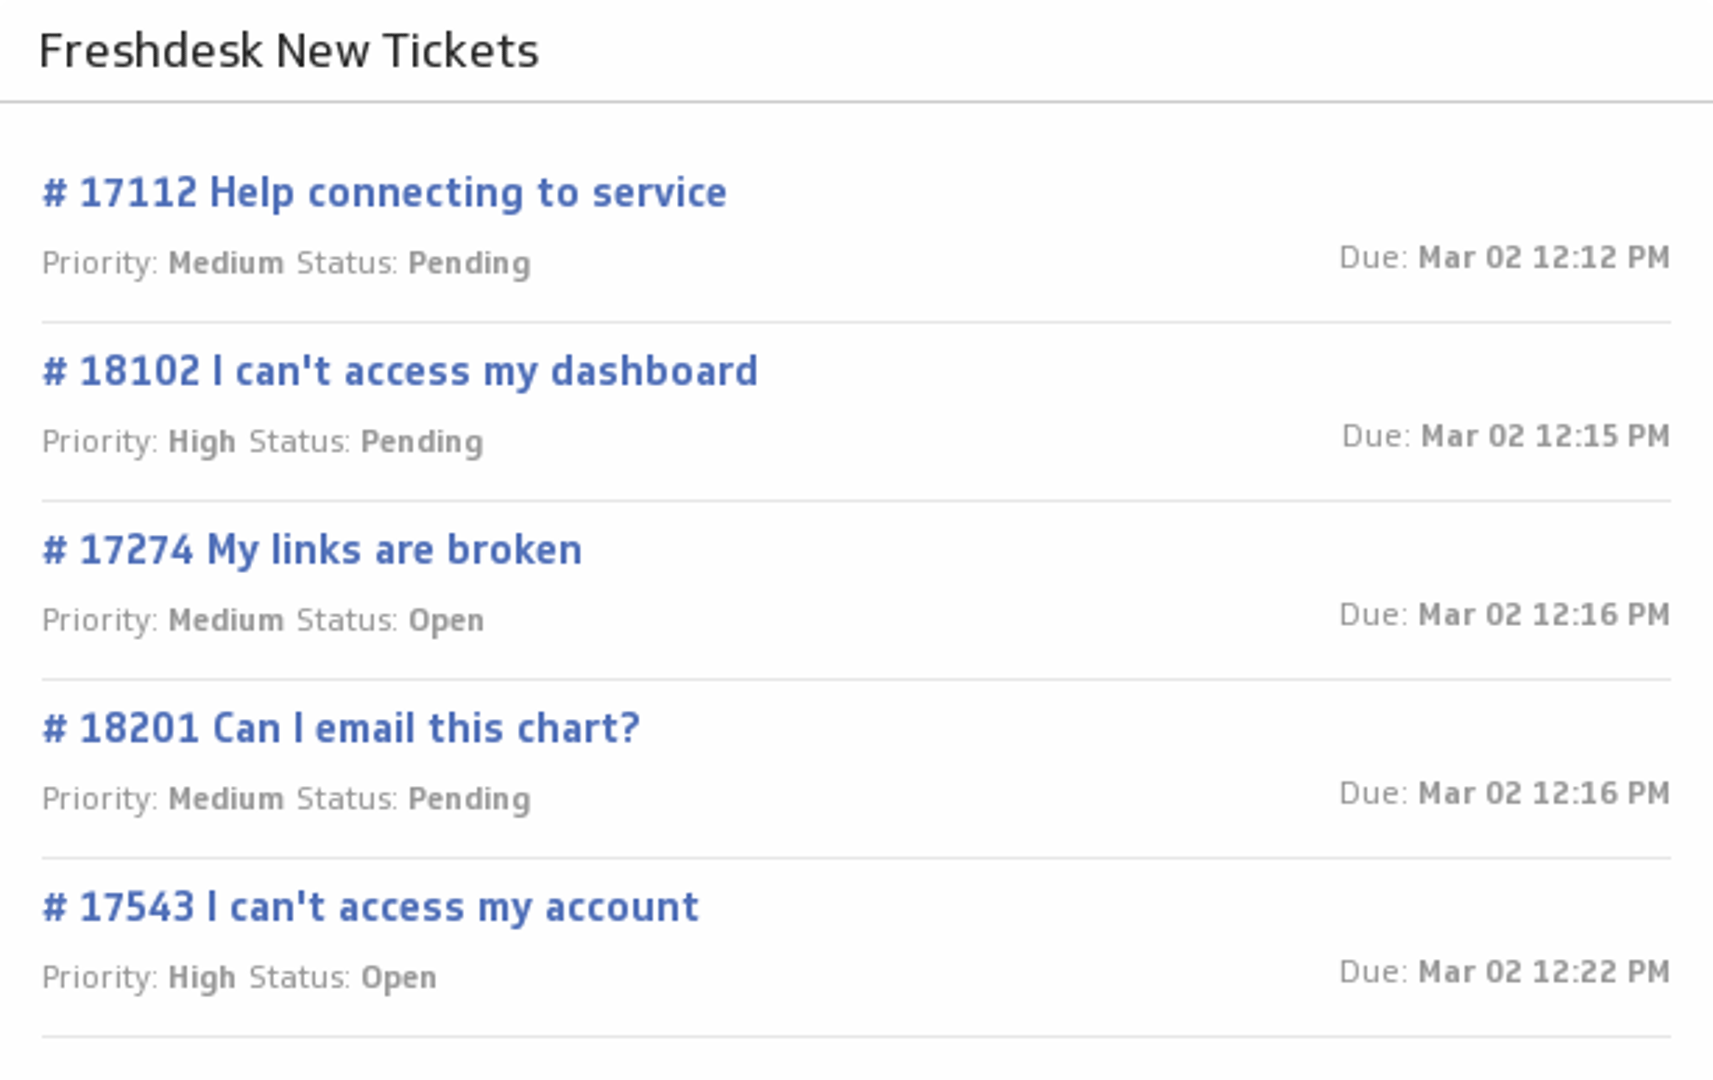
UsesFreshdesk New Tickets
Be the best customer support team you can be! Add a list of your latest Freshdesk tickets to your dashboard, and track their status and priority levels.
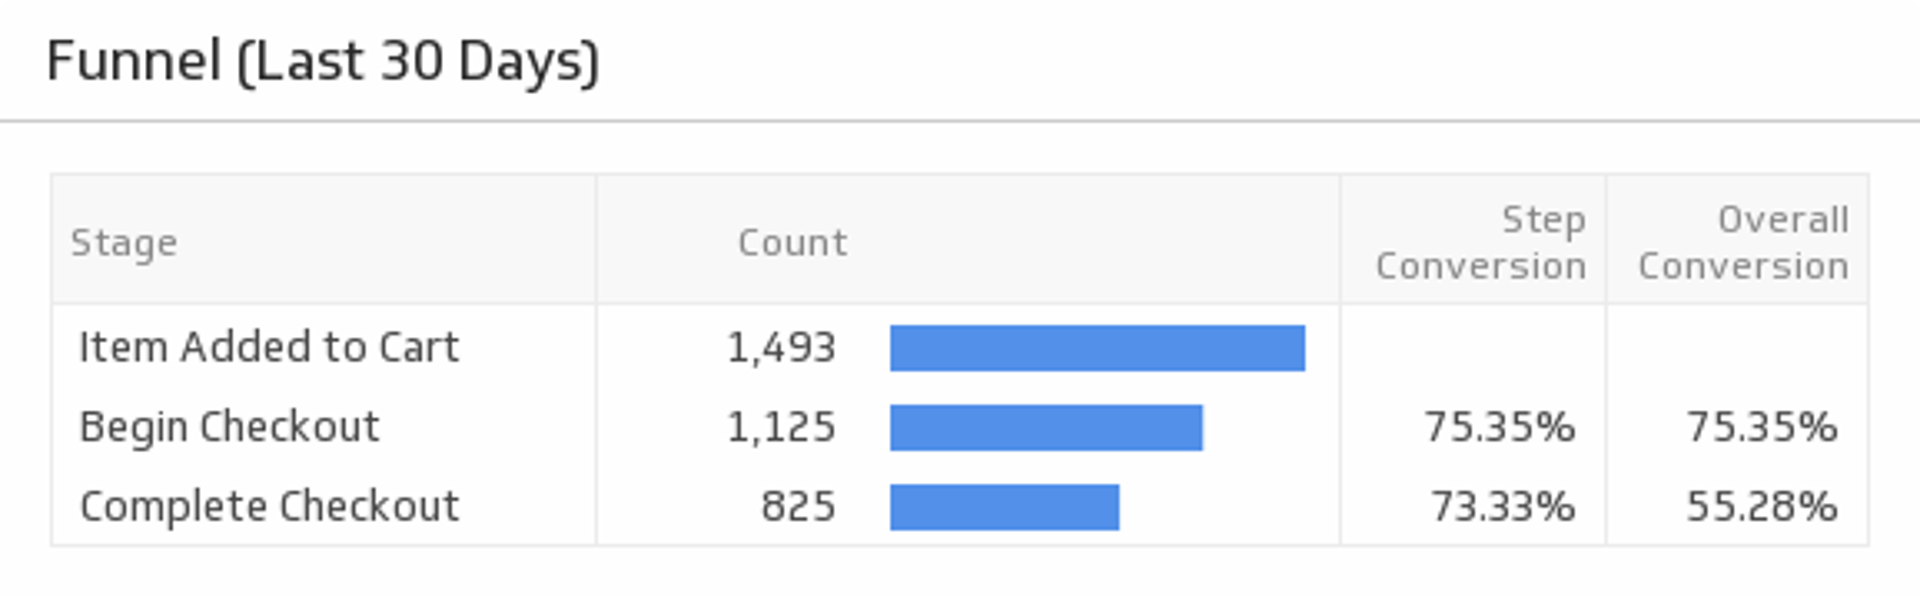
UsesFunnel
Show the funnel from events in your Localytics account.
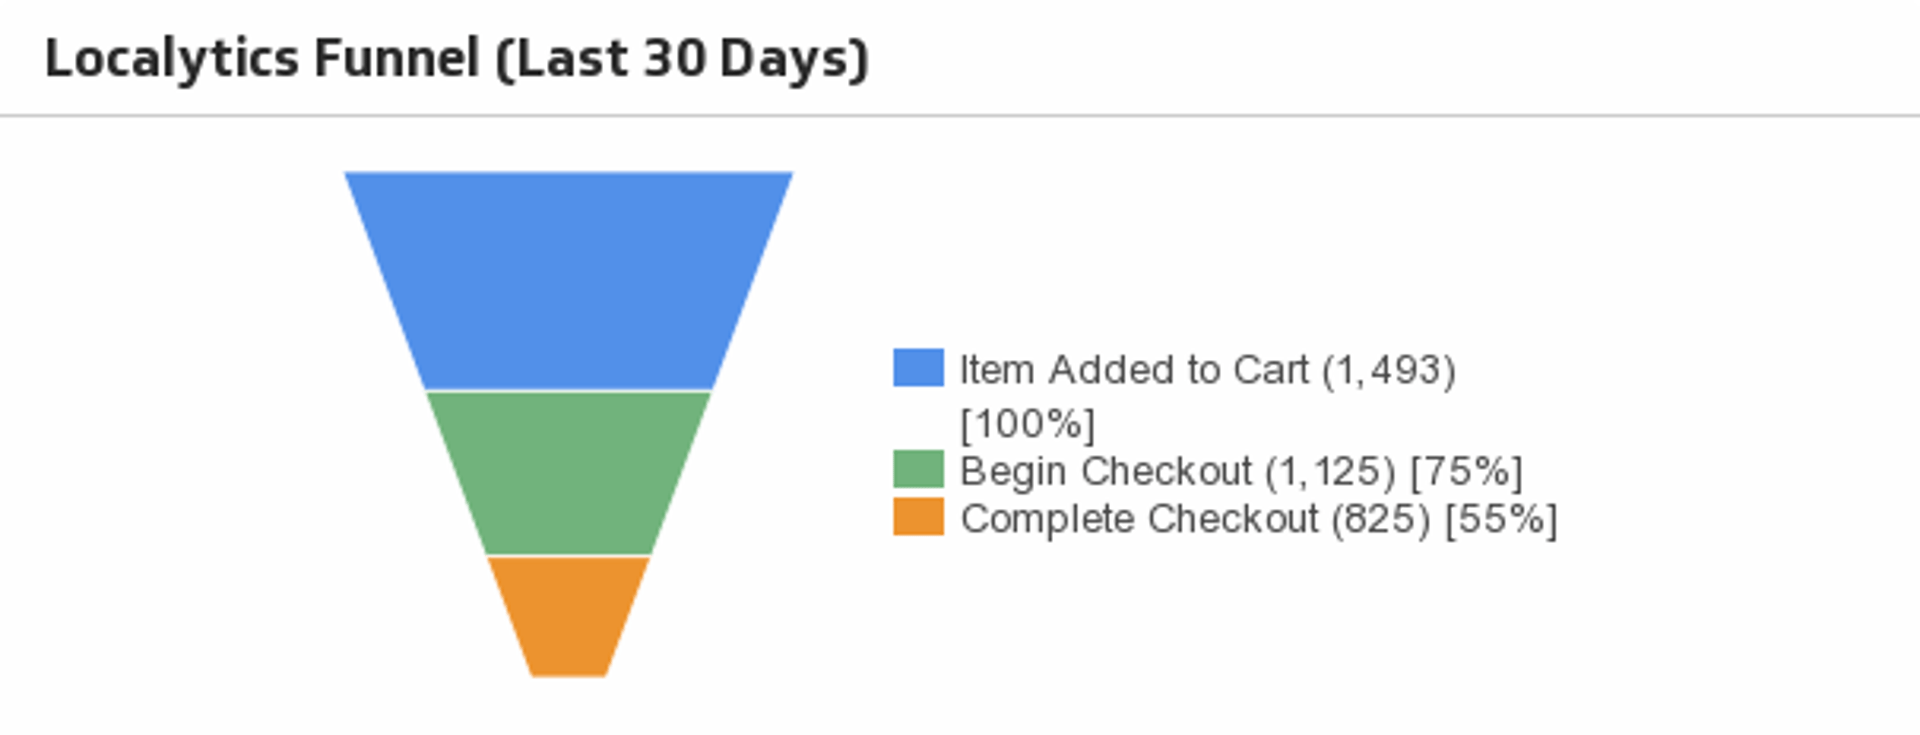
UsesFunnel (Last 30 Days)
Use this Localytics funnel to understand the flow of user activity.
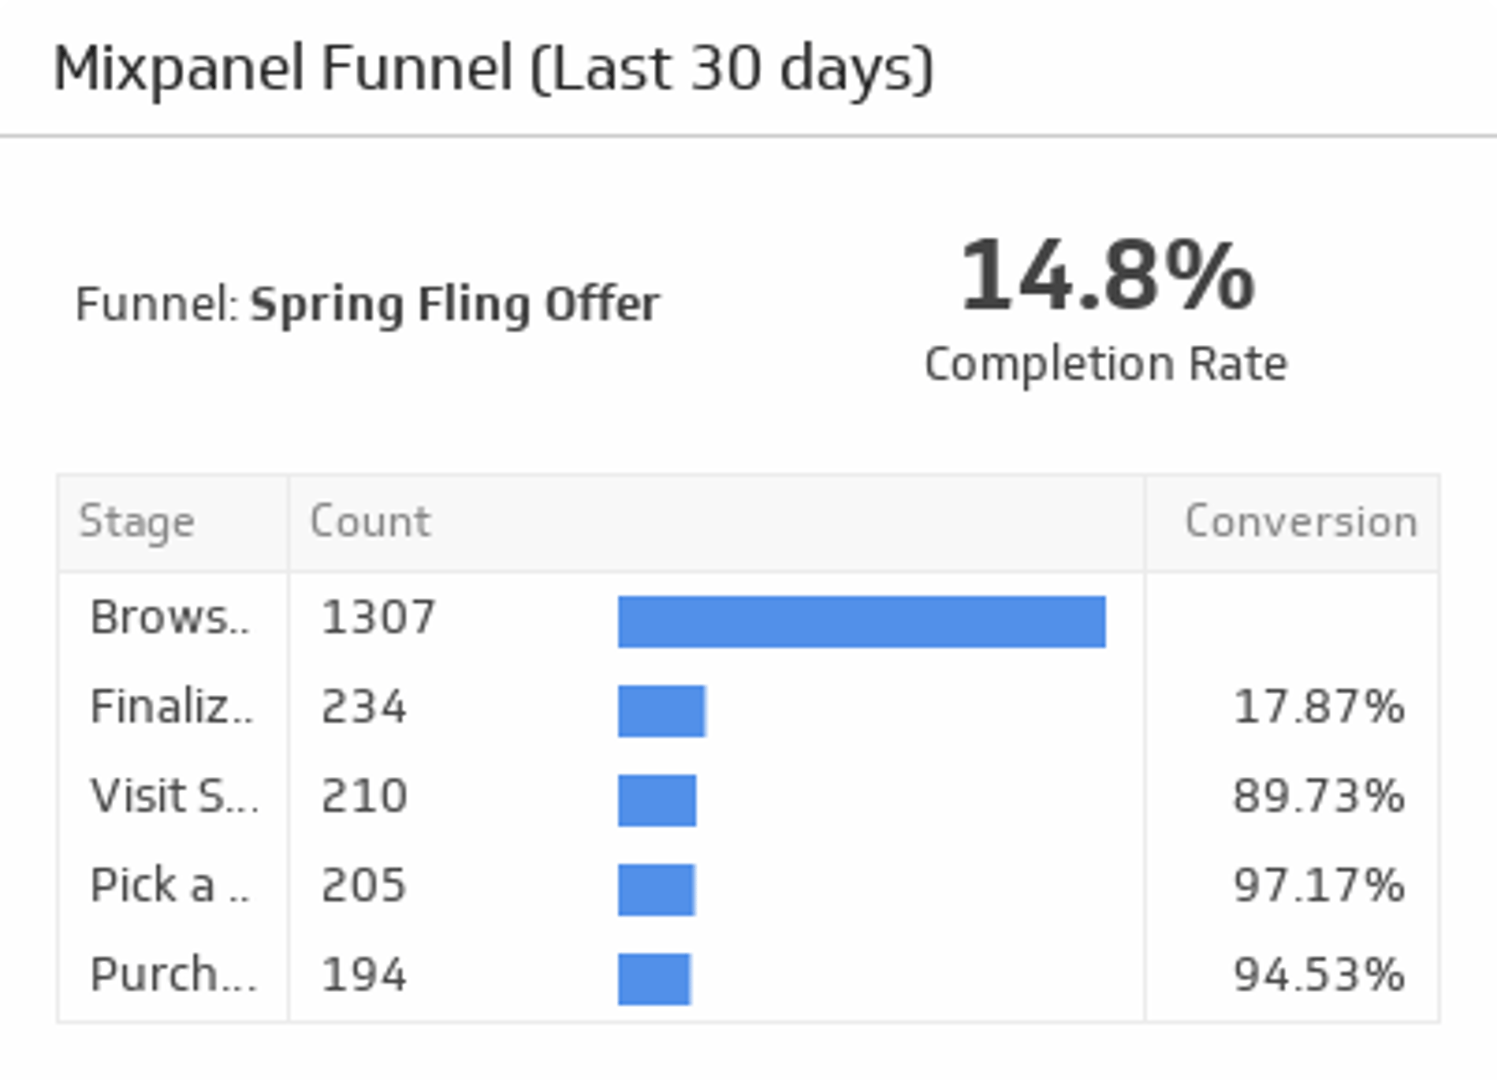
UsesFunnel (Last 30 Days)
Track your conversion rate between the stages of a Mixpanel funnel, and compare it to your average funnel completion rate.
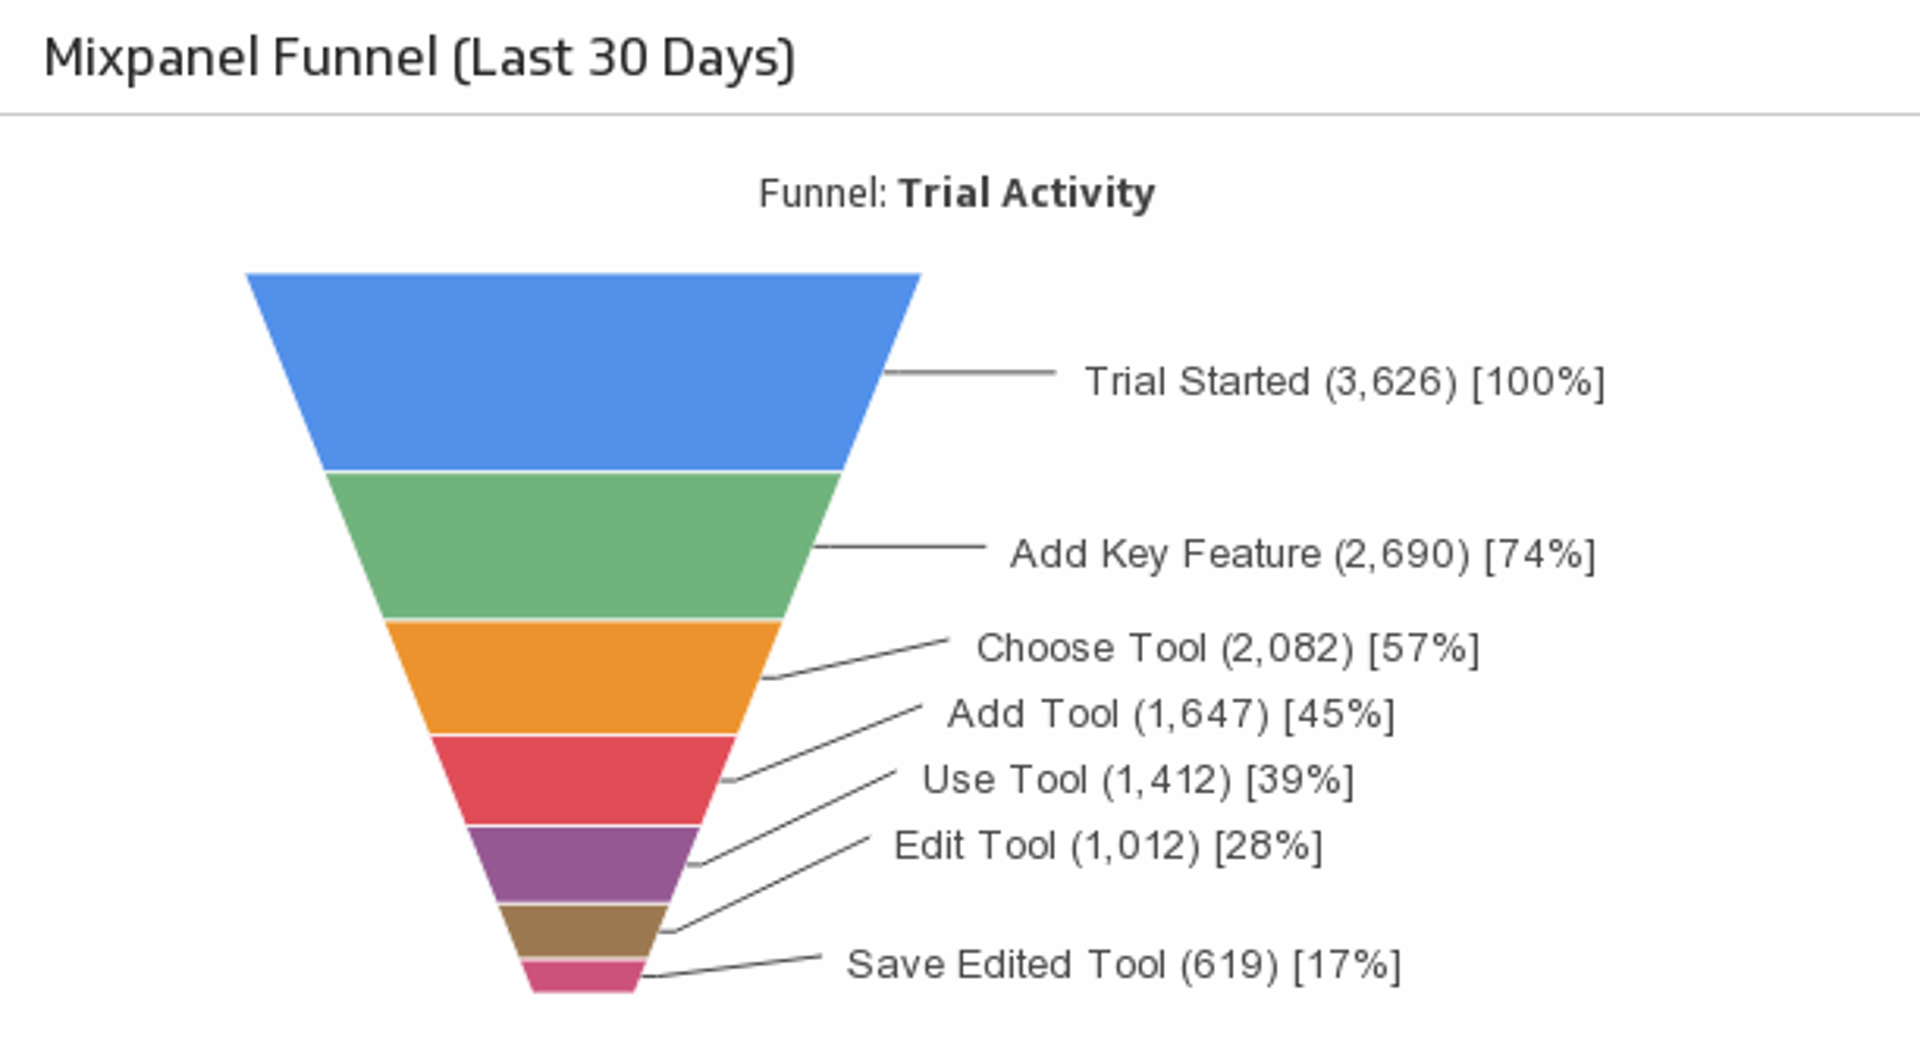
UsesFunnel (Last 30 Days)
Increase your conversion rates by taking the time to monitor a funnel displaying your app activity.
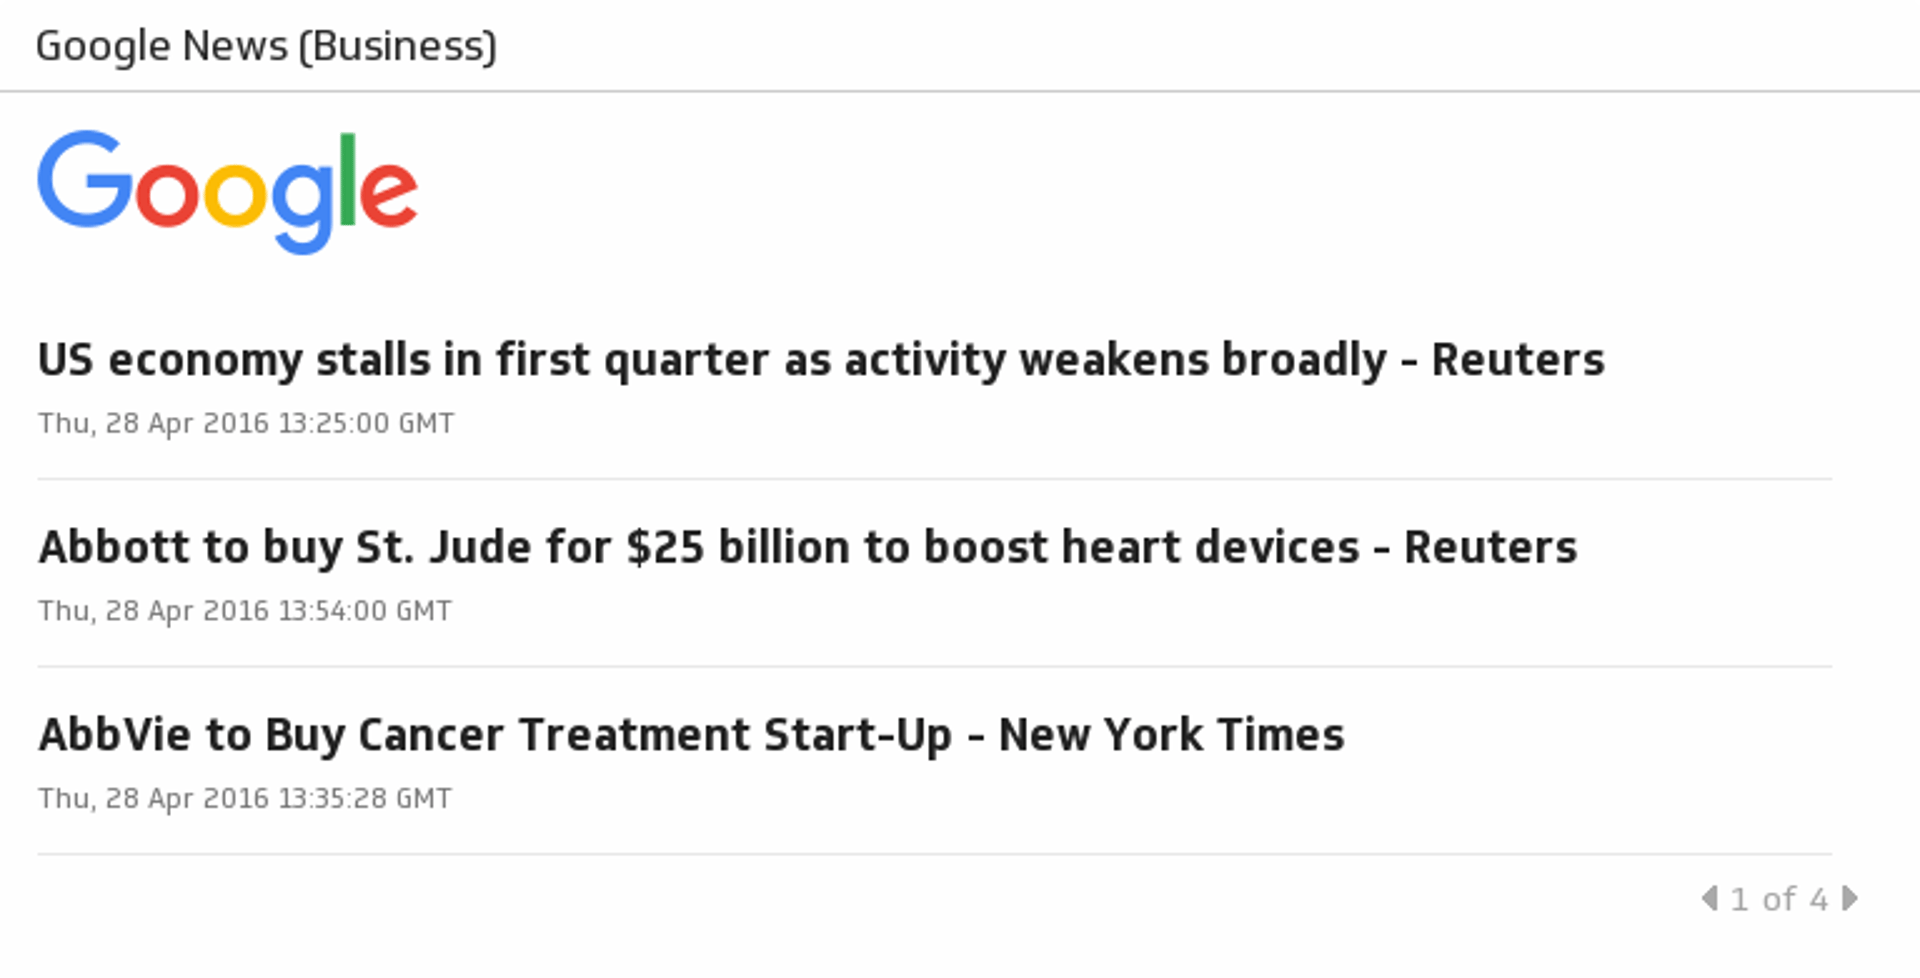
UsesGoogle News (Business)
Get the latest on business stories, company news, world economy, stocks, finance, investments, market trends and more with the Business section of Google.
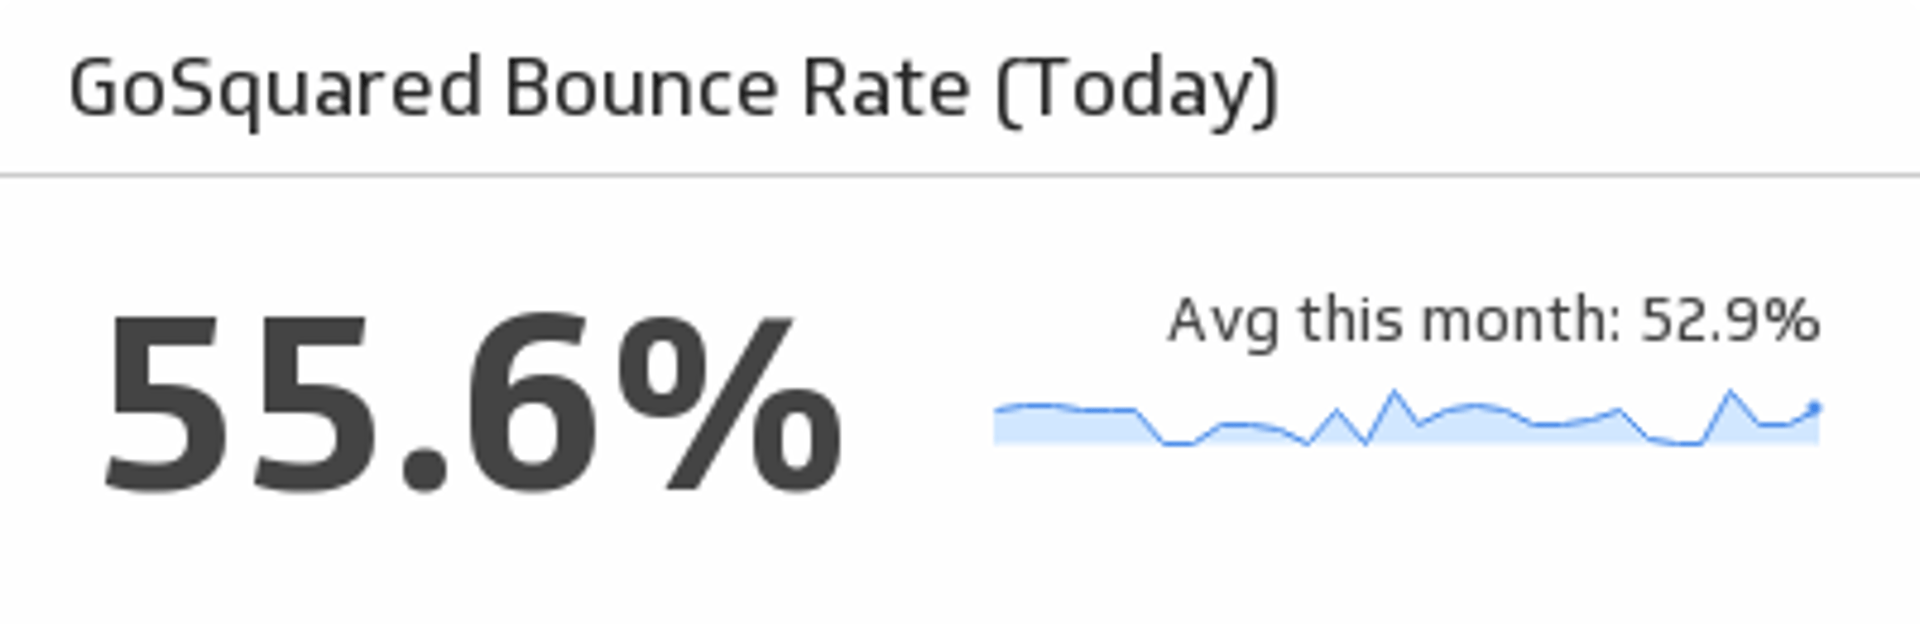
UsesGoSquared Bounce Rate
Monitor your website’s bounce rate for the last 30 days.
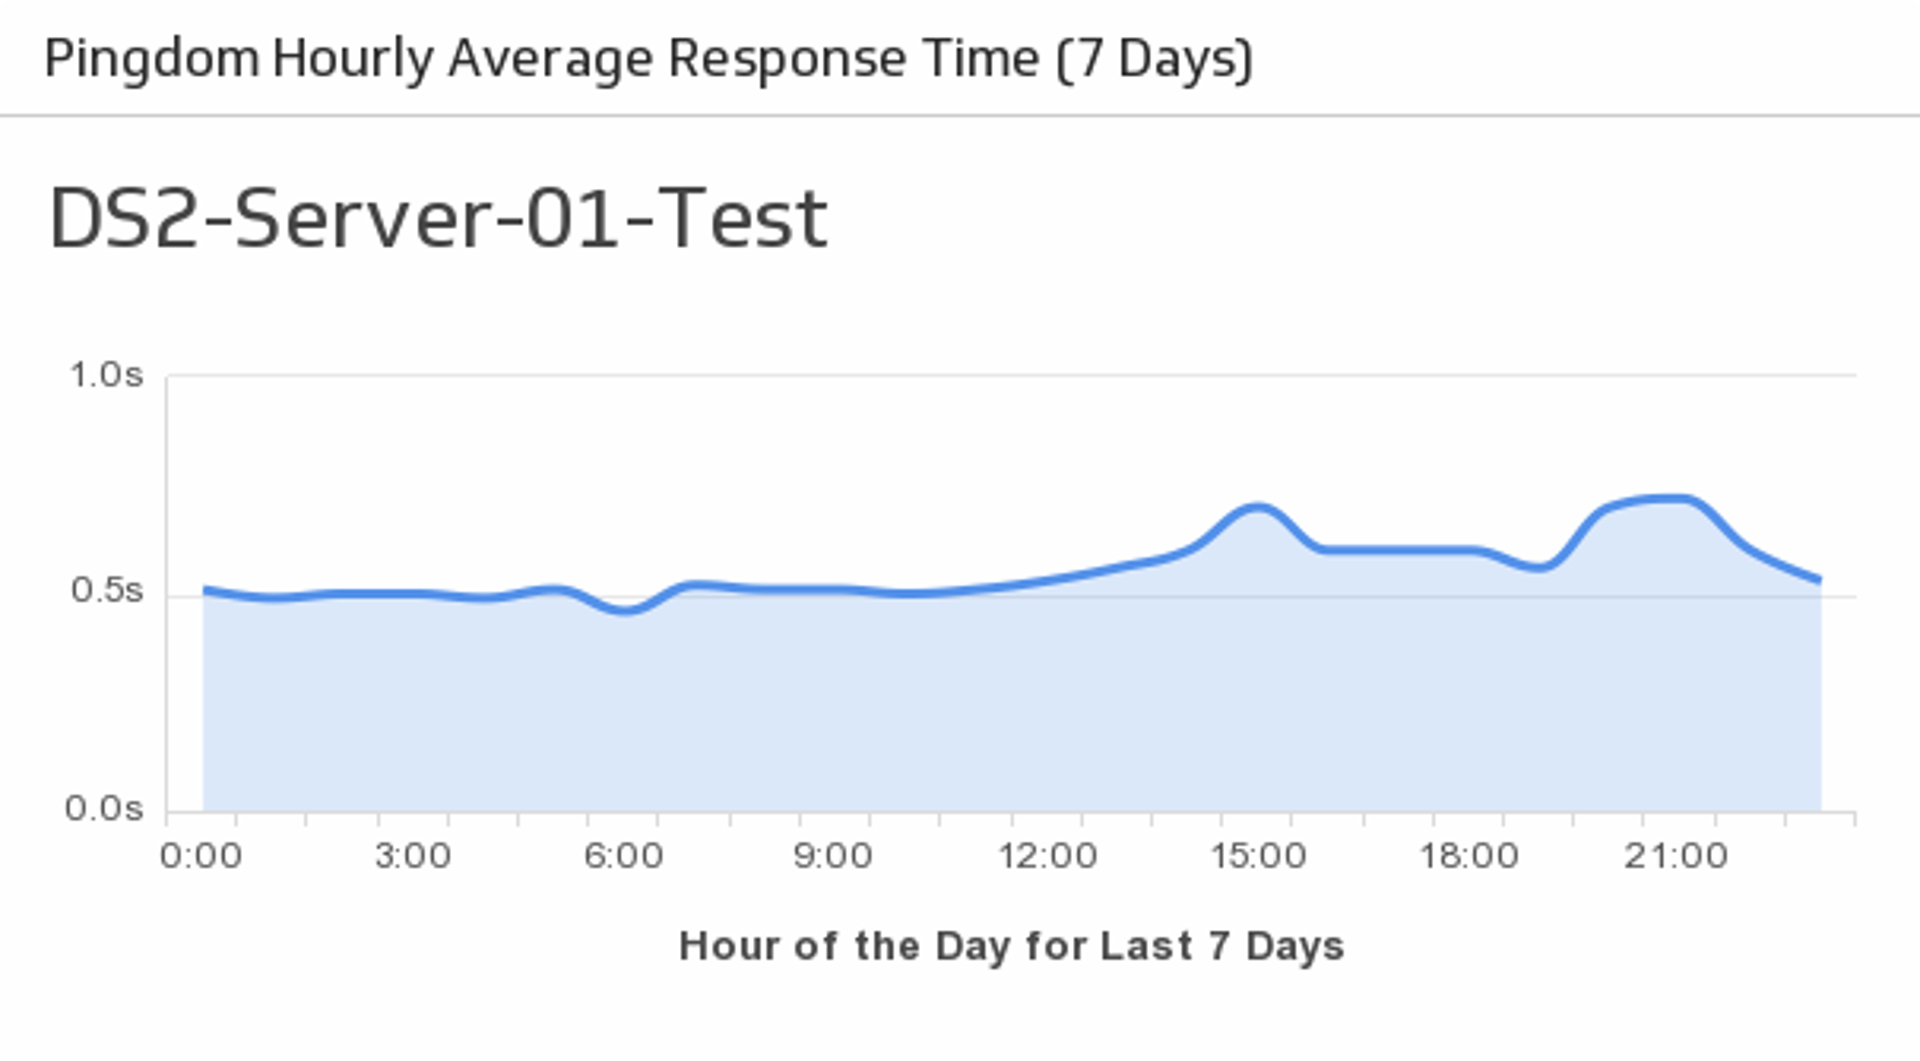
UsesHourly Average Response Time
Monitor the average response times for your specified server over the past week.
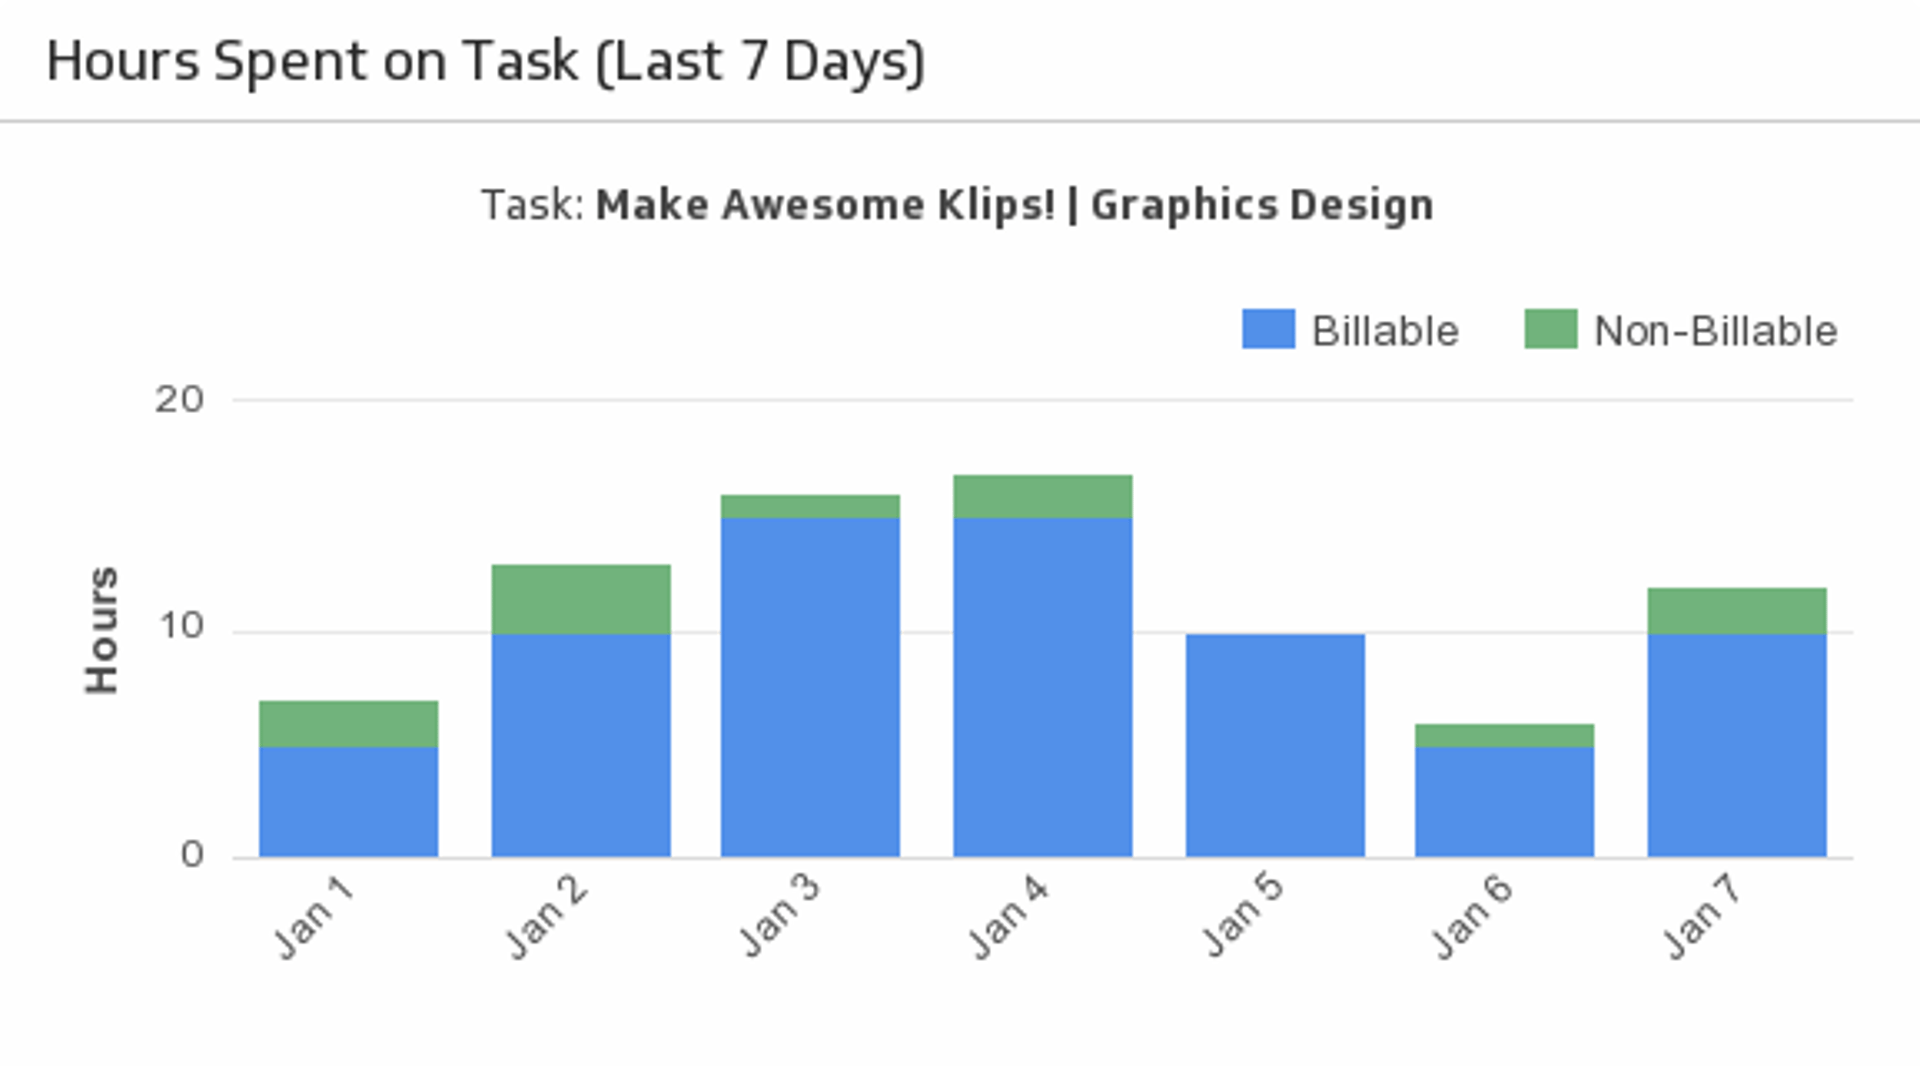
UsesHours Spent on Task (Last 7 Days)
Let this stacked bar chart make it easy to regularly check your project’s billable and non-billable hours.
UsesHubSpot Landing Page Views
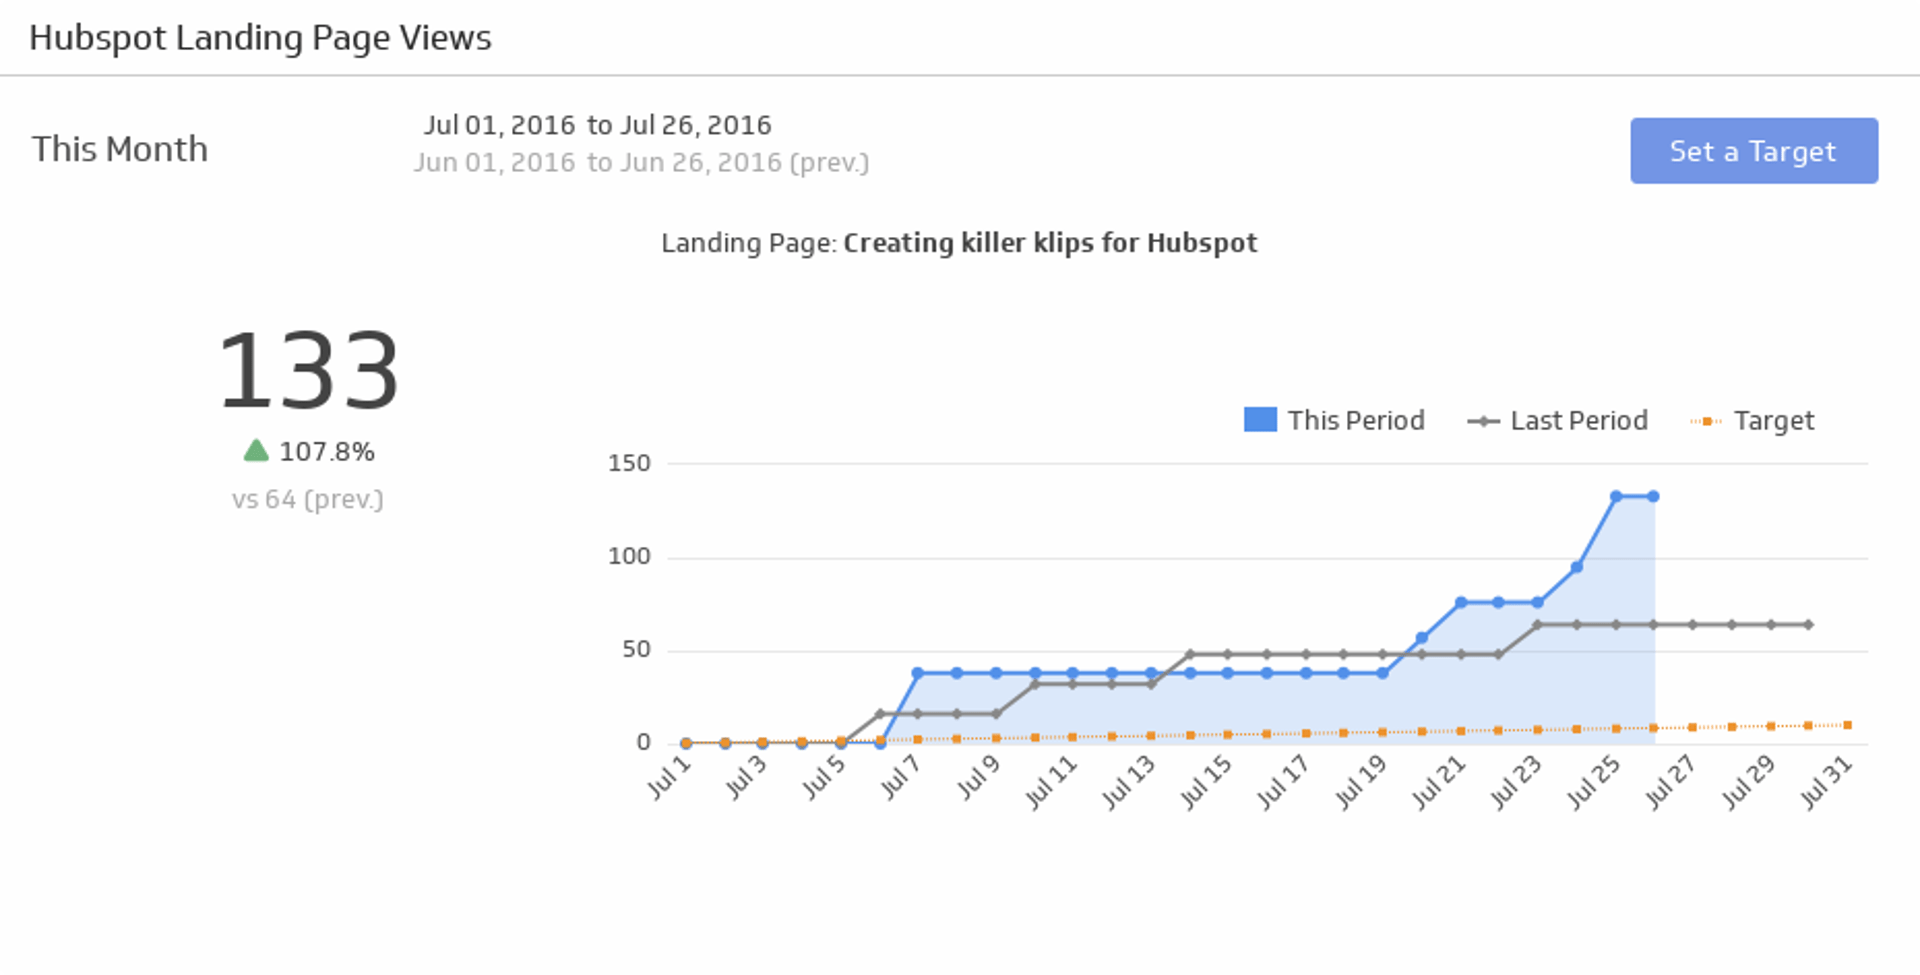
Make sure your website is generating interest by tracking the number of views over the time period of your choice.
UsesImpressions
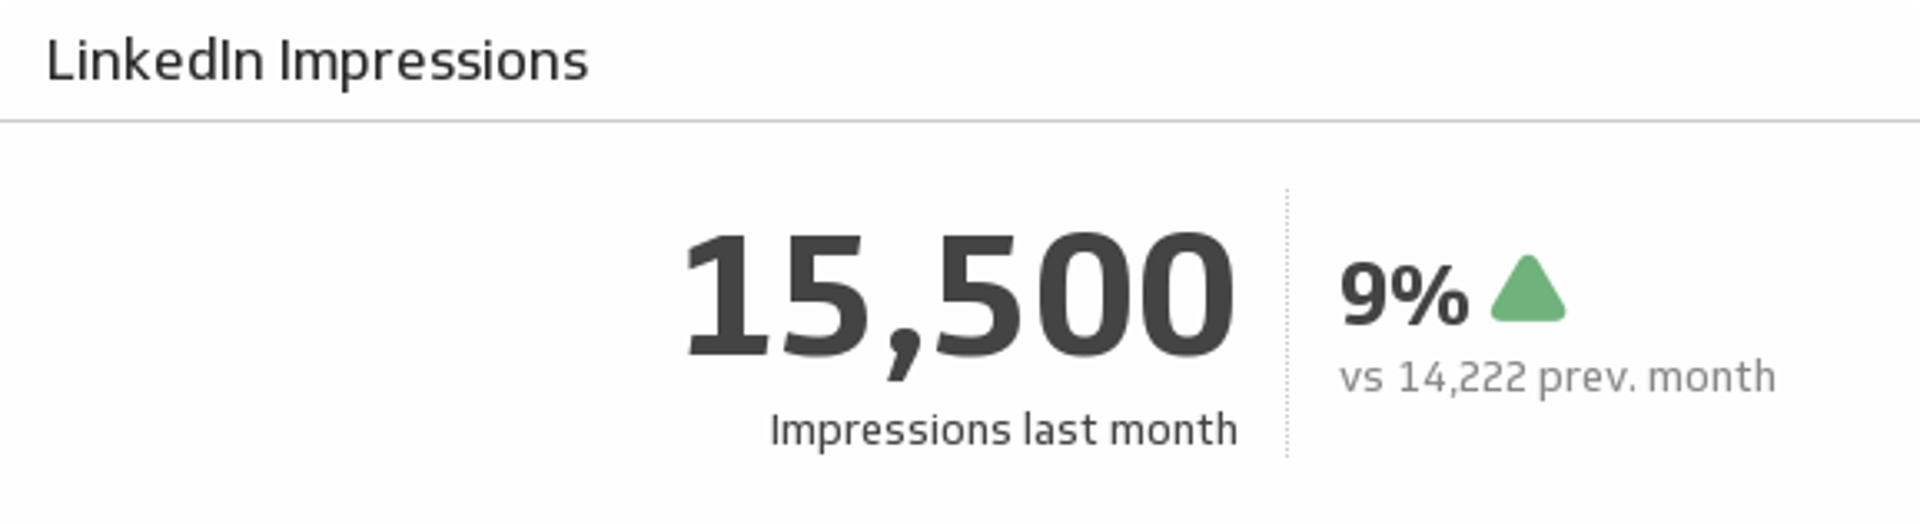
Track your LinkedIn page impressions for last month and understand how it compares to the previous month.
UsesImpressions (Last 12 Months)
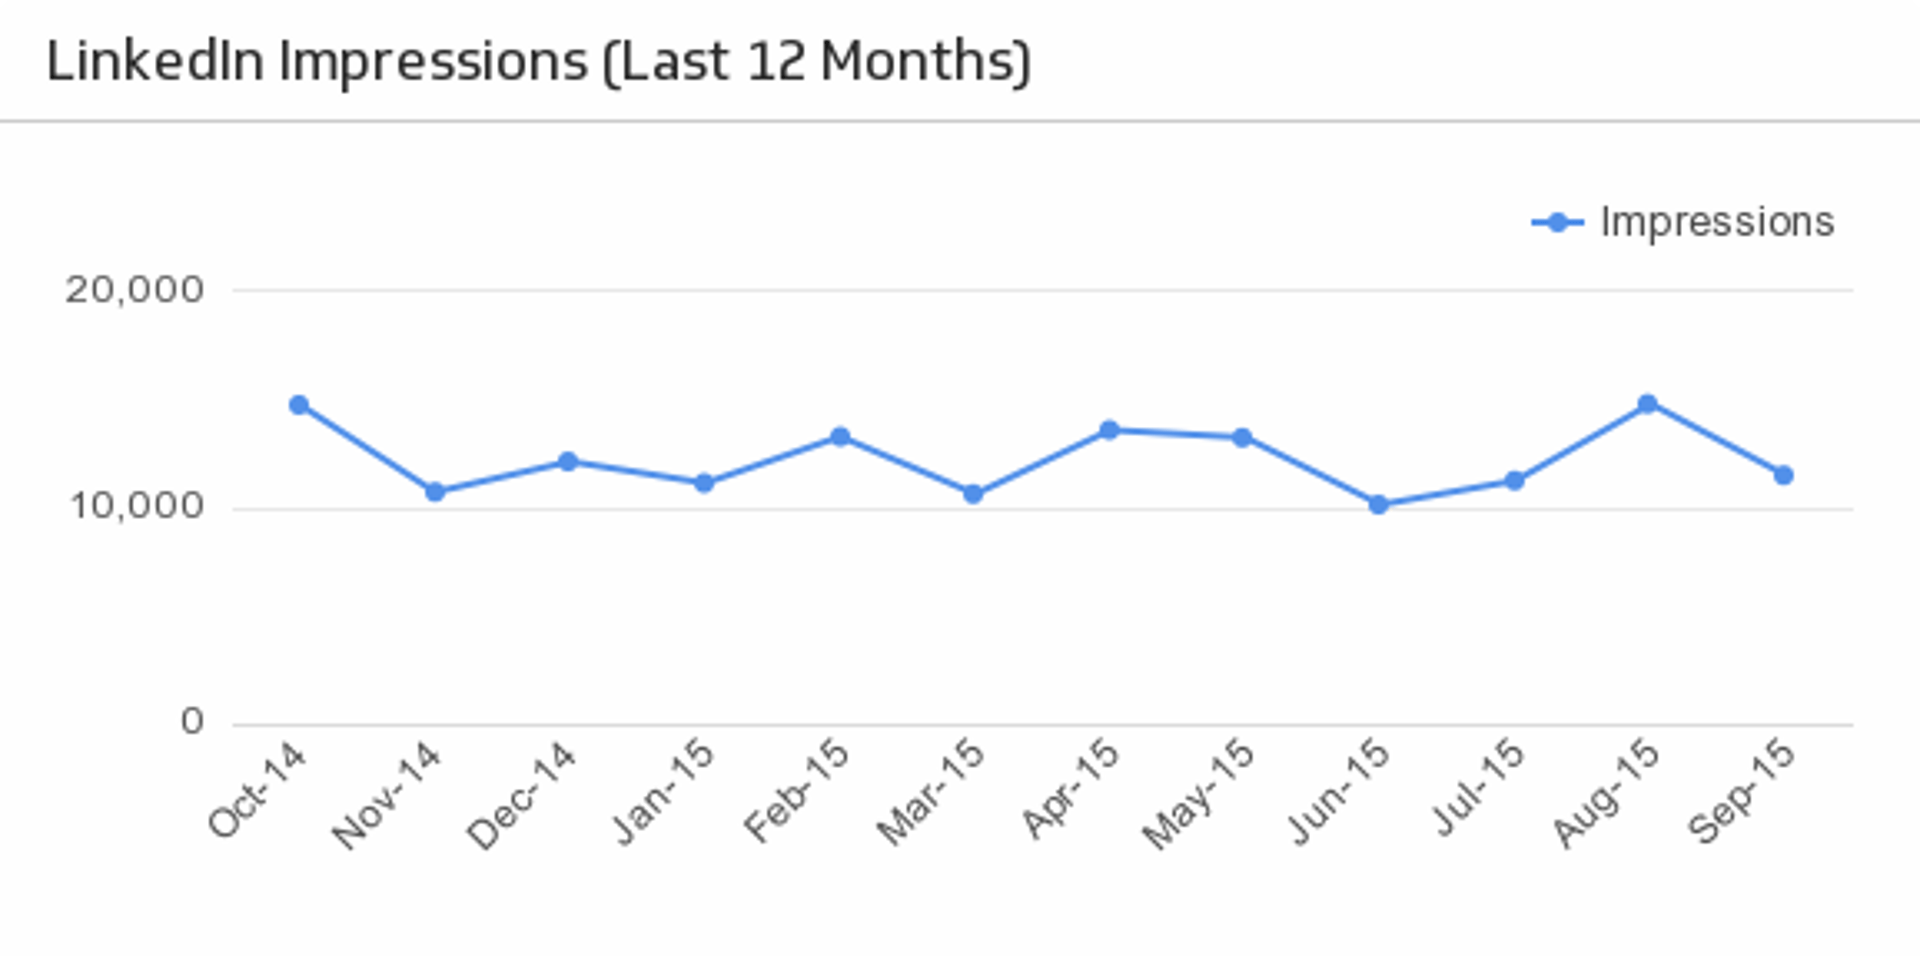
Reveal how your LinkedIn impressions trend over time.
UsesIncome
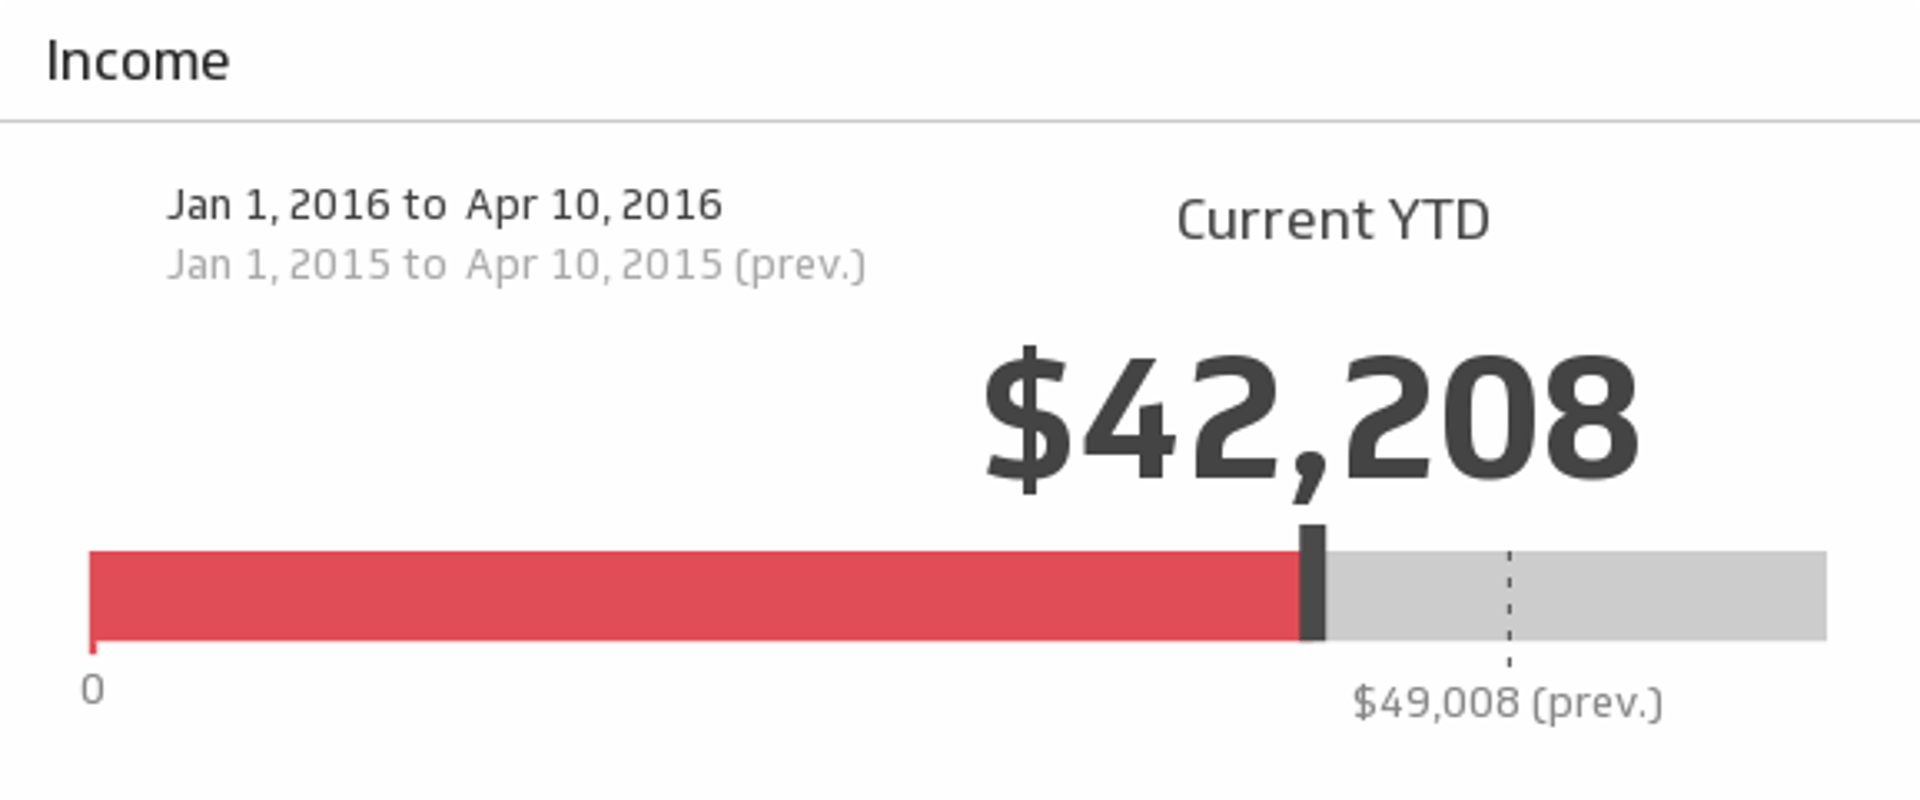
Maintain the financial health of your business with this simple, real-time report on revenue for the time period of your choice.
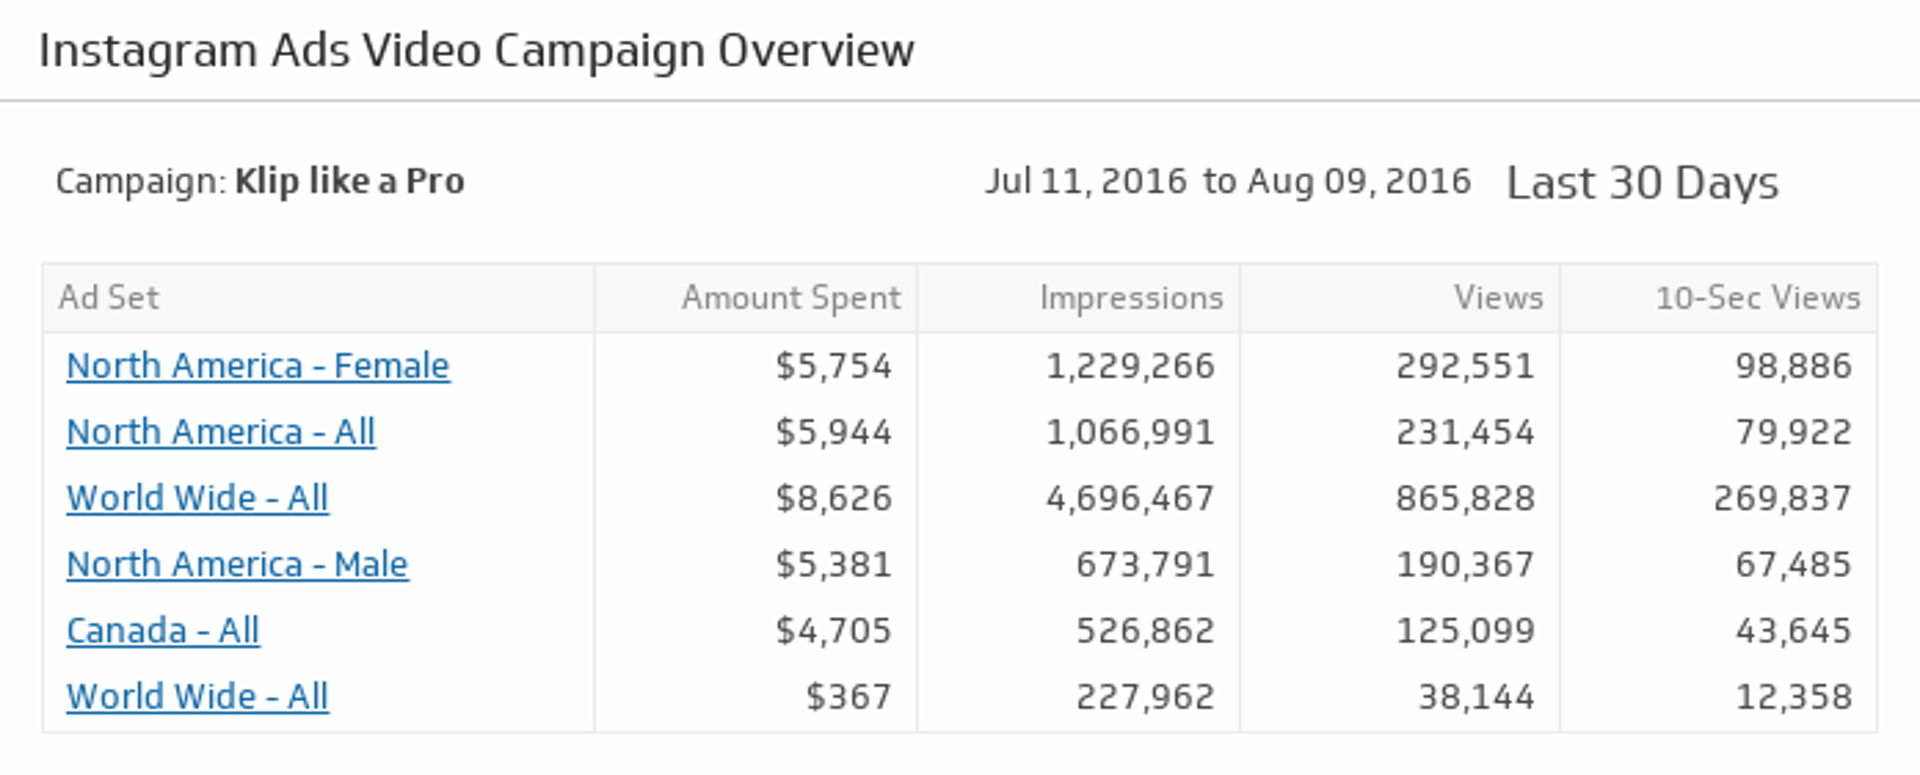
UsesInstagram Ads Video Campaign Overview
Make sure your Instagram Ads are attracting attention. Drill down and get detailed metrics on each video campaign by clicking on an Ad Set name.
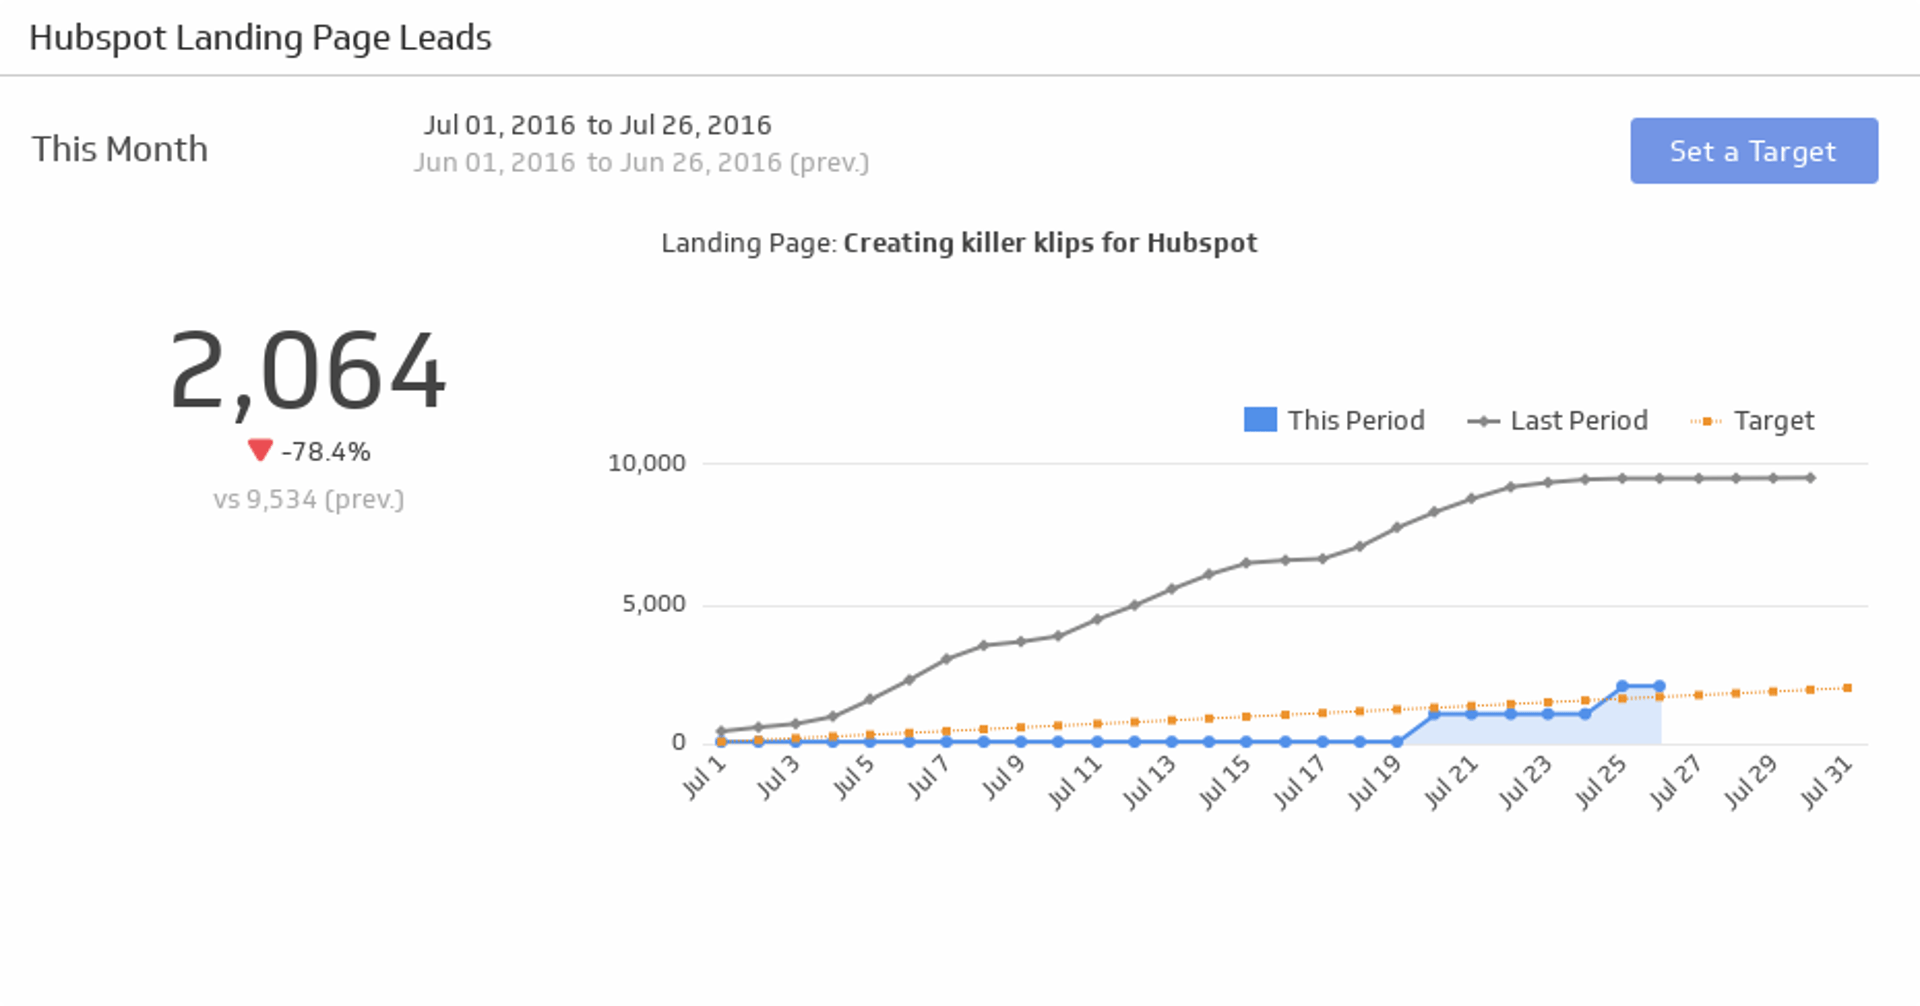
UsesLanding Page Leads
With data as your secret weapon, turn your landing page in to a lead-generation powerhouse.
UsesLanding Page Stats (This Month)
A quick and easy report on the status of a landing page, featuring a list of key landing page metrics for this month.
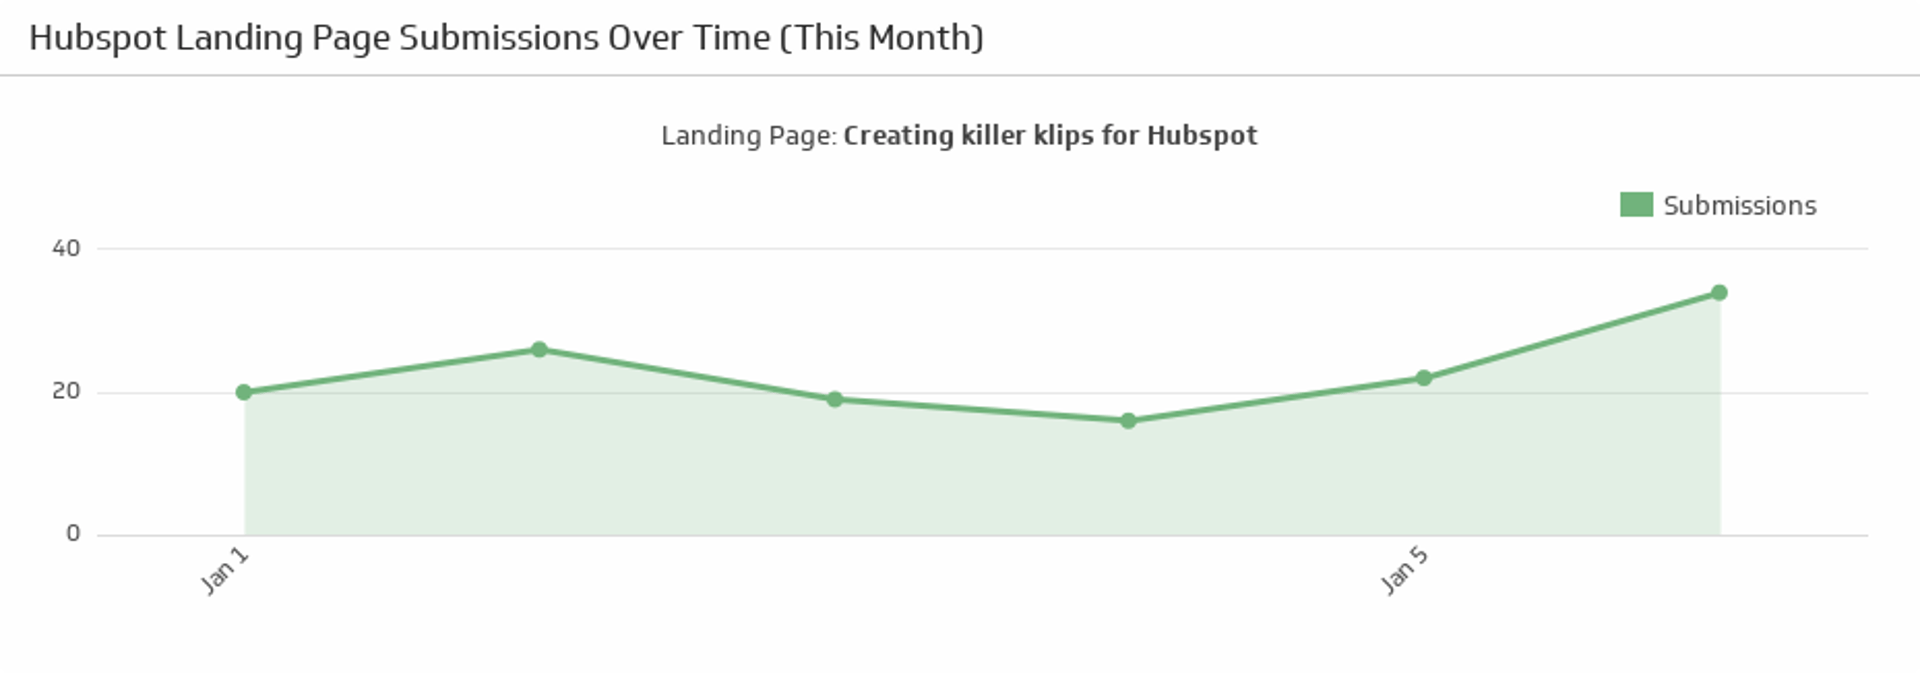
UsesLanding Page Submissions Over Time (This Month)
Track submissions on your chosen landing page this month.
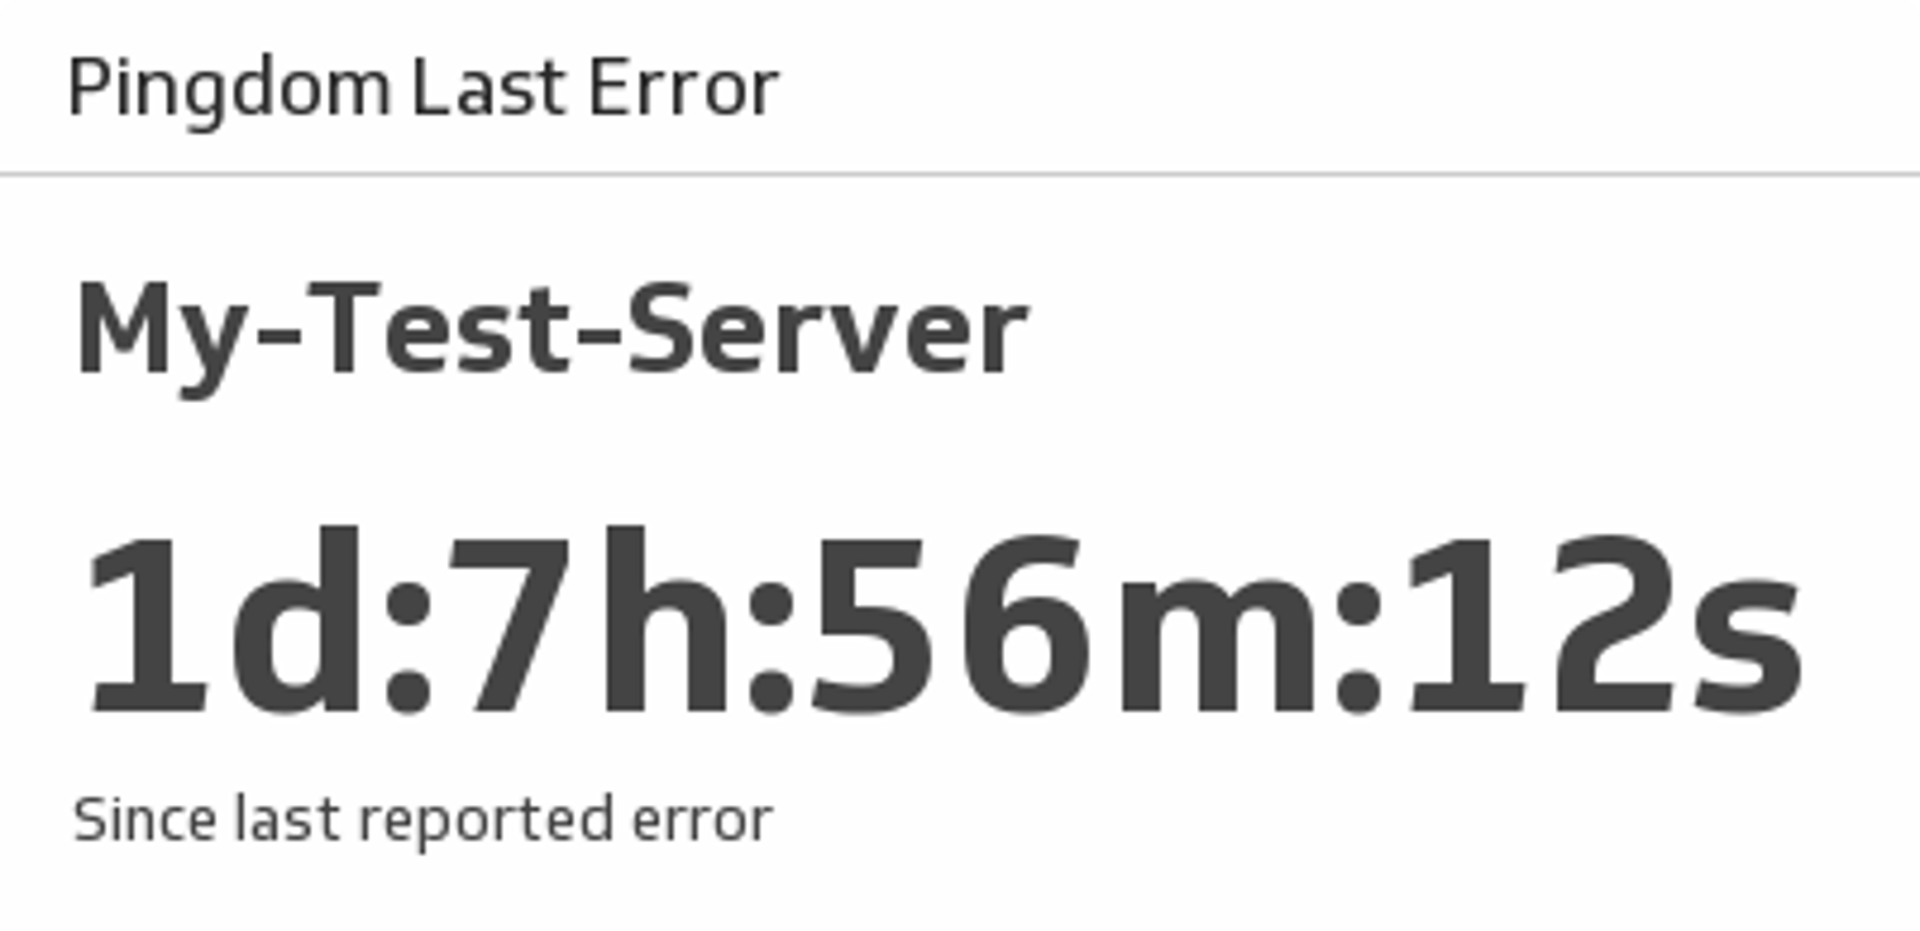
UsesLast Error
See the amount of time that has passed since your last Pingdom error.
UsesLead Lifecycle
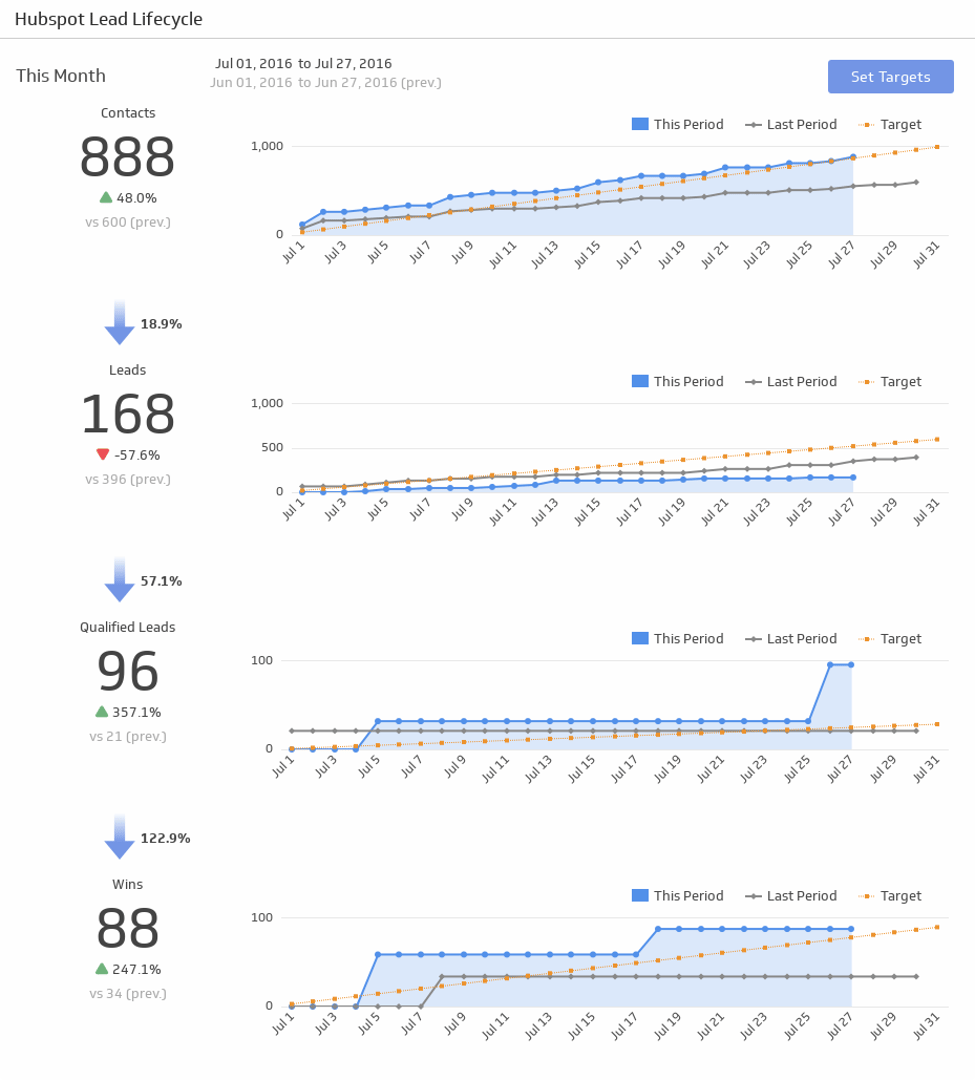
Take your marketing funnel to the next level! This is a complete lead lifecycle funnel with total numbers at each stage, with visualizations of your progress.
UsesLeads
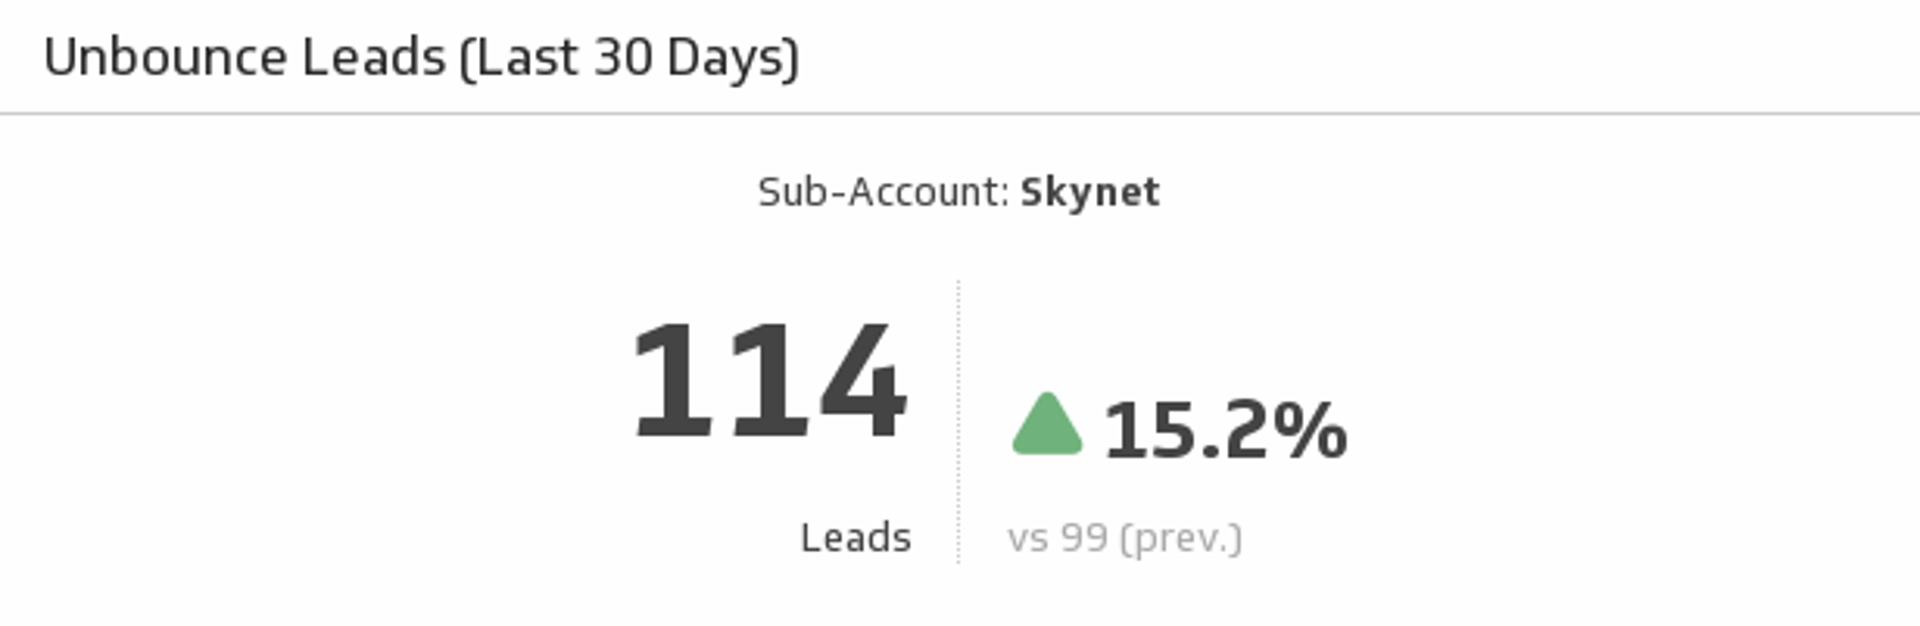
Track the number leads you have gained over the past 30 days and compare to the previous 30 days.
UsesLeads by Source
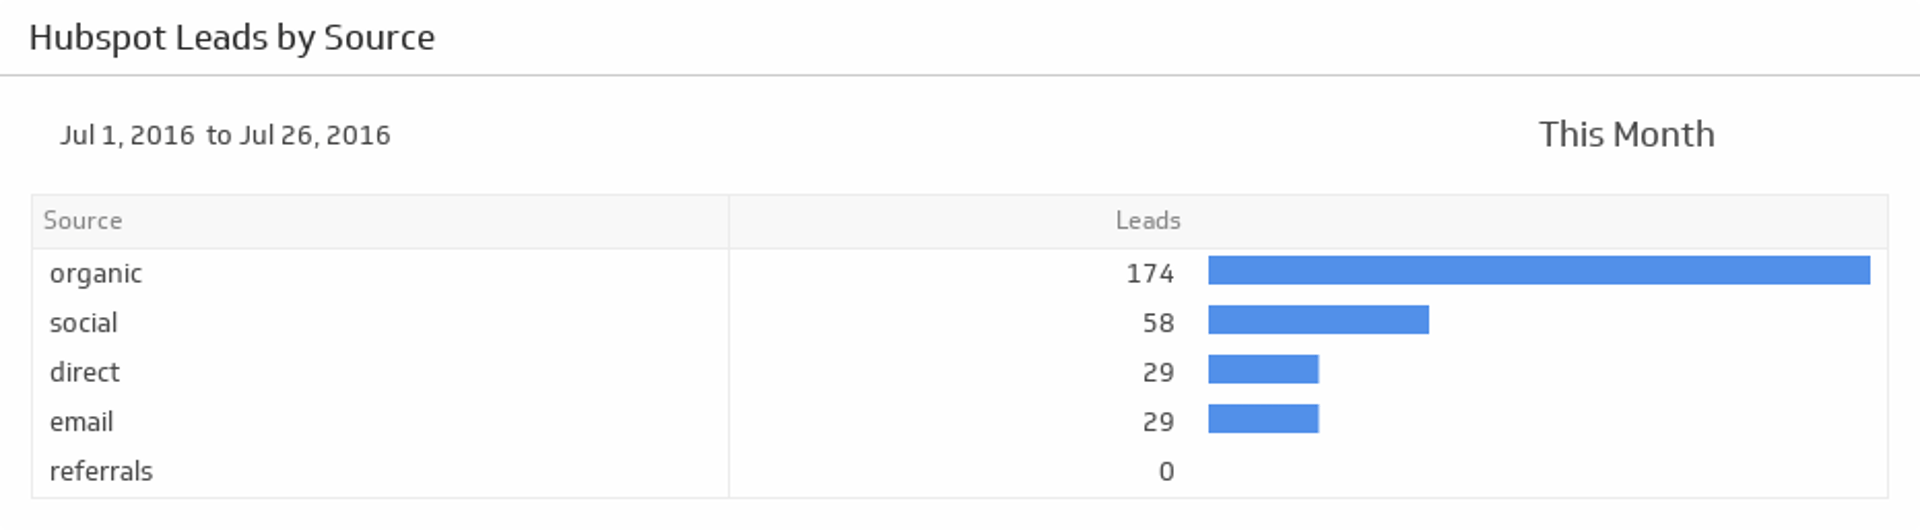
Segment your leads by source and discover which sources are bringing in the most and the least leads during the time period of your choice.
Uses