Net Income Ratio
Measures the percentage of total revenue that remains as net income after all expenses, showing how efficiently a company converts sales into profit.
Net Income Ratio
Net Income Ratio measures the percentage of revenue that becomes profit. It shows how efficiently a company converts sales into earnings.
What is Net Income Ratio?
Net Income Ratio is the percentage of total revenue that remains as net income after all expenses. A higher ratio means the company keeps more profit from each dollar earned.
This KPI supports internal profitability tracking and competitive benchmarking when industry data is available. Insurance companies frequently use it to evaluate pricing policy effectiveness.
Net Income Ratio formula
Net Income Ratio = (Net Income / Total Revenue) × 100
The result is expressed as a percentage. If a company earns $500,000 in net income on $2,000,000 in total revenue, its Net Income Ratio is 25%. That means 25 cents of every dollar in revenue becomes profit.
Why Net Income Ratio matters
Net Income Ratio tells you whether revenue growth is translating into actual profit. A company can grow its top line while margins erode, and this ratio surfaces that problem early.
It answers a question every leader needs answered: are we actually making money, or just making sales?
Leaders use Net Income Ratio to:
- Assess pricing strategy: A declining ratio may signal that premiums or prices are too low relative to costs
- Benchmark performance: When industry data is available, the ratio shows where you stand against competitors
- Guide expense decisions: A low ratio points to cost pressure that may require an operational review
- Build confidence in the numbers: Consistent tracking means you're not guessing when someone asks how profitable the business is
What is a good Net Income Ratio?
A healthy Net Income Ratio varies by industry. In insurance, underwriting margins are typically thin, so a ratio in the 5–10% range can indicate solid performance. In software or professional services, ratios above 20% are more common.
The most useful comparison is against your own historical trend and, where available, published industry benchmarks.
How to track Net Income Ratio
Net Income Ratio is most useful when tracked over time, not as a single snapshot. Monthly or quarterly monitoring lets you catch margin compression before it becomes a structural problem.
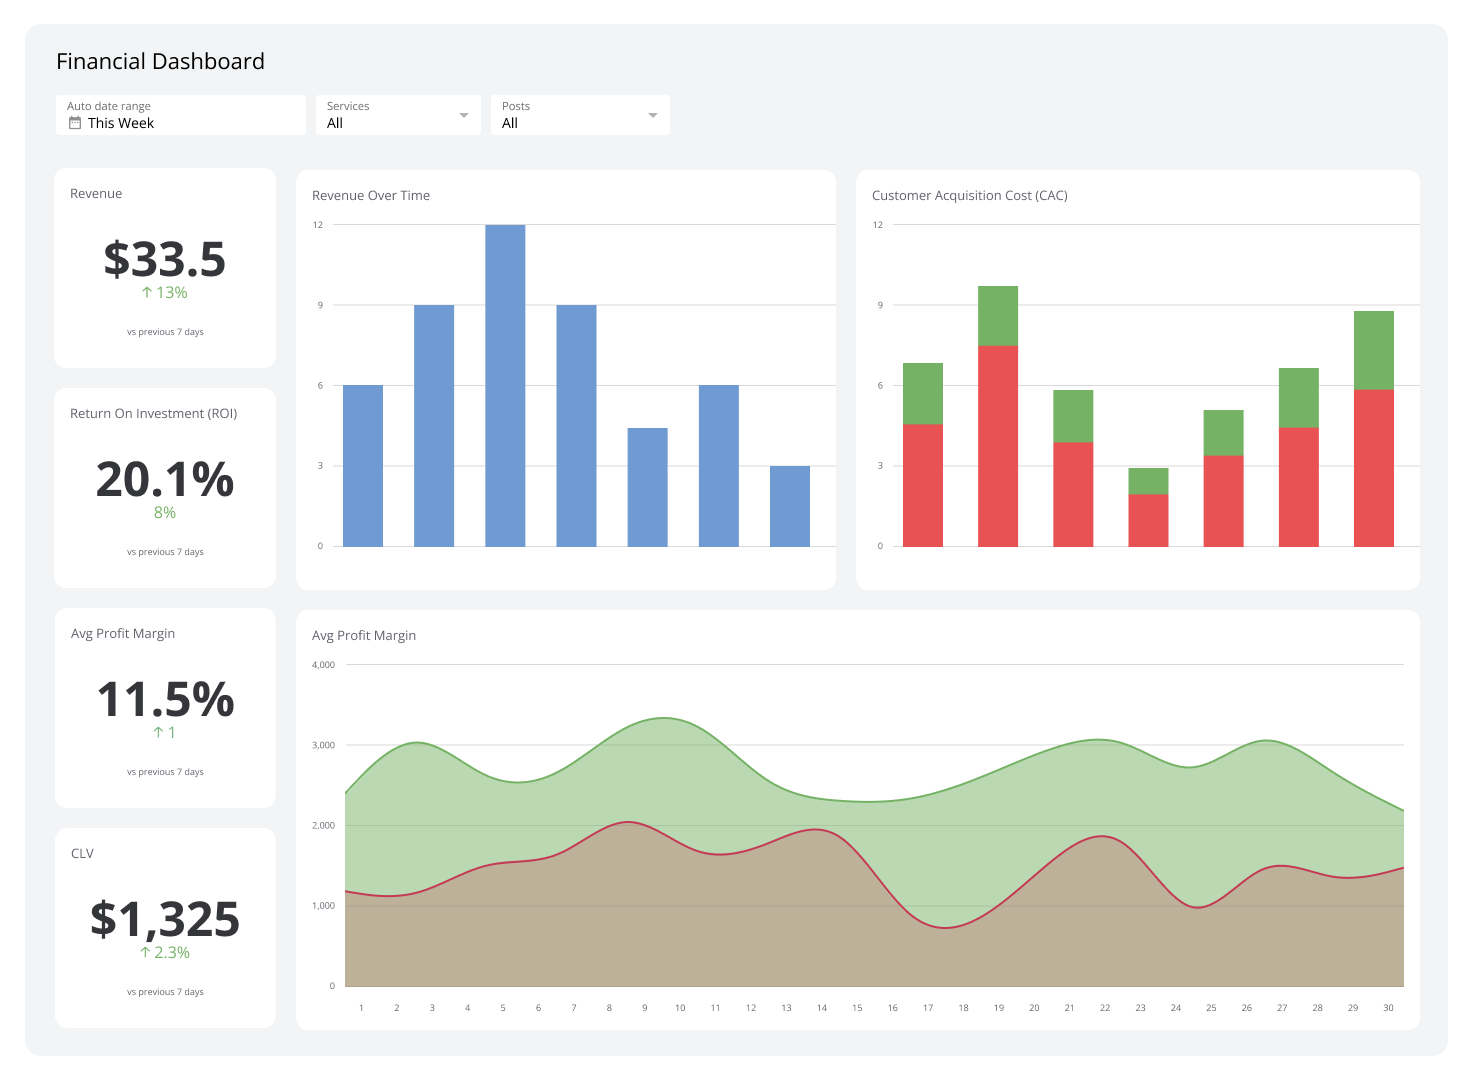
The goal is to know your margin without having to ask someone to pull a report. A real-time dashboard connected to your financial data makes that possible. You can set threshold alerts, visualize trends alongside related metrics like Gross Profit Margin and Operating Expense Ratio, and share results with leadership without manual reporting.
See also: Financial KPIs and Ratios