Social Shares
Measure the total number of times your content has been shared across social media platforms.
Social Shares by platform
| Platform | Shares | Change |
|---|---|---|
| 2,371 | +8.2% | |
| 1,694 | +3.1% | |
| 932 | -2.4% | |
| YouTube | 261 | +12.5% |
| Total | 5,258 | +5.1% |
What are Social Shares?
Social Shares measure the total number of times your content has been shared across social media platforms. A high share count signals that your audience finds your content worth passing on, which extends your reach beyond your own followers organically.
Why Social Shares matter
Every share puts your content in front of a new audience without any additional spend. When one person shares your post, it appears in the feeds of all their followers. That compounding effect means a single well-timed piece of content can reach thousands of people you never directly targeted.
For a marketing leader, Social Shares answer a practical question: is this content resonating, or is it disappearing into the feed? You don't need to dig through platform analytics to get that answer. A dashboard that tracks Social Shares over time tells you what's landing, what isn't, and where to focus next.
Social Shares also serve as a leading indicator for brand awareness. Rising share counts often precede spikes in web traffic, follower growth, and inbound leads, giving you an early signal before those downstream numbers move.
How to calculate Social Shares
The formula is straightforward:
Social Shares = Total number of shares across all platforms
Aggregate shares from every channel you publish on: LinkedIn, Instagram, Facebook, X (platform), and any others relevant to your audience. Tracking platform by platform lets you see which channels amplify your content most effectively.
Reporting frequency and targets
Reporting frequency: Weekly
Example target: 82 shares per week
Weekly reporting gives you enough data to spot trends without reacting to single-day noise. Set a baseline from your historical average, then track whether new content formats, topics, or posting times move the number.
What affects your Social Shares count
Several factors influence how often content gets shared:
Content format: Video and infographics typically earn more shares than text-only posts
Timing: Posts published when your audience is most active get more initial visibility, which drives more shares
Relevance: Content tied to a trending topic or a specific audience pain point travels further
Ease of sharing: Reducing friction, like adding share buttons to blog posts, increases the likelihood someone passes your content along
Create custom dashboards for you and your team.
Get started with KlipsSocial Shares in context
Social Shares is one metric in a broader set of content engagement KPIs. Track it alongside Likes, Comments, Follower Growth, and Social Visitors Conversion Rate to get a complete picture of how your social content performs. Shares tell you reach; conversion rate tells you whether that reach is turning into action.
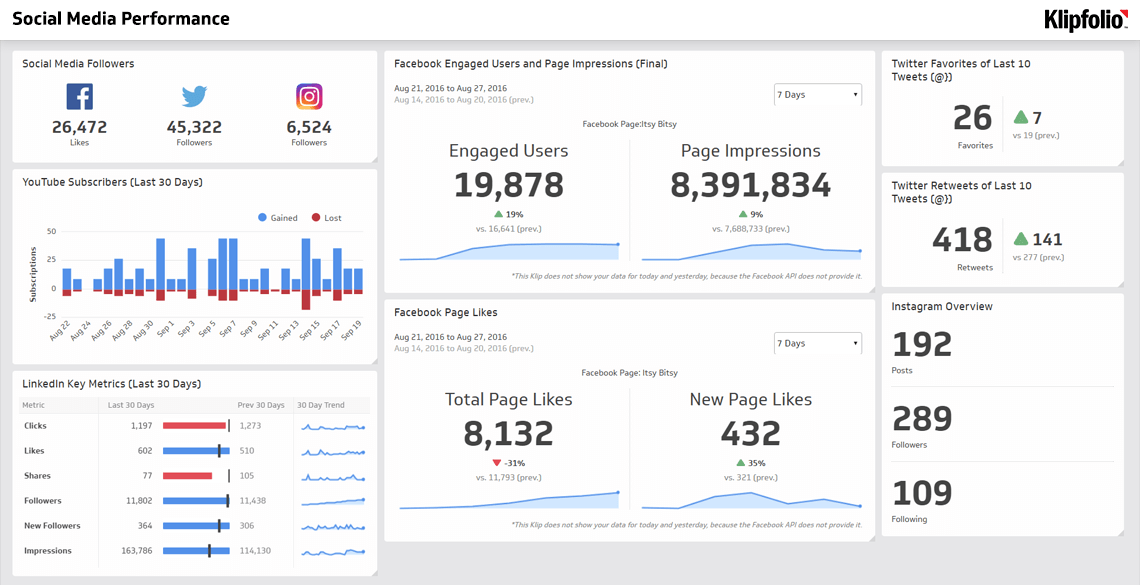
A social media dashboard brings all of these metrics together in one view, so you're not pasting numbers from five different platforms into a spreadsheet or explaining your business context to a generic AI tool every time you want a quick read on performance. You see what's working, consistently, without having to chase it down.
For more KPI examples and templates, explore the full library.
KPI details
| Field | Detail |
|---|---|
| Formula | Total number of shares of your content |
| Reporting frequency | Weekly |
| Example target | 82 shares |
| Audience | Social Media Manager, Marketing Manager |
| Variations | Social media shares |