

Klips AI is here
Klips AI is a Chrome extension that puts an AI assistant inside Klipfolio Klips — in a sidebar or a floating window, on every page. Ask what a dashboard is telling you, explore your data, or describe a Klip and watch it get built.
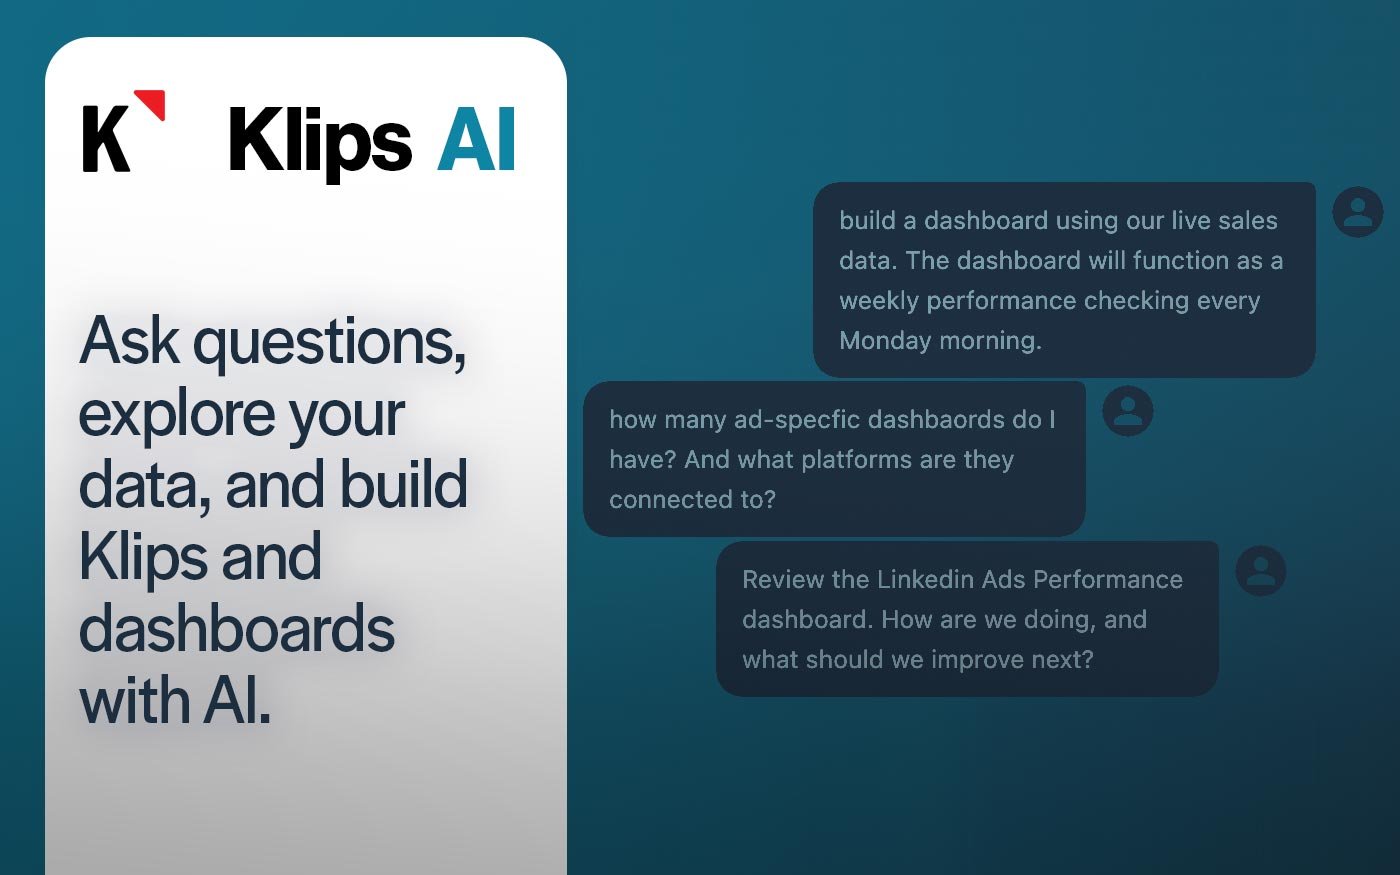
Four things it does
Klips AI opens where you already are. It knows your account — your dashboards, your Klips, your data sources — so you can ask in plain language instead of hunting through menus.
- Explore your data. List your data sources and see what's in them.
- Summarize dashboards. Get a read on what a dashboard shows and what it measures.
- Understand your Klips. Ask what a visualization means, and dig into the patterns, trends, and comparisons behind it.
- Build new Klips. Describe what you want and it generates and creates it.
Ask a dashboard what it's telling you
A dashboard shows you the numbers. It doesn't tell you which ones matter this week.
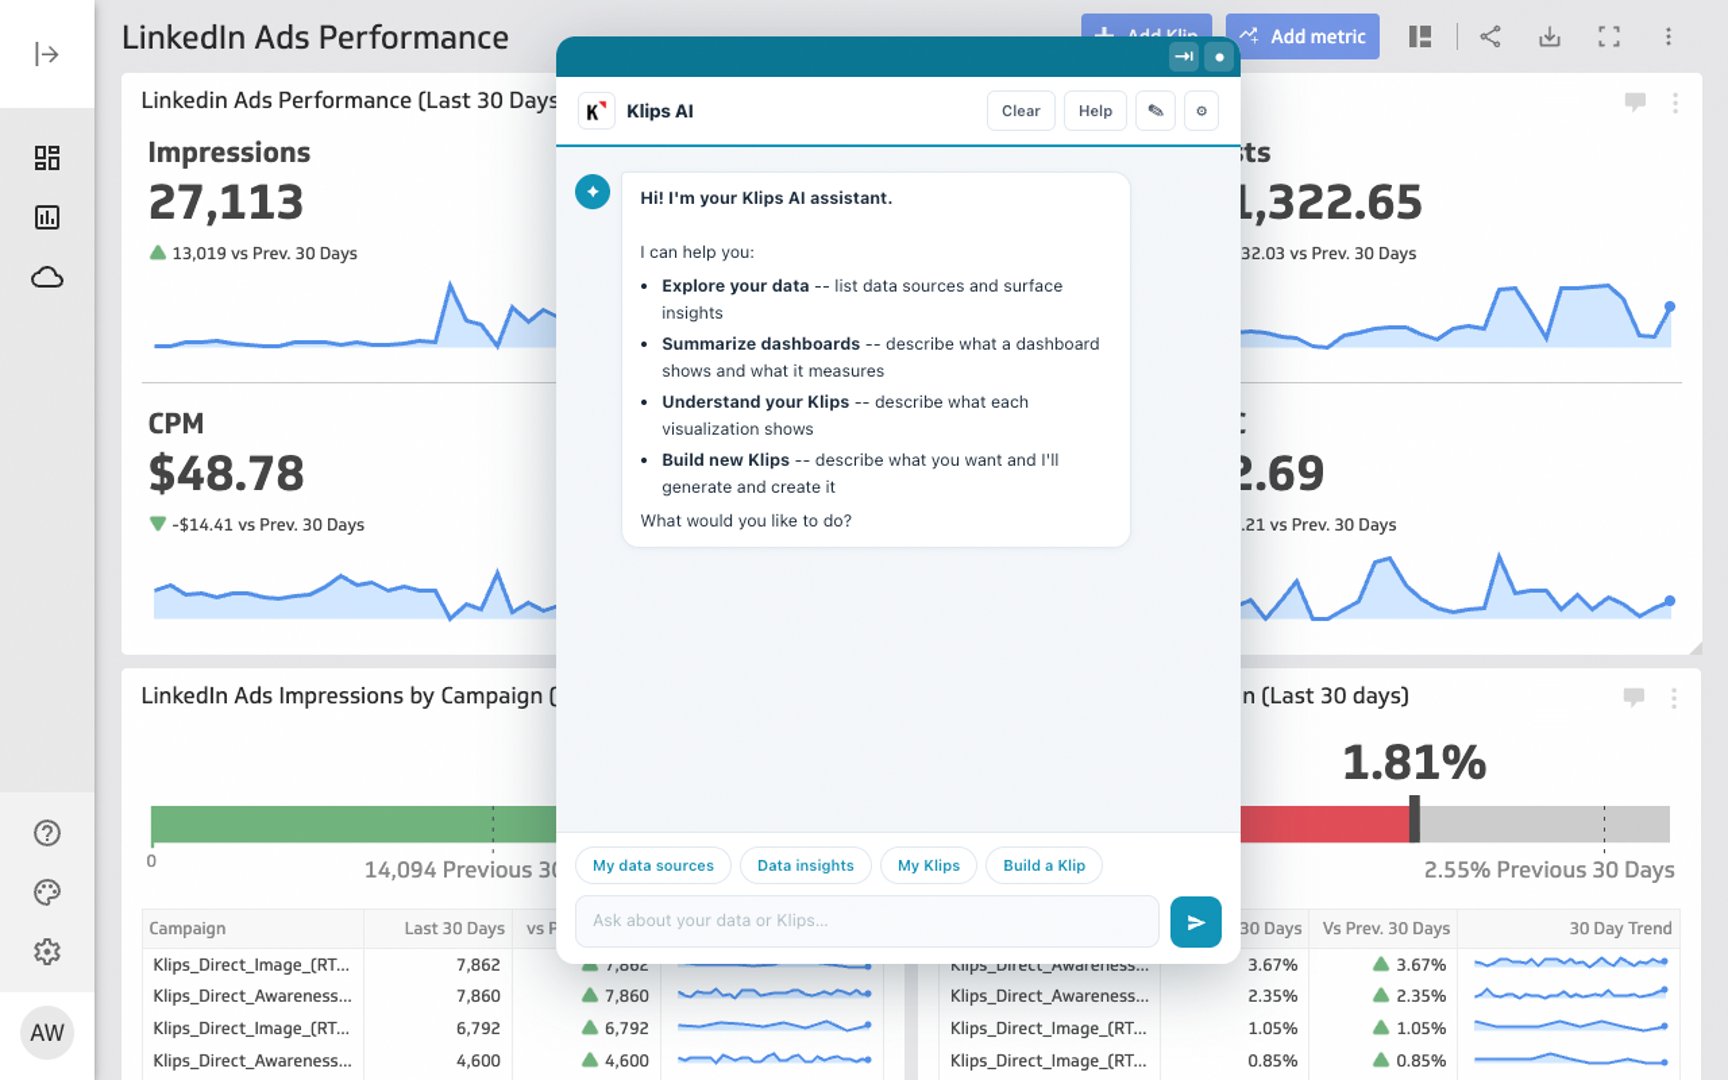
Here's a real question on a LinkedIn Ads dashboard: how are we doing, and what should we improve next? Klips AI read the Klips on the page and came back with the shape of the last 30 days — impressions up 92%, clicks up 41%, spend up 49%, and CTR down from 2.48% to 1.81%. Then the part that's actually useful: reach scaled, engagement weakened, so go fix CTR before you add more budget.
It also noticed what wasn't there. The dashboard tracks reach and clicks but no leads or pipeline, so it suggested adding conversion metrics. That's the kind of gap you stop seeing after you've looked at the same dashboard fifty times.
Describe a dashboard, get a dashboard
This is the part I didn't expect to work as well as it does.
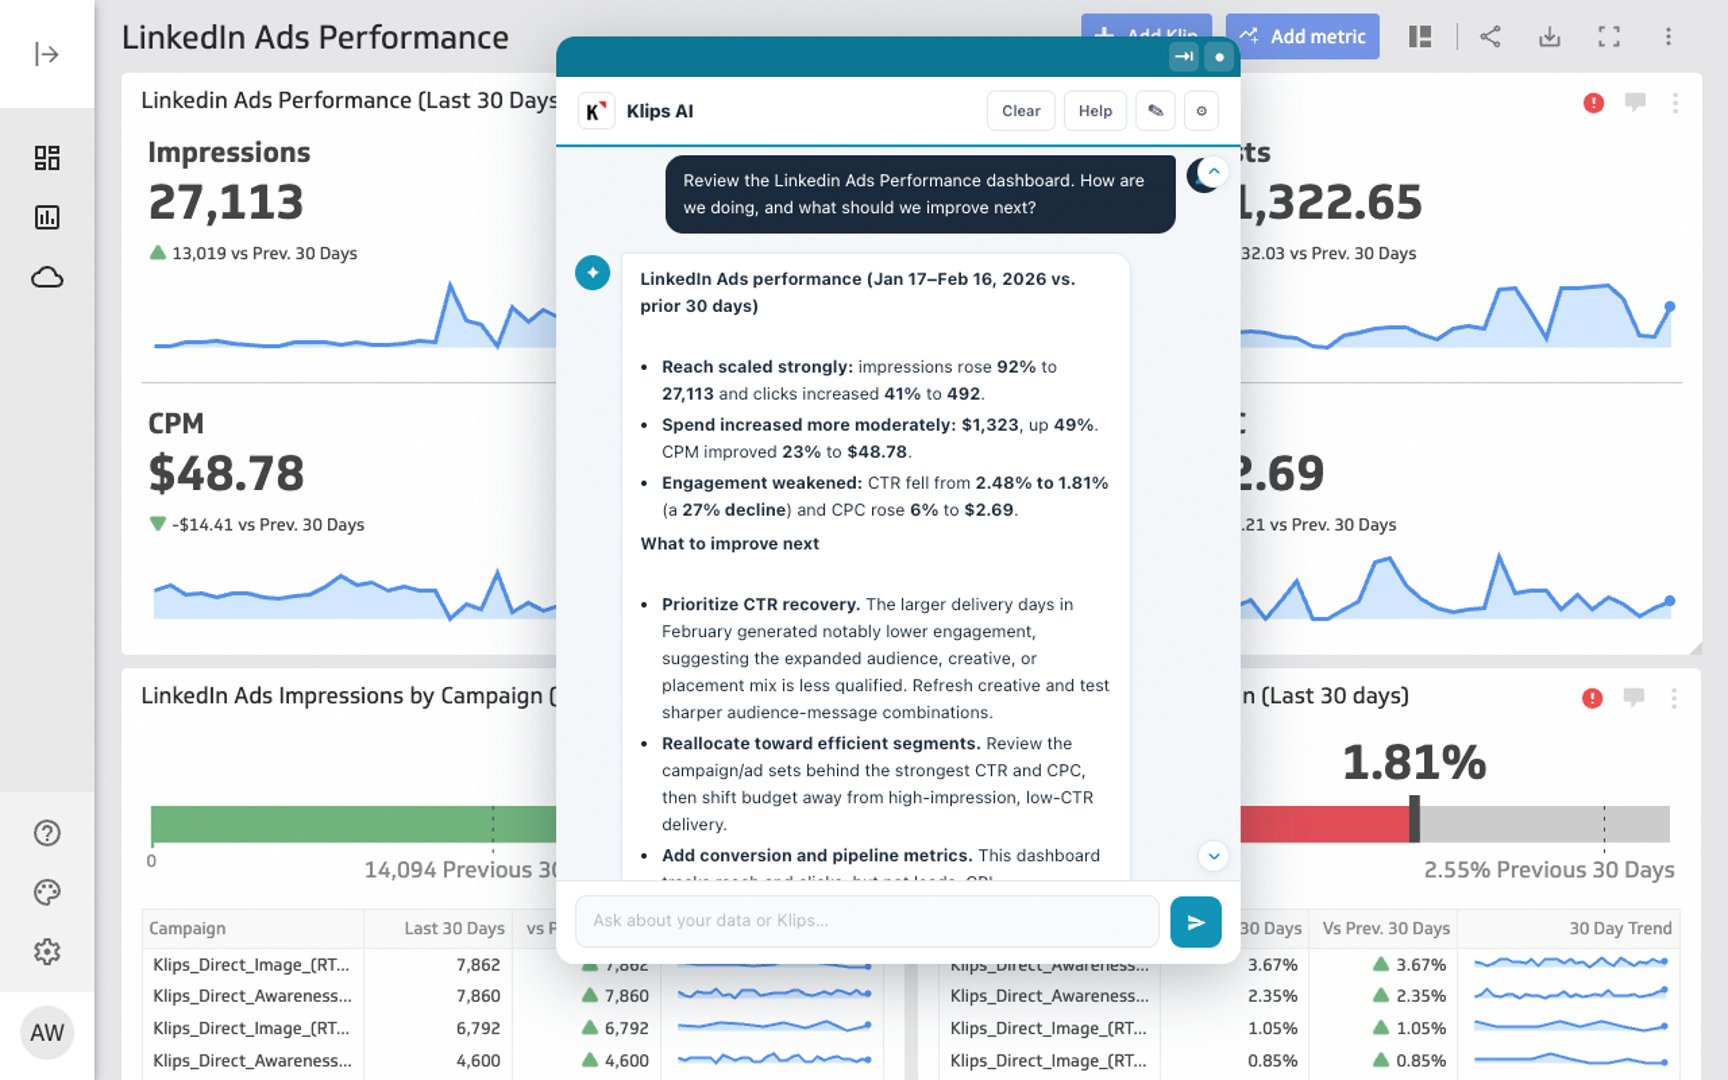
The ask was loose: build a dashboard using our live sales data, something to check performance every Monday morning. No metric list, no chart types, no field names.
Klips AI asked one clarifying question — which sales source? — and proposed what a Monday-morning review should actually contain: weekly revenue against target, week-over-week change, pipeline created, closed-won deals, conversion rate, top reps, and top deals at risk. Pick the data source, and it builds it.
That's the gap it closes. Plenty of people know what they want to see on Monday morning. Far fewer want to spend an afternoon in a Klip editor assembling it.
It knows your account, not just your data
If you run Klips for a team or for clients, you know the questions that have no good answer short of clicking through everything. Which dashboards are actually in use? Who hasn't logged in? What's connected to what?
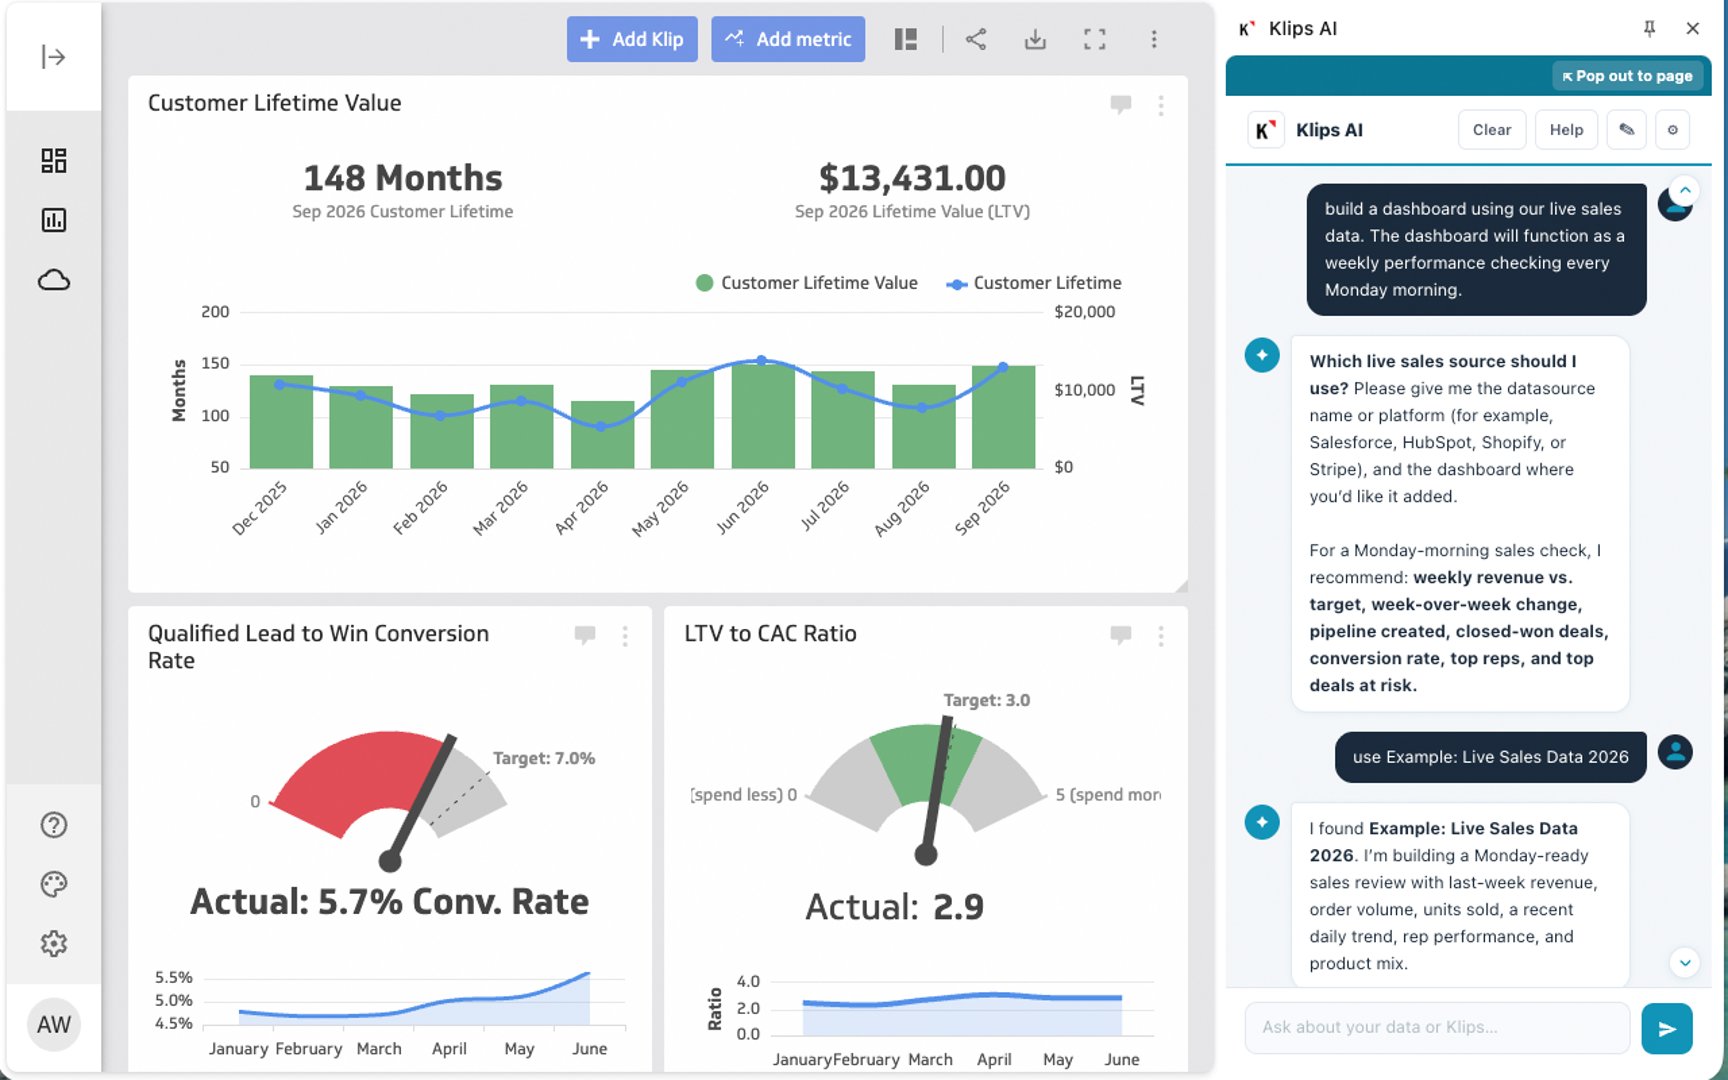
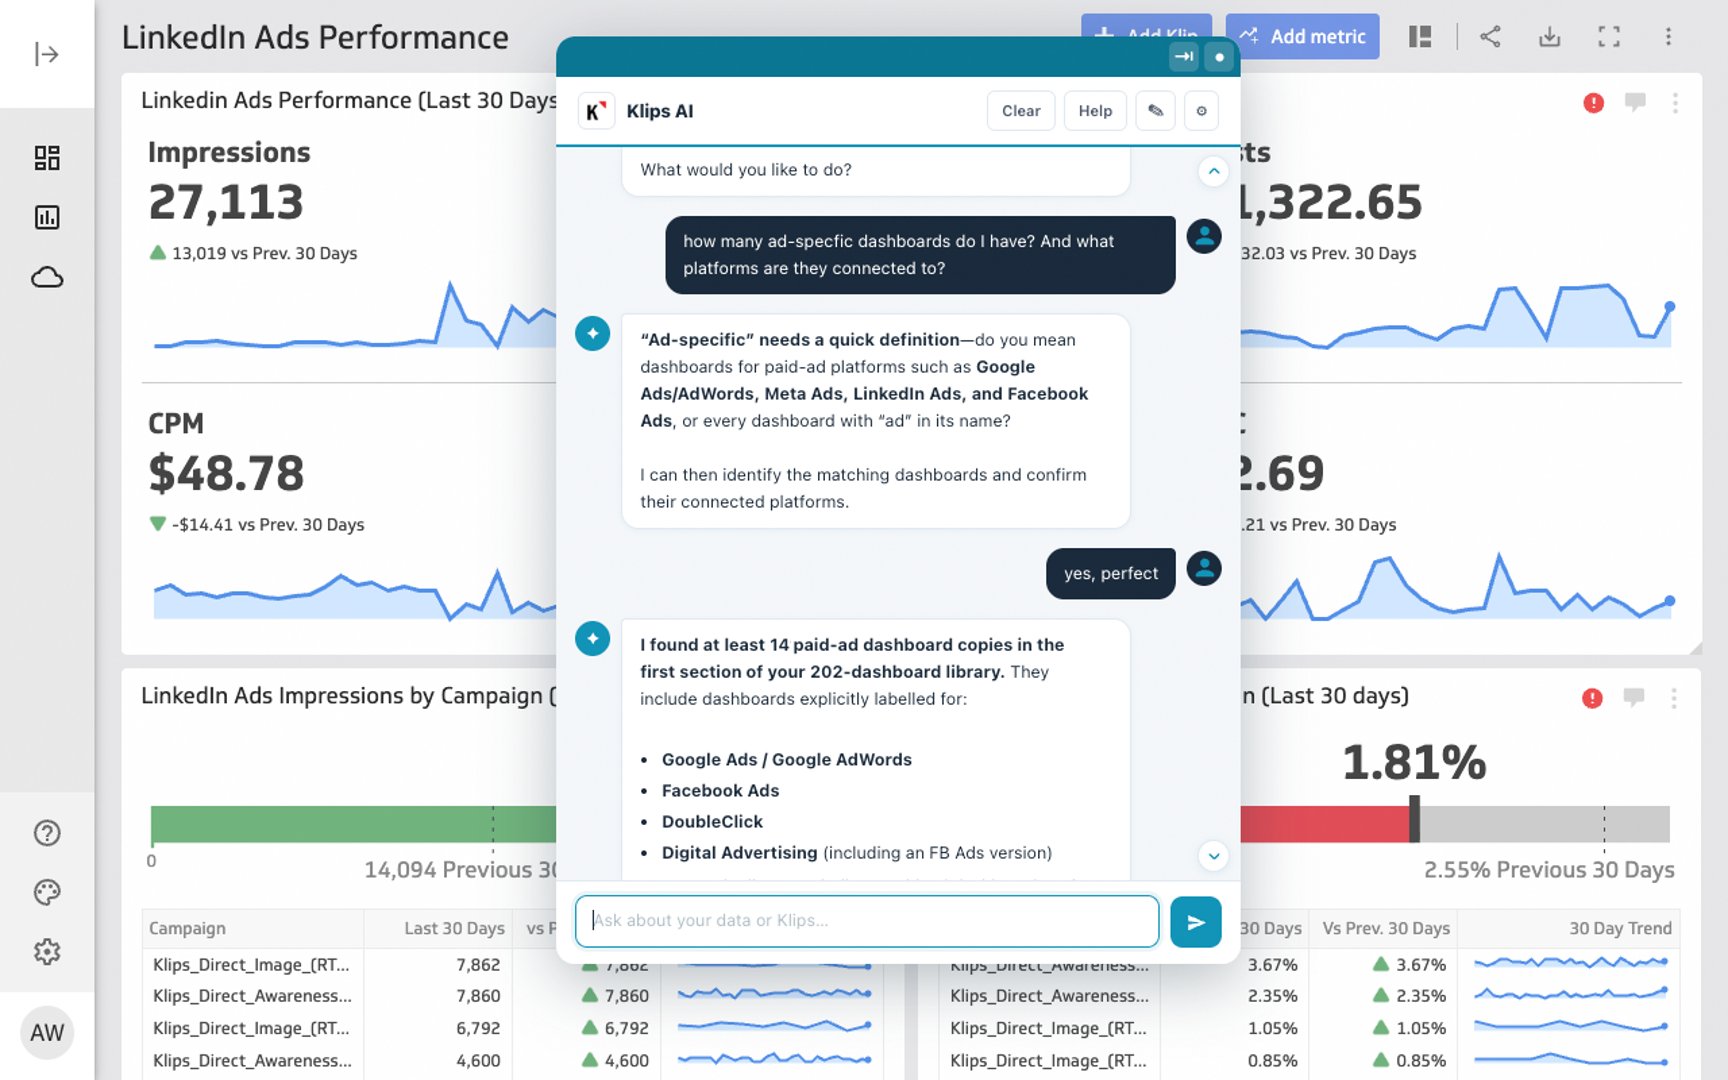
Asked how many ad-specific dashboards were in one account, Klips AI did the sensible thing first and checked what was meant — paid-ad platforms, or anything with "ad" in the name? Then it worked through a 202-dashboard library and came back with the matches and the platforms behind them.
For agencies and partners managing dozens of client accounts, this is the quiet win. Account housekeeping stops being an afternoon.
Getting started
Install it from the Chrome Web Store, connect your Klipfolio account through OAuth, and pick a model.
You'll need two keys: a Klips API key on your Klipfolio account, and a key for whichever AI provider you choose. There are six models across Anthropic and OpenAI, with Claude Sonnet 5 as the default.
Bringing your own key is deliberate. Your spend stays under your control, and you're not locked into whichever model we happened to pick. Your data works the same way: the extension never carries it. It supplies an authorization token, and your model provider calls the Klips MCP server, which calls our public API.
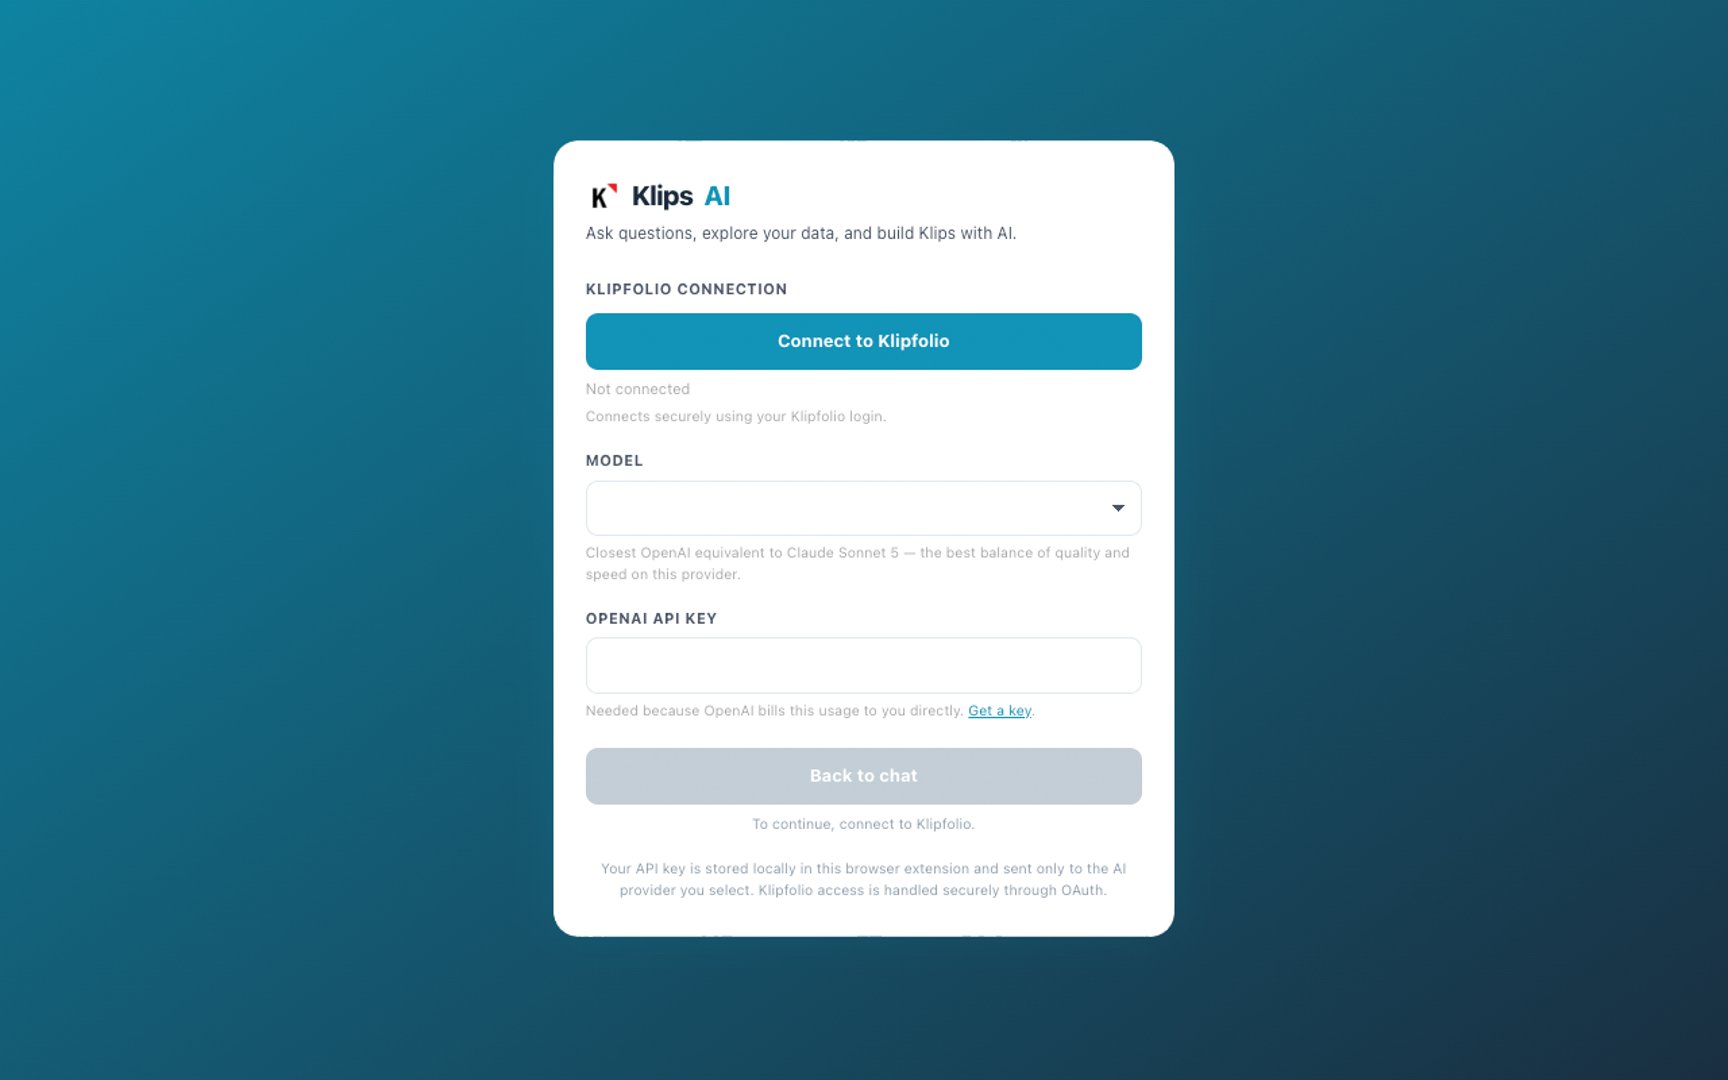
Full setup steps are in the Help Center: How do I use the Klips AI Chrome extension?
Try it, and tell me what you asked it and where it fell short. That's the feedback that shapes what comes next.
Updated 2026-11-03





Most recent
- SEP 25What SOC 2 taught a small team about trust
- SEP 15The AI race: progress, humanity, and trust
- SEP 9The good advisor
- AUG 11Beyond simple sign-ups: how True Trials and Activation predict growth
- JUL 7Why business leaders miss important trends in their dashboards
- JUN 19The best chart for the job: Visualizing data for non-technical users