
Automate your workflow with Zapier and Klips dashboards
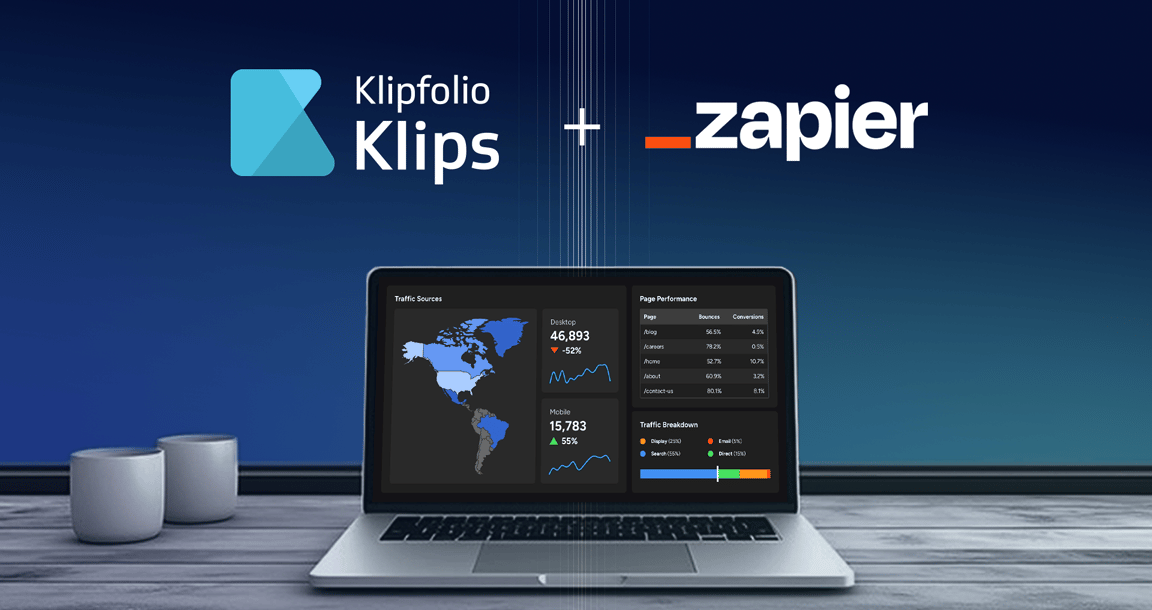
Manually moving data between apps to keep dashboards current costs time and introduces errors. Connect Klipfolio Klips to Zapier and your dashboards update automatically, so your team always works from numbers they can trust. This post covers how to get started and what becomes possible when the two tools work together.

Manually moving data from app to app just to keep your dashboards current is a time sink most teams can't afford. Data is scattered across tools, people are working from different numbers, and errors creep in before anyone notices. You know the picture is incomplete. You just don't know by how much.
That's where Zapier comes in.
Zapier is an automation platform that connects your web apps and moves data between them without manual effort. It can trigger workflows, transfer records, and make sure information lands in the right place in the right format. Connect it to Klipfolio Klips and your dashboards stay current automatically, so you're always looking at numbers you can trust, not numbers someone remembered to update.
Getting started with Klips and Zapier
A few resources to get you up and running:
Video: Getting started with Klipfolio and Zapier
What Zapier and Klips make possible
With Klips, your team's data lives in one place: up to date, clearly presented, and distributed the way you need it. Zapier extends that by automating how data gets in, so you spend less time chasing numbers and more time acting on them.
Here are a few ways teams use Zaps with Klips dashboards:
- Social media + Klips: Track brand mentions in real time and surface them on your dashboard automatically.
- Marketing automation + Klips: When a new lead is created in your marketing platform, their details flow straight into your pipeline dashboard.
- eCommerce + Klips: A sale closes; your revenue numbers update without anyone touching a spreadsheet.
- Project management + Klips: A new task is created; your team's workload view reflects it immediately.
- Support tickets + Klips: A customer submits a ticket; your open ticket count updates in real time.
Each of these replaces a manual step someone on your team would otherwise own. That time adds up.
Building dashboards that work for your business
The examples above are a starting point. The real value comes from combining data sources in ways that answer the questions you actually ask.
You might want to track support tickets over time alongside a running Net Promoter Score. Or see how often your company is mentioned on social platforms in a given month, and in what context. Or compare content performance with CRM data in a single chart that shows where you're getting traction.
With Klips and Zapier together, those views build themselves. You're not pasting numbers into a spreadsheet or explaining your business to a generic tool from scratch every time. The data flows in, the dashboard stays current, and your team works from the same picture.
That's fewer errors, less time spent on reporting, and more confidence in the numbers when it counts.
Updated 2026-09-01
More in AI
A guide to building dashboards with Zapier and Klipfolio

Five Net Promoter Score (NPS) challenges that AskNicely can help you overcome

Real-time KPI dashboards help Gogoprint improve their NPS rating from 42% to 77% in less than one year
Google Sheets: Best practices to prepare your data for your dashboard

How we automated reporting for 50+ clients

Top venture capital blogs to follow in 2026
Most recent
- SEP 25What SOC 2 taught a small team about trust
- SEP 15The AI race: progress, humanity, and trust
- SEP 9The good advisor
- AUG 11Beyond simple sign-ups: how True Trials and Activation predict growth
- JUL 7Why business leaders miss important trends in their dashboards
- JUN 19The best chart for the job: Visualizing data for non-technical users