Order Tracking
Monitor the current status and accuracy of orders that are being shipped to your customers.
On-Time Delivery Rate
| Region | On-Time % | Orders |
|---|---|---|
| AMER | 96% | 12,400 |
| EMEA | 92% | 8,200 |
| APAC | 89% | 5,100 |
| All regions | 93% | 25,700 |
What is Order Tracking?
Order Tracking measures the status and accuracy of orders being shipped to your customers, covering accuracy rates, transit milestones, and delivery performance by region.
Overview
When a customer places an order, they expect two things: to receive it on time and to know where it is. Order Tracking metrics give your operations team the visibility to deliver on both.
This KPI group covers order accuracy, shipment departure and arrival times, transit milestones, and the number of units shipped by region. Tracking these in real time means your team can respond to developing issues before customers have to ask.
Key terms
- Order accuracy: The percentage of orders shipped without incident (see "Perfect Order Rate").
Success indicators
- A high order accuracy rate, which also includes on-time deliveries.
Why Order Tracking matters
Every "Where is my order?" contact costs you time and money. Strong Order Tracking reduces those contacts, cuts re-ship costs, and protects customer satisfaction.
Beyond the customer experience, Order Tracking exposes carrier problems and bottlenecks in your pick-pack process before they compound. If a lane is consistently running late, you see it. If a carrier's exception rate is climbing, you catch it early. That clarity is what lets a lean operations team stay ahead of problems instead of reacting to them.
Events to track
Before you can calculate anything, you need consistent event data across your shipments.
- Picked, packed, shipped: Time from order creation to carrier hand-off.
- In-transit milestones: Departed hub, out for delivery, delivery attempt, and delivered.
- Exceptions: Weather delays, address issues, and customs holds.
How to calculate core measures
Three calculations anchor most Order Tracking programmes.
On-time delivery rate:
On-Time Delivery Rate = Orders delivered by promised date / Total orders delivered
Tracking availability:
Tracking Availability = Orders with valid tracking number / Total orders shipped
Days in transit:
Days in Transit = Actual delivery date - Ship date
Data you need
- Order and shipment tables with promised and actual delivery dates
- Carrier tracking events
- Customer contacts tagged "order status"
Common pitfalls
Even good data can mislead you if you run into these problems.
- Dirty addresses: Bad address data creates false delays. Validate addresses upstream before orders ship.
- Missing promised dates: Without a promised delivery date on record, you cannot evaluate on-time performance at all.
- Single-carrier view: Comparing carriers by lane reveals where performance problems actually live, rather than hiding them in blended averages.
Monitoring Order Tracking on a dashboard
Once you have benchmarks and targets in place, consistent monitoring is what turns data into decisions. A live dashboard means you know what is happening without having to pull a report or wait for someone to flag an issue.
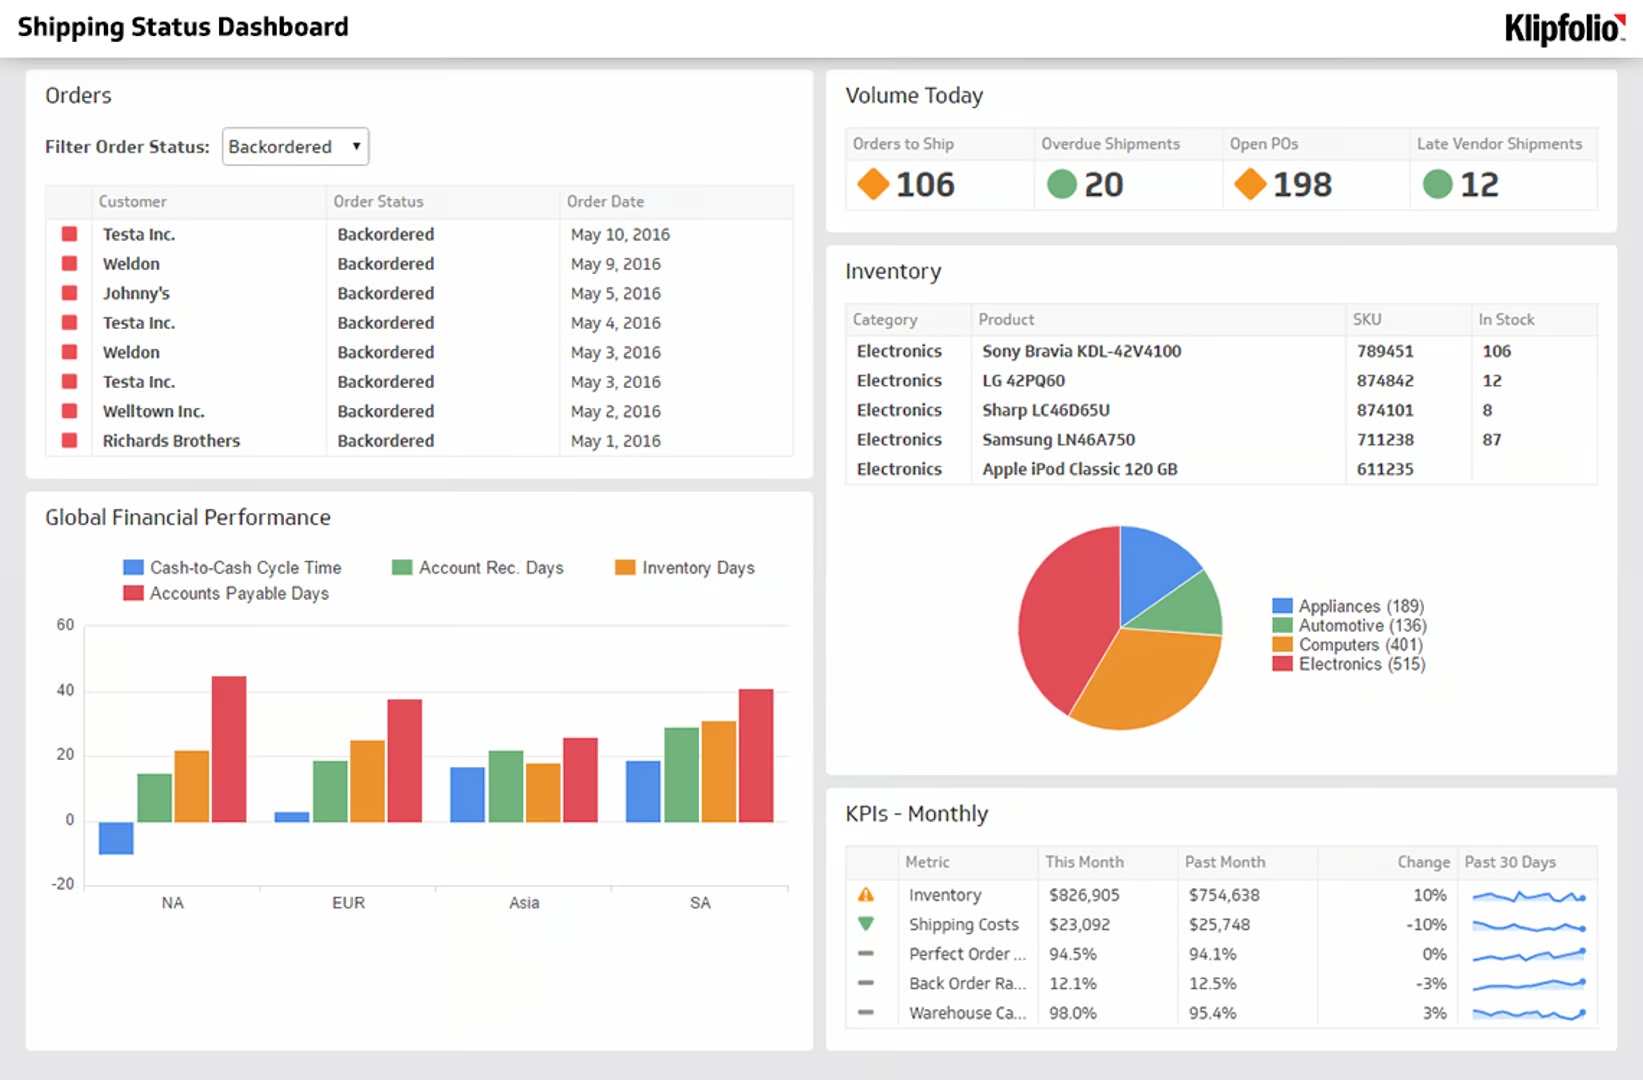
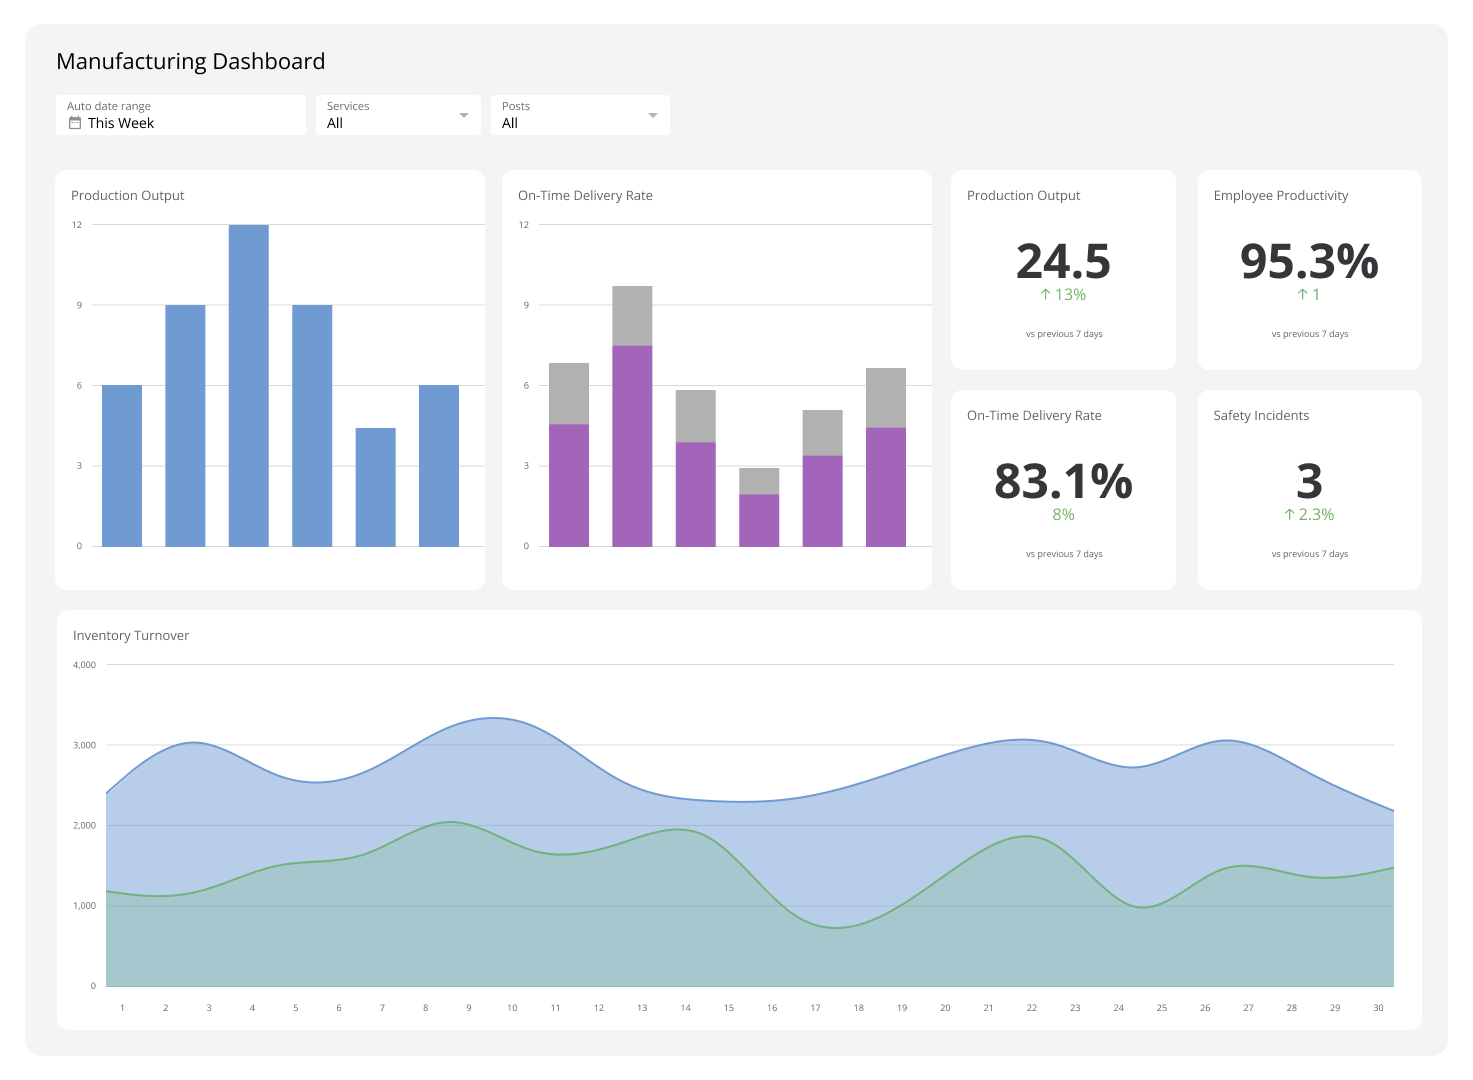
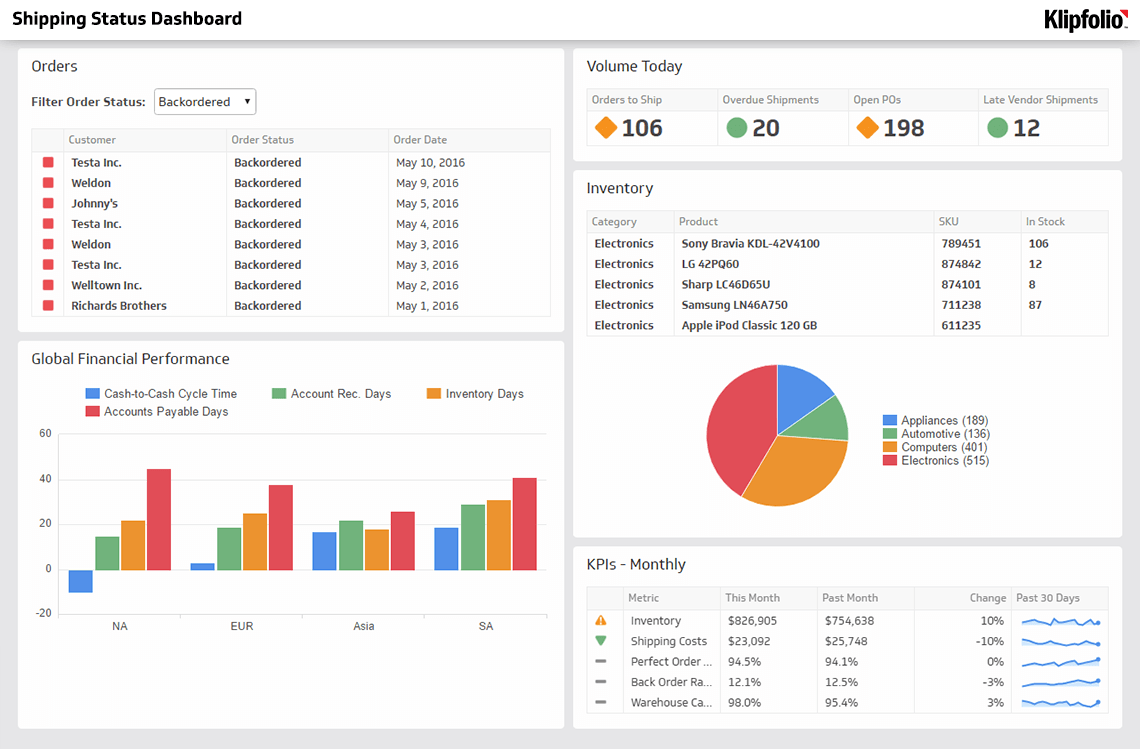
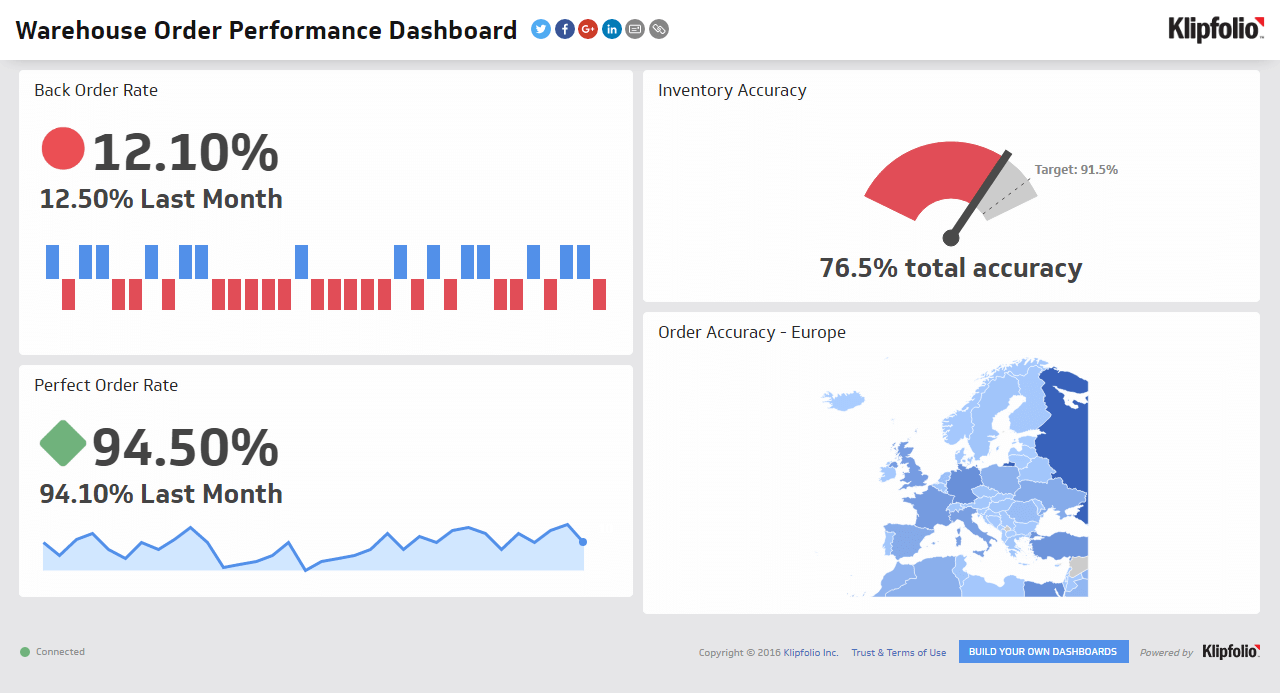
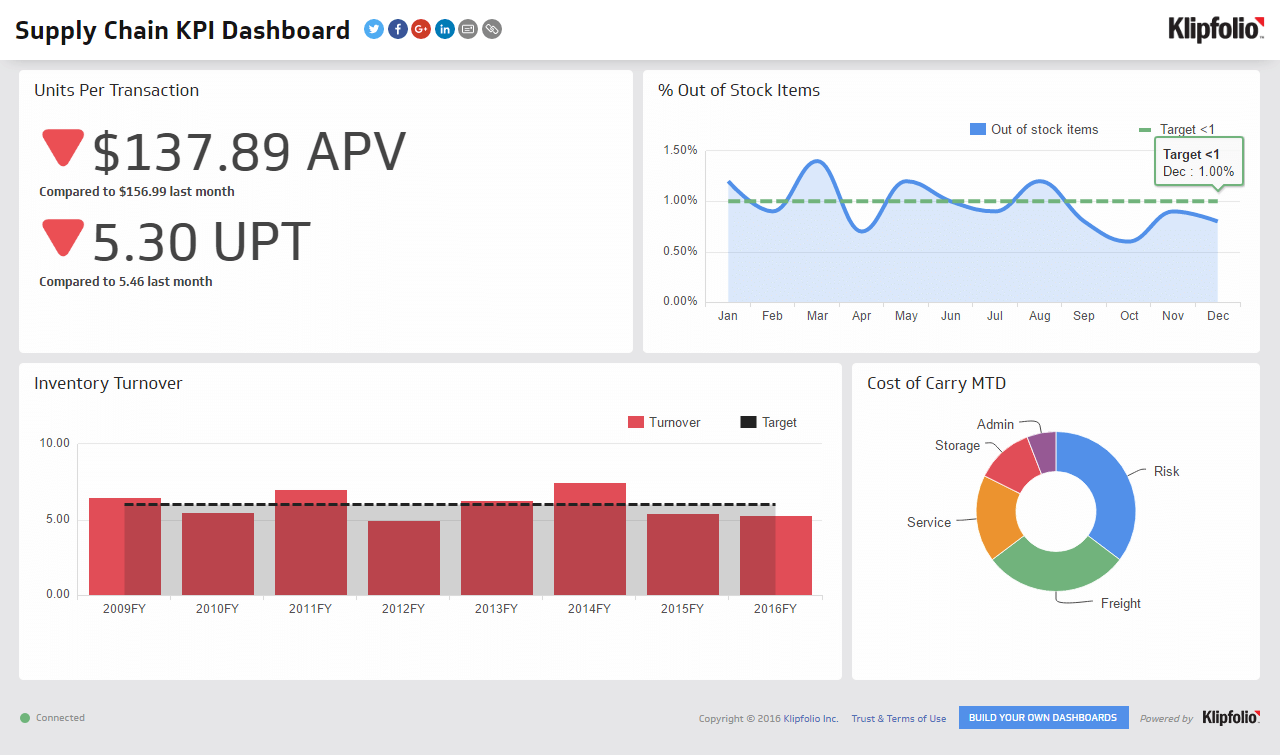
In Klips, you can connect your order management system and carrier feeds, then build calculations for tracking availability, on-time rate, and days in transit by lane. A gauge for on-time rate, a regional map, and a trend line for days in transit give your team an immediate read on performance. Colour-coded thresholds flag lanes below target automatically, and a daily snapshot can go straight to operations and support.
Create custom dashboards for you and your team.
Get started with KlipsRelated metrics
- On-time delivery
- Perfect Order Rate
- Support contact rate
Track Order Tracking in Klips alongside your other supply chain KPIs. A live logistics dashboard keeps your team aligned and surfaces problems before customers do.