

Top metrics for leaders: A role-by-role playbook
The top metrics for leaders are a short, shared set of KPIs, each with one owner, one definition, and one review rhythm. This guide gives a role-by-role set for CEOs, COOs, CFOs, CMOs, CROs, CPOs, and CTOs at growing companies, then maps targets for the growth and profitability stages so your leadership team can focus on decisions instead of whose number is right.

The top metrics for leaders are a short, shared set of KPIs, each with one owner, one definition, and one review rhythm. When finance reports one number, sales another, and product uses separate event data, the executive team spends meetings debating whose number is right instead of deciding what to do.
When every team defines key performance indicators (KPIs) differently, priorities conflict, decisions stall, and trust erodes. The fix is one set of numbers everyone works from, so you can focus on the metrics that drive growth, operational efficiency, and cash flow.
A shared metric catalog resolves the misalignment. Every critical measure is defined identically across the company, with a clear owner, an exact formula, and a consistent refresh cadence. Add goals and alerts on top, and everyone on the leadership team speaks the same numerical language.
Your leadership metric system: A 7-step playbook
What is a leadership metric system? It is a small set of defined, owned, and regularly reviewed metrics that tells the executive team where the business stands and what to do next. These seven steps build one.
-
Define the core: Start with 3 to 5 company-level metrics that the entire executive team reviews weekly. A narrow focus sets the tone for the organization.
-
Make definitions unambiguous: Write the exact formula, time window, and inclusions or exclusions. Is a "customer" an account or a user? Decide once.
-
Assign ownership: One person is accountable for each metric, its definition, and its context.
-
Connect sources: Point each metric at the system of record (for example, your CRM or billing system) and set an automated refresh cadence (for example, 15 minutes, 4 hours, or 12 hours). Or feed a centralized data warehouse.
-
Set targets: Set clear growth and profitability targets. Explicit targets make trade-offs visible and prompt action.
-
Publish and share: Give each role its own dashboard, plus one unified leadership view for the executive team.
-
Establish a review cadence: Hold a weekly leadership review, a monthly deep dive, and a quarterly target reset.
Executive metric playbook: By role
These are high-leverage metrics that work across most growing companies. Choose the few that matter most, then add measures specific to your business.
CEO: Focus on durable growth and quality of revenue
Primary goal: Compound long-term value while protecting cash runway.
| Metric | Definition & Formula | Why It Matters | Cadence |
|---|---|---|---|
| Net Revenue Retention (NRR) | Expansion + Renewals - Contraction - Churn, as % of starting revenue. Formula: (MRR Starting + Exp - Cont - Churn) / MRR Starting | Judge of product-market fit depth and expansion health. High NRR fuels durable growth. | Monthly & Quarterly |
| Revenue Growth Rate | Period-over-period revenue change. Formula: (Rev This - Rev Last) / Rev Last | Core pace-setter for company value creation. | Weekly & Monthly |
| Burn Multiple | Net burn divided by net new Annual Recurring Revenue (ARR). Formula: Net Burn / Net New ARR | Efficiency lens. Measures how much capital is burned to generate each dollar of new ARR. | Monthly |
| Rule of 40 (Recurring Rev Models) | Revenue Growth Rate + Operating Margin | Blends growth and profitability into a single health measure. | Quarterly |
| Employee Engagement (eNPS) | Share of promoters minus detractors from an employee survey. | Indicator of organizational health, talent retention, and future productivity. | Quarterly |
COO: Build repeatable, efficient execution
Primary goal: Ship on time, improve quality, and reduce unit cost.
| Metric | Definition | Why It Matters | Cadence |
|---|---|---|---|
| On-time Delivery Rate | Share of orders, projects, or releases delivered on or before the due date. | Reliability builds customer trust and predictable cash flow. | Daily & Weekly |
| Cycle Time | Average time from start to completion for a process (e.g., production, project). | Faster loops, lower Work-in-Progress (WIP), higher throughput. | Weekly |
| Gross Margin | (Revenue - Cost of goods sold) / Revenue | Foundation for pricing and operating flexibility. Must beat unit economics target. | Monthly |
| First-Contact Resolution Rate | Share of support issues resolved in the first interaction. | Lower cost-to-serve and better customer experience. | Daily & Weekly |
| Operating Expense Ratio (OpEx/Revenue) | Operating expenses divided by revenue. | Measure of spending discipline relative to growth. | Monthly |
CFO: Protect runway and improve unit economics
Primary goal: Balance aggressive growth with essential cash discipline.
| Metric | Definition & Formula | Why It Matters | Cadence |
|---|---|---|---|
| Cash Runway (months) | Months until cash hits zero at current net burn. Formula: Current Cash / Monthly Net Burn | Survival and optionality. The ultimate health measure for growing businesses. | Monthly |
| Operating Margin | Operating income / Revenue | Cost discipline and overall operational profitability. | Monthly & Quarterly |
| Free Cash Flow (FCF) | Cash from operations minus capital expenditures. | True health after all growth spending. | Monthly & Quarterly |
| Days Sales Outstanding (DSO) | Average days to collect receivables. | Working capital efficiency and collection speed. | Monthly |
| Net Dollar Retention (NDR) | Recurring revenue kept and expanded from existing customers (similar to NRR). | Resilience of the existing customer base. | Monthly |
CMO: Create efficient, compounding demand
Primary goal: Produce qualified pipeline and rapidly improve payback periods.
| Metric | Definition & Formula | Why It Matters | Cadence |
|---|---|---|---|
| Pipeline Generated (Marketing-sourced) | Qualified pipeline value directly sourced by marketing efforts. | Fuels sales bookings predictability and justifies spend. | Weekly |
| Customer Acquisition Cost (CAC) | Sales and marketing cost to acquire one new customer. Formula: Sales & Marketing Spend / New Customers | Affordability of growth. Must decline as the business scales. | Monthly |
| CAC Payback Period | Months to recover CAC from gross margin. | Speed to recover marketing spend. Lower is always better. | Monthly |
| Cost per Lead (CPL) | Spend divided by qualified leads. | Channel efficiency and cost control. | Weekly |
| Marketing Qualified Leads (MQLs) | Leads that meet an agreed behavioural and fit threshold. | Volume and quality of top-of-funnel output. | Daily & Weekly |
CRO (Chief Revenue Officer): Grow predictable, high-quality revenue
Primary goal: Hit bookings targets with a healthy mix and efficient cycle times.
| Metric | Definition | Why It Matters | Cadence |
|---|---|---|---|
| New ARR / Bookings | Contracted new annual recurring revenue or total booked contract value. | The primary new revenue engine. Must beat plan. | Weekly & Monthly |
| Pipeline Coverage | Pipeline value for next period / Quota for that period. | Confidence and safety margin for the sales forecast. | Weekly |
| Win Rate | Closed-won deals / all closed deals. | Selling quality, accurate forecasting, and product-market fit. | Weekly |
| Sales Cycle Length | Average days from qualified opportunity to close. | Velocity of the sales motion. Shorter is more efficient. | Weekly |
| Expansion ARR | Added recurring revenue from existing customers. | Resilience and future proofing of recurring revenue. | Monthly |
Create custom dashboards for you and your team.
Get started with KlipsCPO (Chief Product Officer): Drive adoption and value
Primary goal: Improve product-led growth, retention, and customer satisfaction.
| Metric | Definition | Why It Matters | Cadence |
|---|---|---|---|
| Weekly Active Users (WAU) | Unique users who complete a meaningful action in the last 7 days. | Core measure of adoption and habit. | Weekly |
| DAU/WAU Stickiness | Daily active users / weekly active users. | Habit strength. High stickiness correlates with higher retention. | Weekly |
| Time to Value (TTV) | Median time from sign-up to first key activation event. | Measures onboarding friction. Low TTV drives early retention. | Weekly |
| Churn Rate | Lost customers / starting customers for the period. | The clearest signal of lost value and poor product fit. | Monthly |
| Product Net Promoter Score (NPS) | Promoters minus detractors from in-product survey. | Satisfaction, advocacy, and referral potential. | Monthly |
CTO: Ship reliably and drive innovation
Primary goal: Raise delivery throughput without sacrificing stability.
| Metric | Definition | Why It Matters | Cadence |
|---|---|---|---|
| Deployment Frequency | Average number of production deployments per day or week. | Throughput and speed of value delivery. | Weekly |
| Lead Time for Changes | Average time from code commit to production. | Flow efficiency and time to market. | Weekly |
| Change Failure Rate | Share of deployments that cause a service incident or rollback. | Release quality. High failure rate destroys trust and velocity. | Weekly |
| Mean Time to Recovery (MTTR) | Average time to restore service after an incident. | System resilience and speed of response. | Weekly |
| Uptime (SLA) | Percentage of time services are available. | The core reliability promise to customers. | Weekly & Monthly |
| Cloud Cost per Active User | Total cloud spend / active users for the period. | Cost-to-serve control as scale increases. | Monthly |
Summary matrix: Metrics and priorities by stage
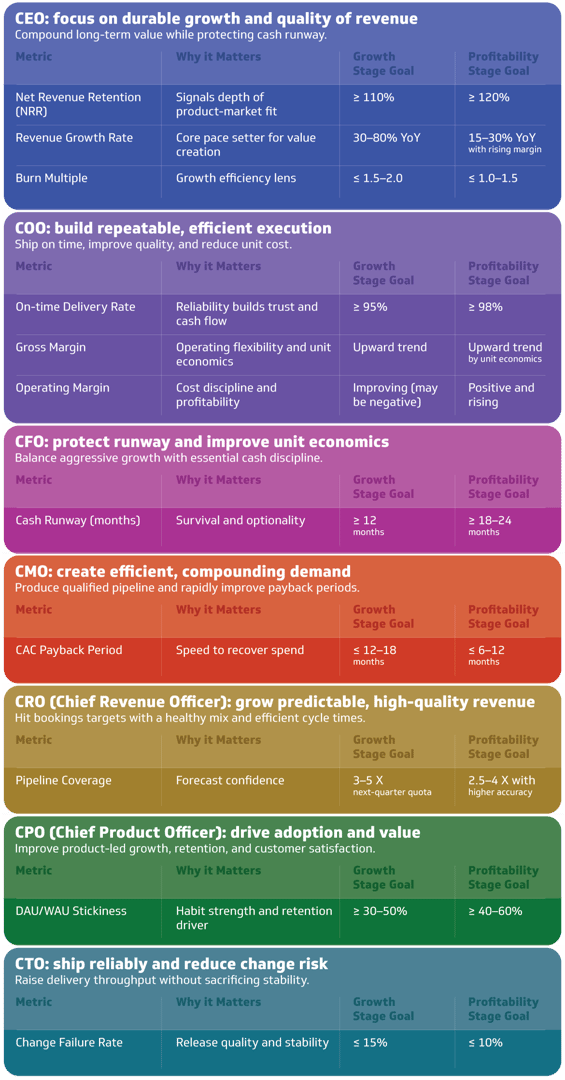
A company chasing market share needs different targets than one maximizing profit. This matrix shows how success shifts from the growth stage to the profitability stage.
| Role | Metric | Why it matters | Growth stage goal | Profitability stage goal |
|---|---|---|---|---|
| CEO | Net Revenue Retention (NRR) | Signals depth of product-market fit | >= 110% | >= 120% |
| CEO | Revenue Growth Rate | Core pace setter for value creation | 30 to 80% YoY | 15 to 30% YoY with rising margin |
| CEO | Burn Multiple | Growth efficiency lens | <= 1.5 to 2.0 | <= 1.0 to 1.5 |
| COO | On-time Delivery Rate | Reliability builds trust and cash flow | >= 95% | >= 98% |
| COO | Gross Margin | Operating flexibility and unit economics | Upward trend | Upward trend by unit economics |
| COO | Operating Margin | Cost discipline and profitability | Improving (may be negative) | Positive and rising |
| CFO | Cash Runway (months) | Survival and optionality | >= 12 months | >= 18 to 24 months |
| CMO | CAC Payback Period | Speed to recover spend | <= 12 to 18 months | <= 6 to 12 months |
| CRO | Pipeline Coverage | Forecast confidence | 3 to 5 X next-quarter quota | 2.5 to 4 X with higher accuracy |
| CPO | DAU/WAU Stickiness | Habit strength and retention driver | >= 30 to 50% | >= 40 to 60% |
| CTO | Change Failure Rate | Release quality and stability | <= 15% | <= 10% |
Notes:
-
Targets vary: Targets vary by model and market. Use the table to set direction, then agree final numbers with each owner.
-
Services businesses: Replace ARR-specific lines with bookings, billable utilization, and project margin.
Building your system with governance and speed
A governed metric system turns the strategy above into a routine your team follows. Here is how to set it up.
-
Create your metric catalog: Start with the metrics and definitions above. Use MetricHQ for vetted formulas.
-
Connect your data: Connect the tools you already use, such as your CRM, billing, and analytics. Set automated refresh rates so the numbers stay current.
-
Start from a role-based layout: Build a dashboard for each role and tailor it to your segments.
-
Set targets: Enter the growth and profitability targets from the matrix, so every leader can see where the quarter stands.
-
Publish shared dashboards: Create a single leadership dashboard and role-specific dashboards, so the right people see what matters without having to ask.
-
Keep a tight cadence: Hold the weekly exec review, monthly deep dive, and quarterly target reset. Archive old metrics to keep the focus sharp.
Thousands of customers use Klips dashboard software to keep their teams on the same page. Pick your top metrics, agree on their definitions, and your next leadership meeting can focus on decisions instead of whose number is right.
FAQs
How many metrics should an exec team track?
Five to ten at the company level, then five per leader. If everything is a priority, nothing is.
What if systems define the same metric differently?
Pick one system of record and write the formula once. Map fields carefully, then have the metric owner sign off on the definition so everyone works from the same answer.
What cadence works best?
Weekly leadership review plus a monthly deep dive. Add quarterly reviews to reset targets and archive stale metrics.
Snapshot of the most important executive team metrics:
Published 2026-04-02
More in Leadership metrics

SMB dashboarding in 2026: Trends shaping reporting

The best chart for the job: Visualizing data for non-technical users

The Power of Now: Why Real-Time Data Is Your Business Superpower

The top 12 SaaS metrics with benchmarks

Why understanding unit economics is important to your business

22 expert-informed metrics for SaaS heads of finance
Most recent
- SEP 25What SOC 2 taught a small team about trust
- SEP 15The AI race: progress, humanity, and trust
- SEP 9The good advisor
- AUG 11Beyond simple sign-ups: how True Trials and Activation predict growth
- JUL 7Why business leaders miss important trends in their dashboards
- JUN 19The best chart for the job: Visualizing data for non-technical users