Spreadsheet power withdashboard clarity
Klips is a complete dashboard solution that automates data retrieval and offers limitless dashboard presentation and distribution options, all with the power and familiarity of spreadsheets.


We’re happy to be defined by the company we keep.
Over 25,000 customers have delivered amazing dashboards with Klipfolio Klips.
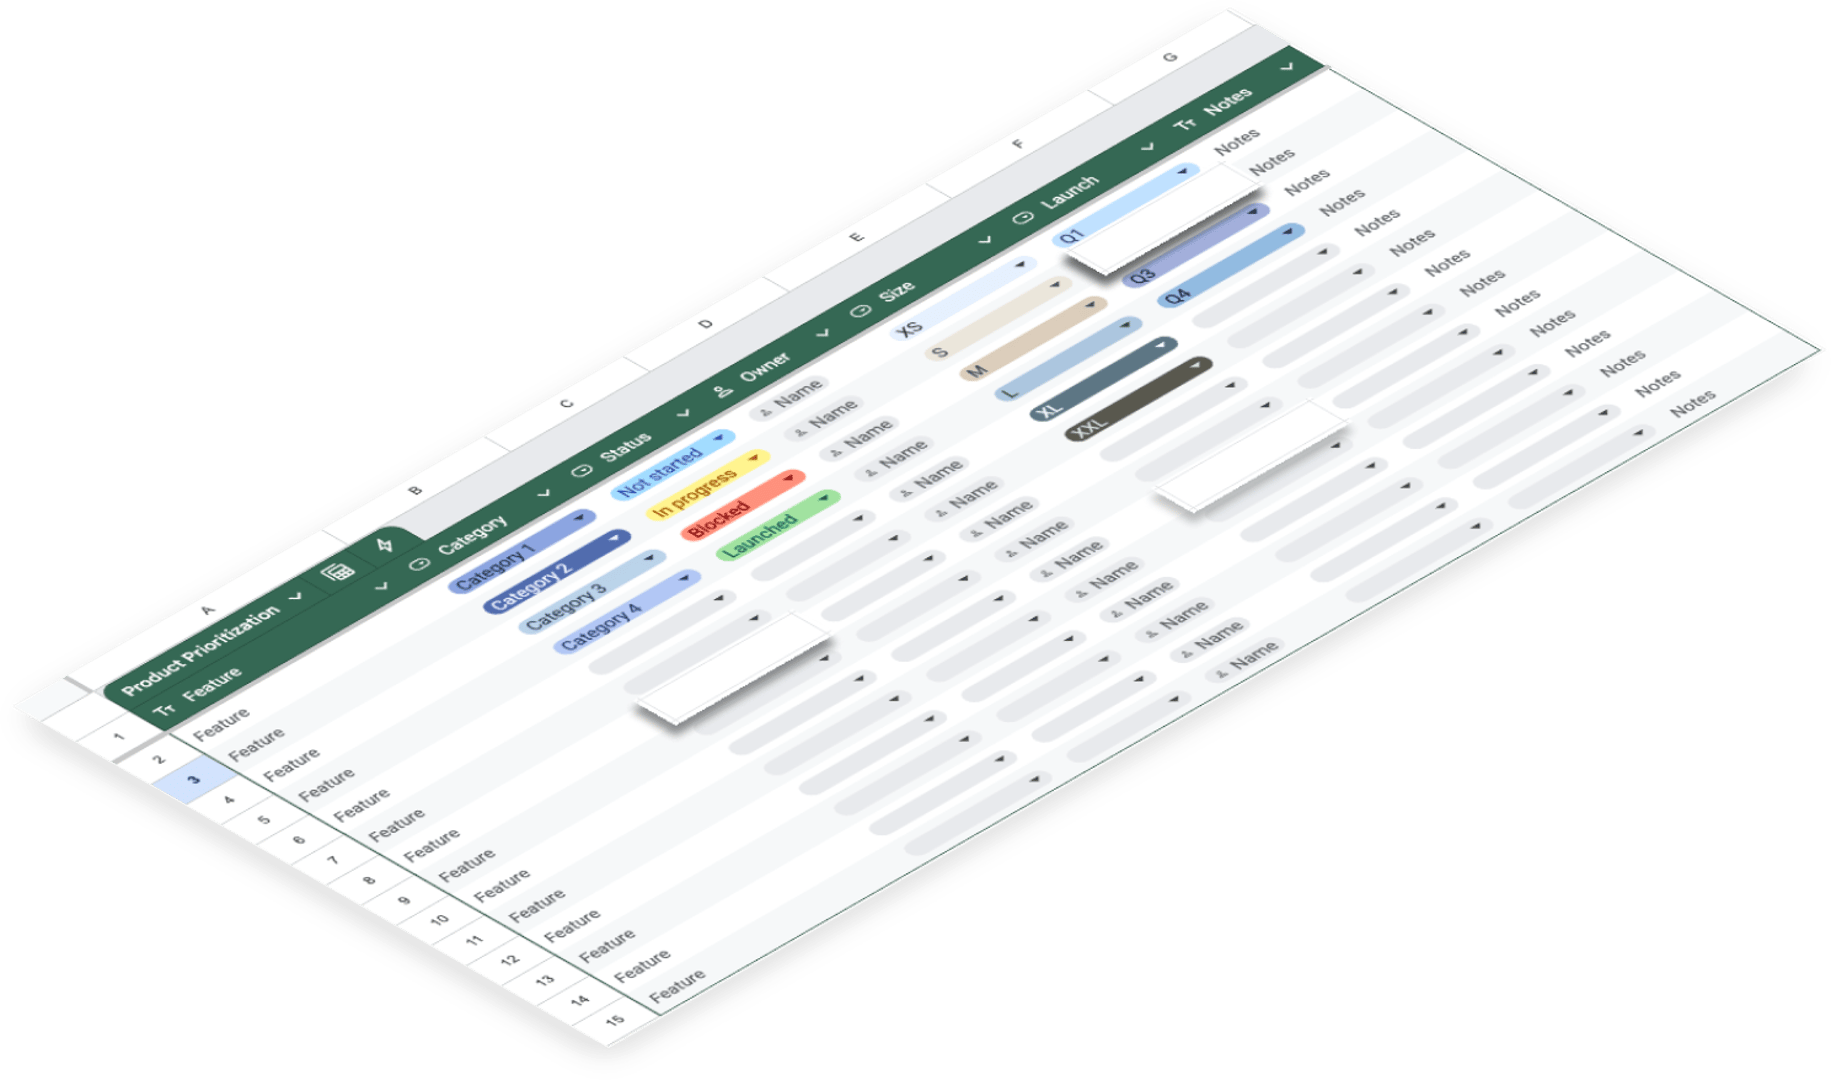
Spreadsheets aren’t made for dashboards. Klips is.
We get it. You‘re a spreadsheet pro—a master of formulas, filters, and pivot tables. But, with data scattered across tools, errors waiting to happen, and charts that barely pass as “insightful,” it’s time your dashboards stepped it up.
We love Excel and Google Sheets too. But using them as the backbone of your reporting process? That’s just unnecessary heavy lifting. Klips automates the grunt work, brings your data together, and gives you dashboards that actually do your data justice.
Three simple steps to
dashboard bliss.
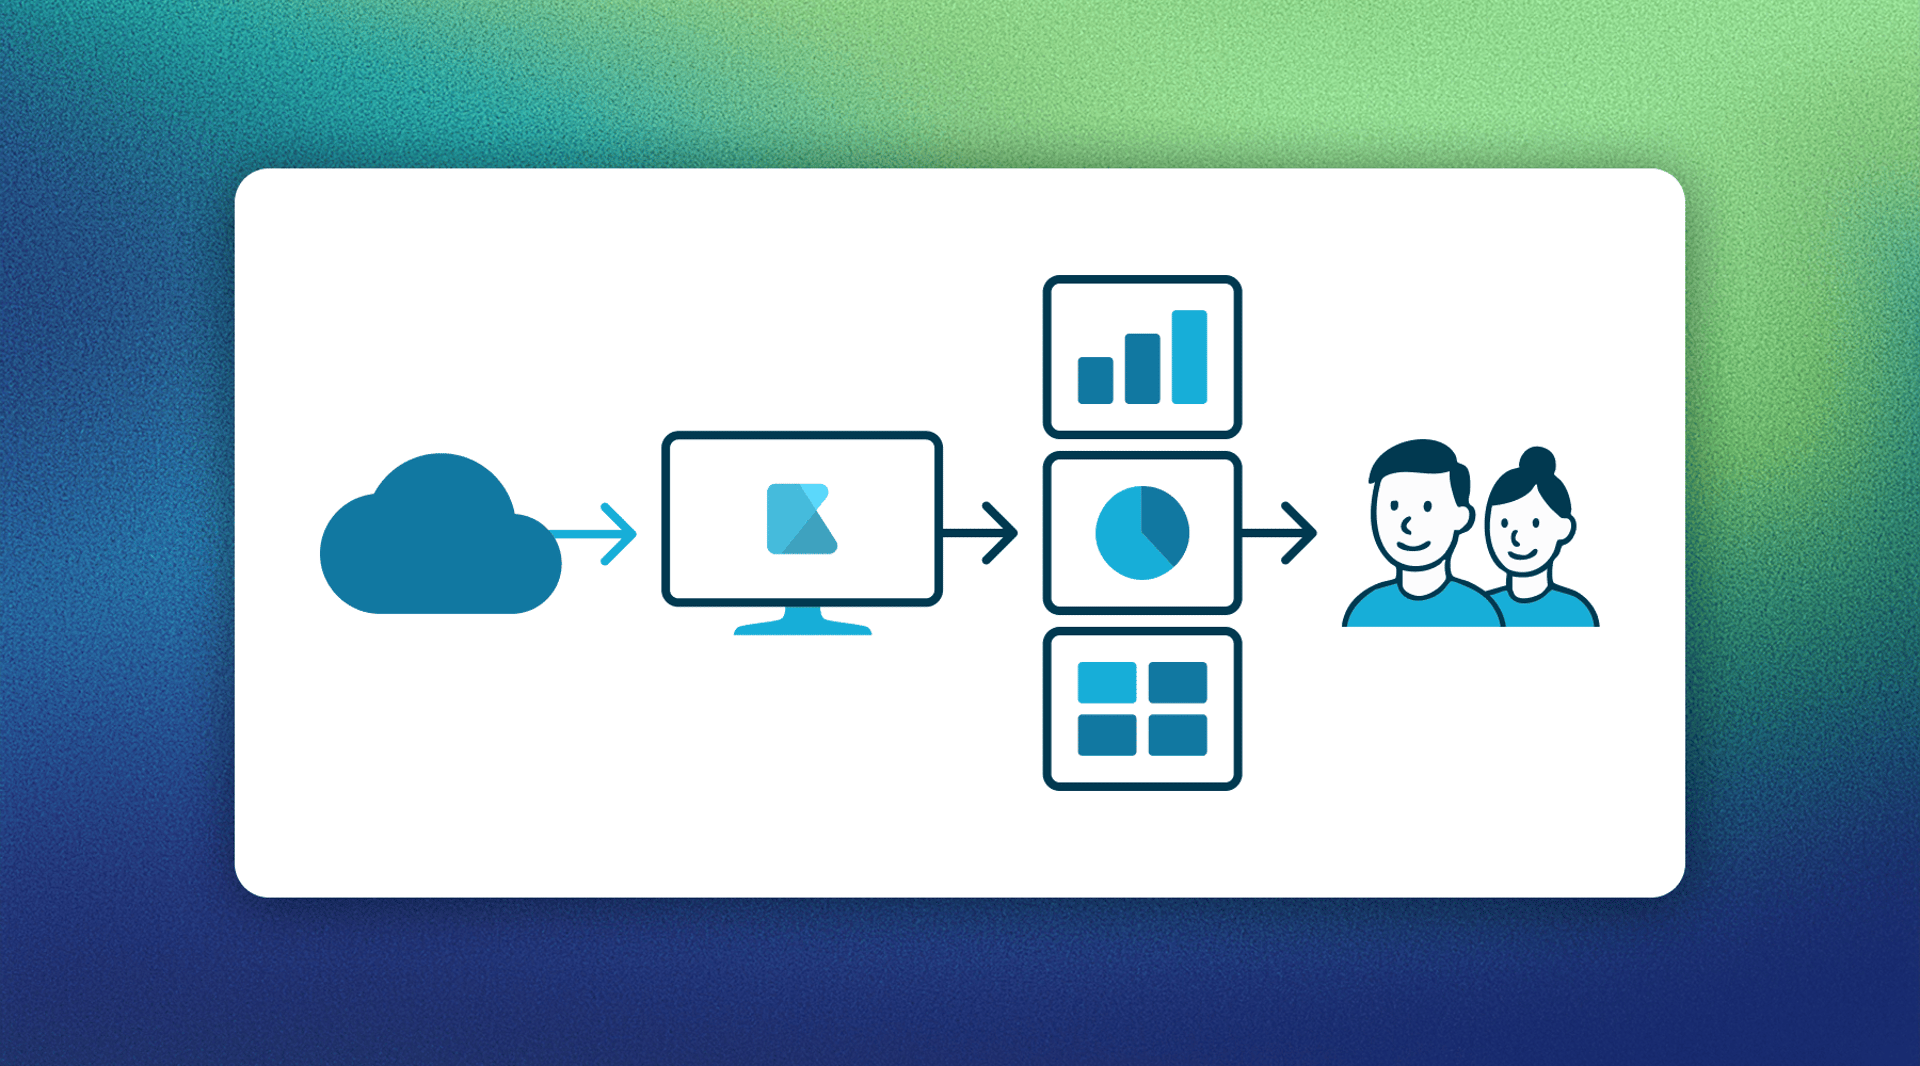
Automate data from spreadsheets
Pull live data straight from Excel or Sheets and stop chasing yesterday's numbers.
Connect directly to 200+ services
Whether it's your CRM, Google Ads, or socials, your data stays connected and reliable.

Skip the data warehouse
(or don’t)
Still working out your data infrastructure? Klips works great with or without a data warehouse.

Go pro with SQL, REST, and more
Get data from almost anywhere with a robust set of query connectors.

Don’t just take our word for it.
Thousands of businesses like yours have automated their dashboarding and reporting workflows and knocked the socks off their teams or clients with Klips.
I build dashboards for clients across many industries and it is by far the best tool I’ve come across for building KPI reports that are used daily and motivate teams to make progress on business goals.

Andrew W.
Director at IT MOOTI
We upload daily data about our business and it’s really helpful to get insights and monitor revenue in real-time.

Sebastián P.
CPO at E-Planning.net
Klipfolio connects all of our disparate systems within our HR department. Seeing survey, HRIS, and ATS data in one dashboard is really cool.

Carolyn S.
Insights at formstack.com
Dashboards that dazzle with tools that deliver.
Klips has everything you need to go from messy data to polished dashboards.
No limits, no hiccups, no problem.
Automate your data management workflow
Build beautiful dashboards
Inspire confident decision-making
Get help when you need it

Automatic data refresh

Refresh scheduling

Asset management API

Debugging tools

Viz source code view

User and account properties

Dynamic data sources

Client dashboard templates
Automate your data management workflow
Automatic data refresh
Refresh scheduling
Asset management API
Debugging tools
Viz source code view
User and account properties
Dynamic data sources
Client dashboard templates
Build beautiful dashboards
30+ best-practice visualizations
Custom theming and white-label
Infinite dashboard layouts
Built-in dark mode support
Pixel-level control
Logo upload
Custom colours & indicators
Drill-down
Inspire confident decision-making

Built on trusted data

Klip comments for context

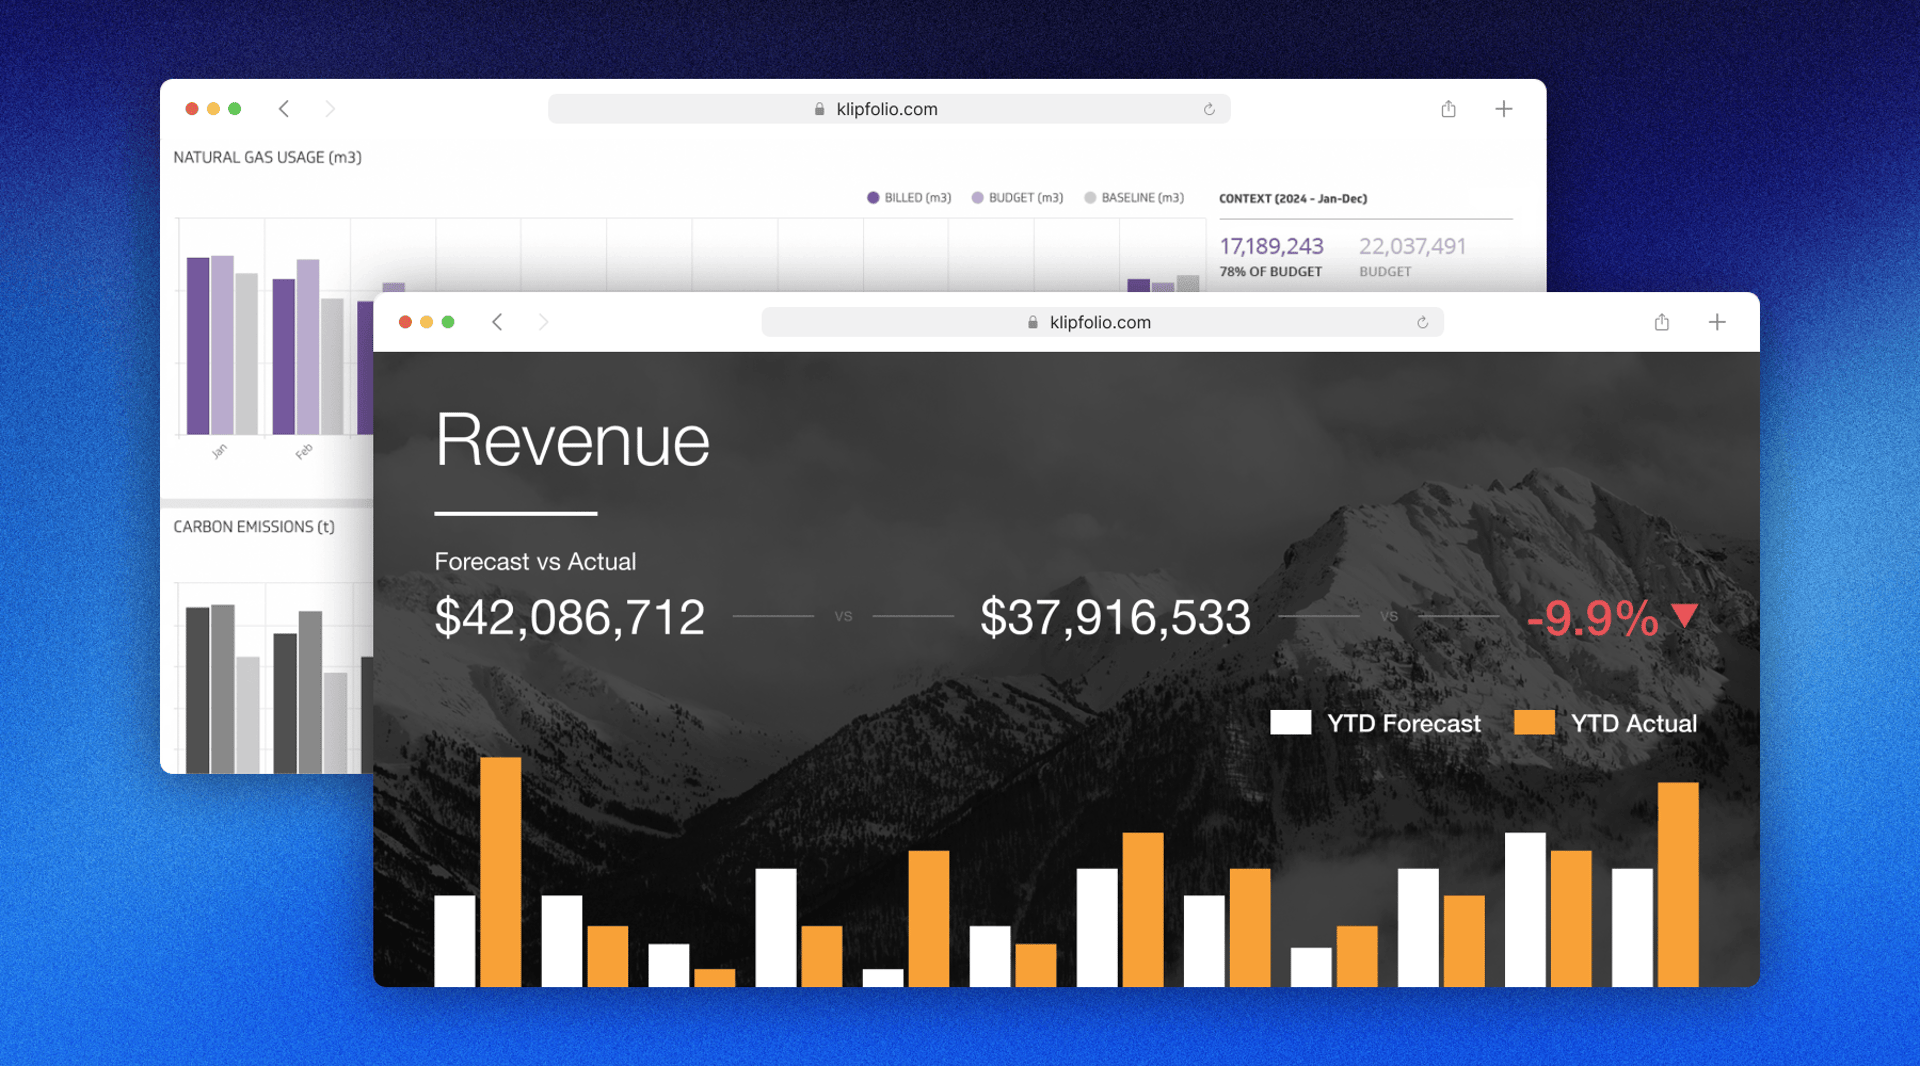
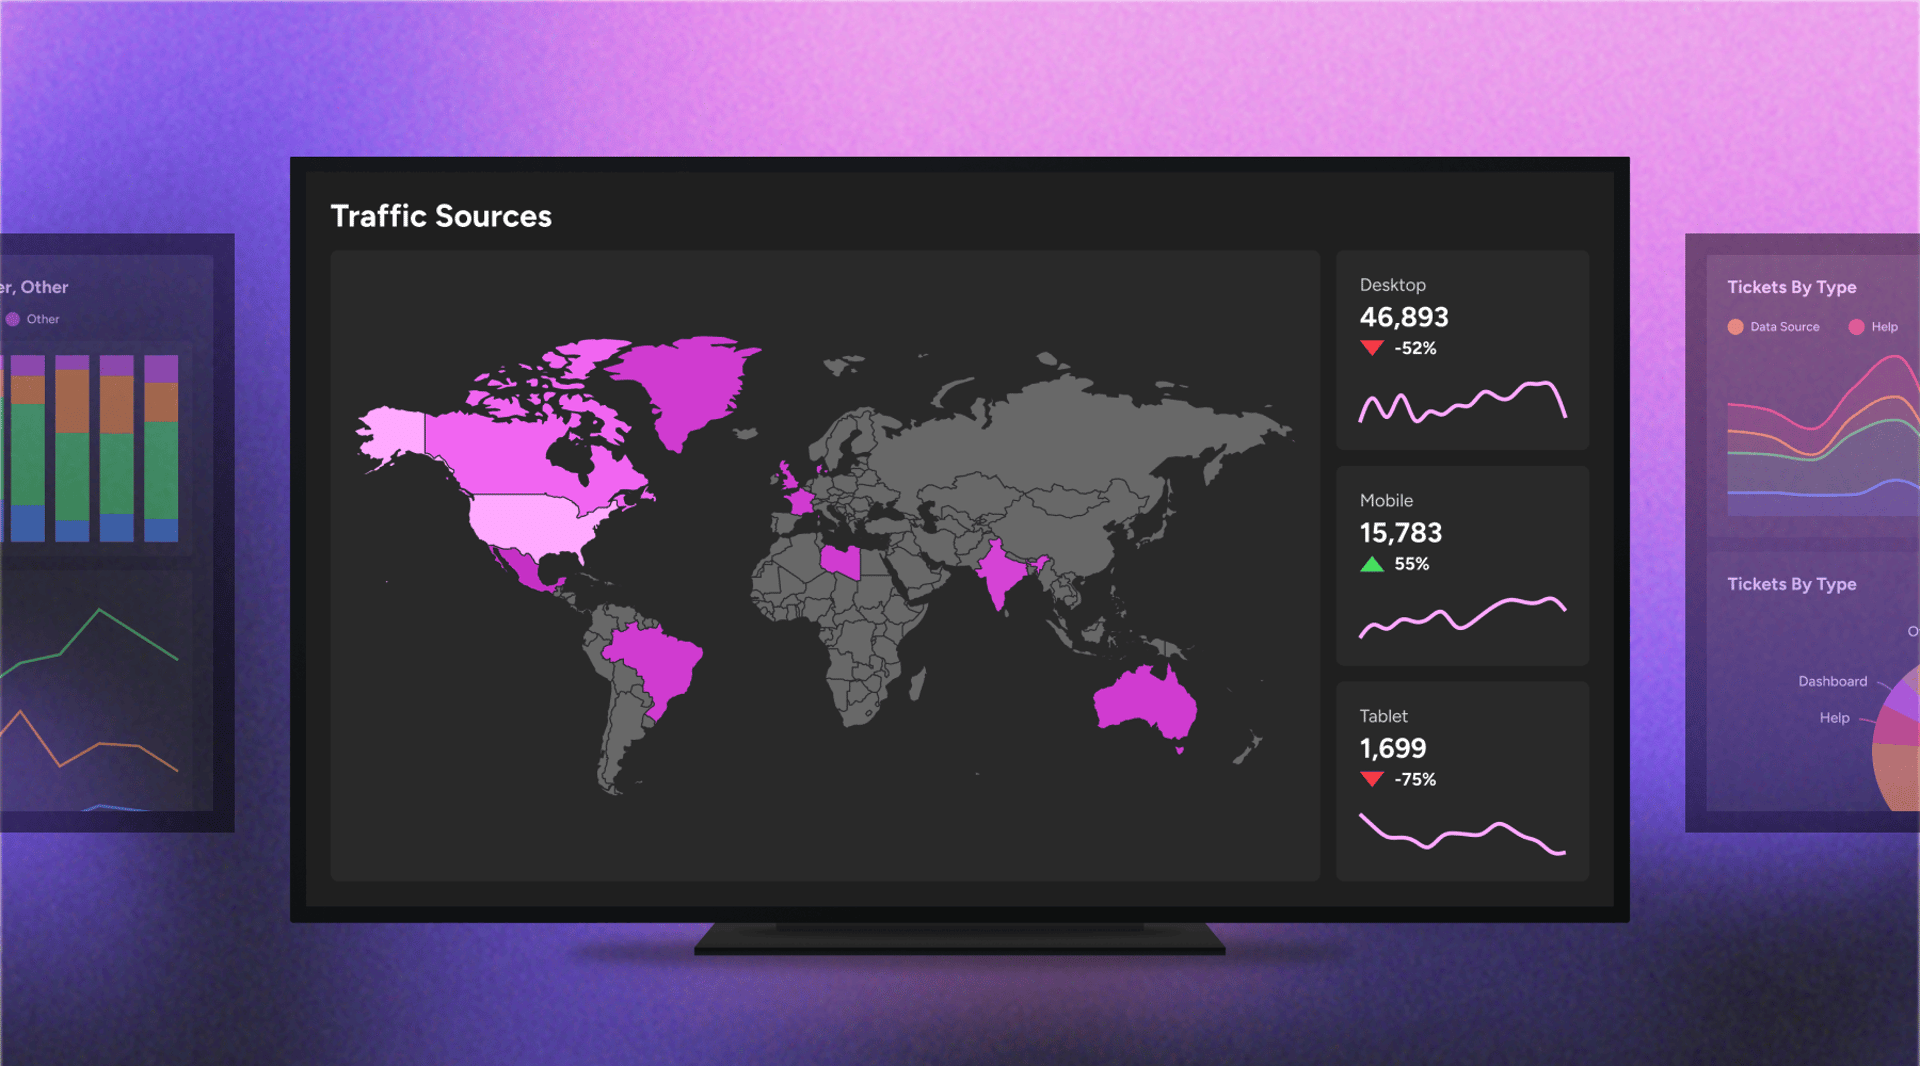
Real-time visualizations

Centralized data access

Team alignment and collaboration

Tailored dashboards

Clear visual storytelling

Empowering for non-technical users
Get help when you need it

Legendary support team

Extensive help centre resources

Onboarding and training options

Video guides and tutorials

In-app tips and prompts

Available professional services

Strong partner network

Curated template Library
Click. Boom. Inspired.
Thousands of businesses like yours have automated their dashboarding and reporting workflows and knocked the socks off their teams or clients with Klips.
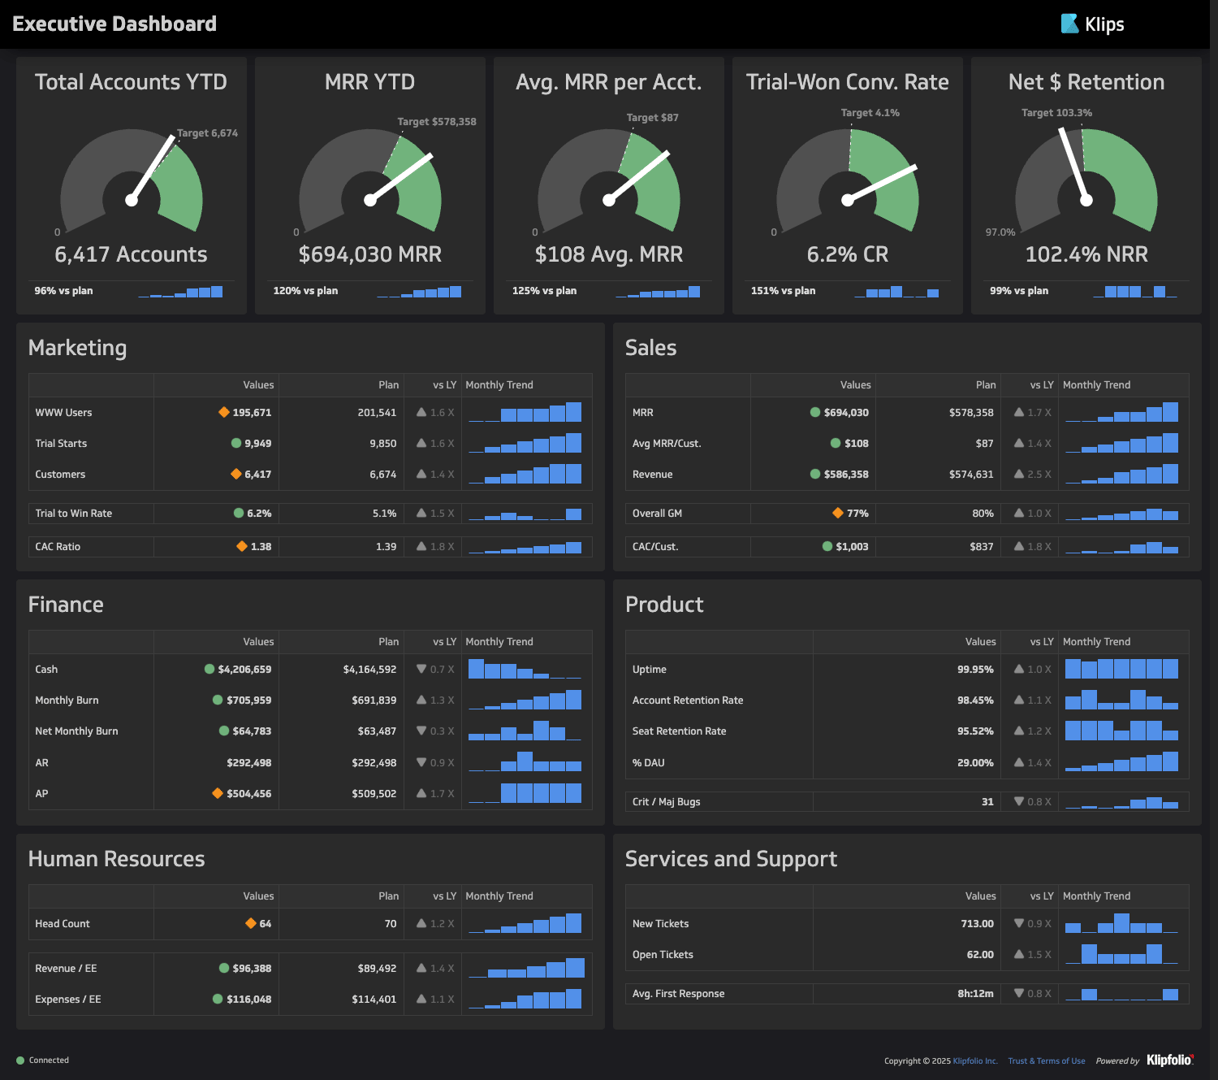
Executive Reporting
An executive reporting dashboard gives leaders a quick, clear view of business performance.
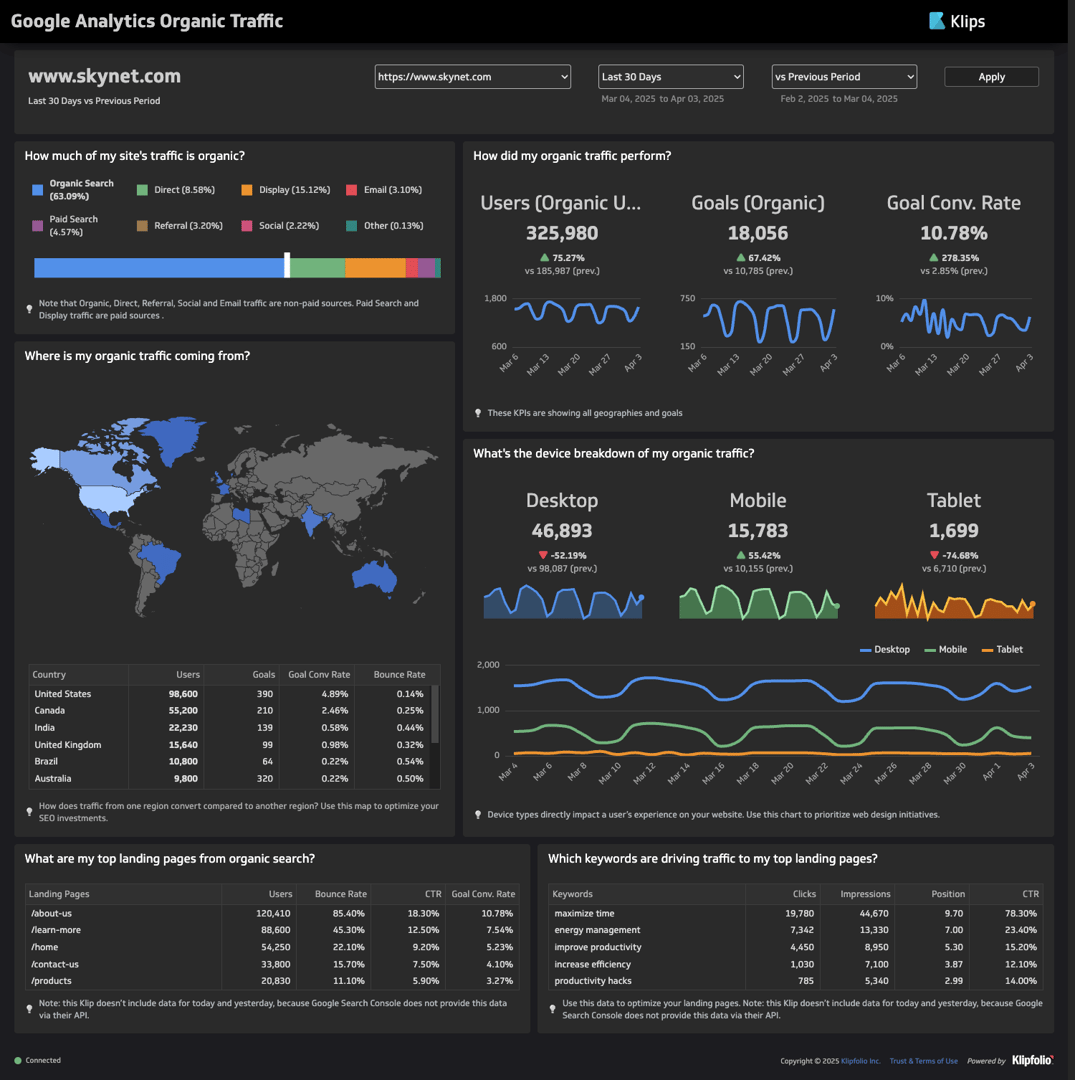
Digital Marketing
Reach your target audience by tracking top digital marketing metrics that measure your success.
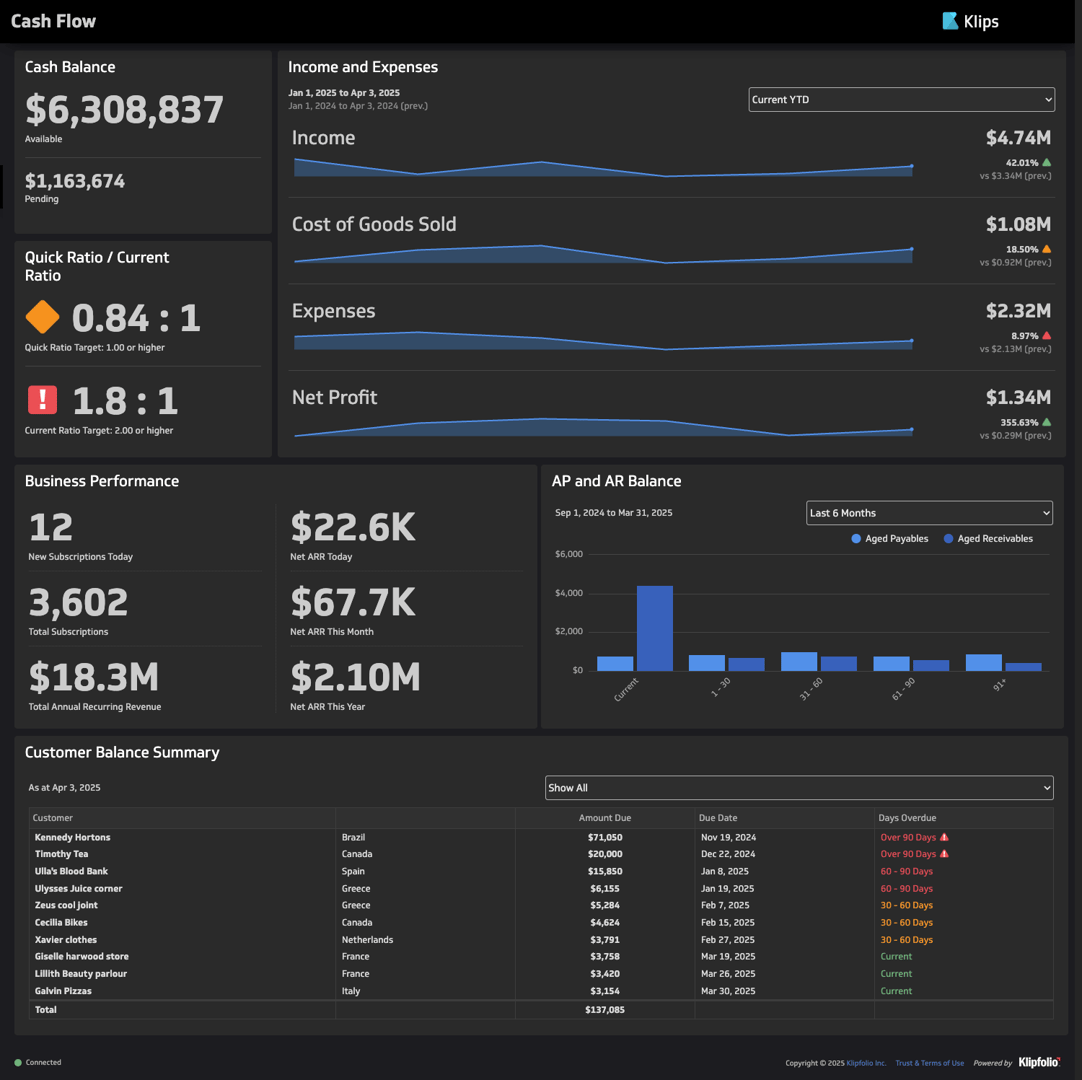
Cash Flow
A cash flow dashboard monitors your company's immediate spending power and cash position.
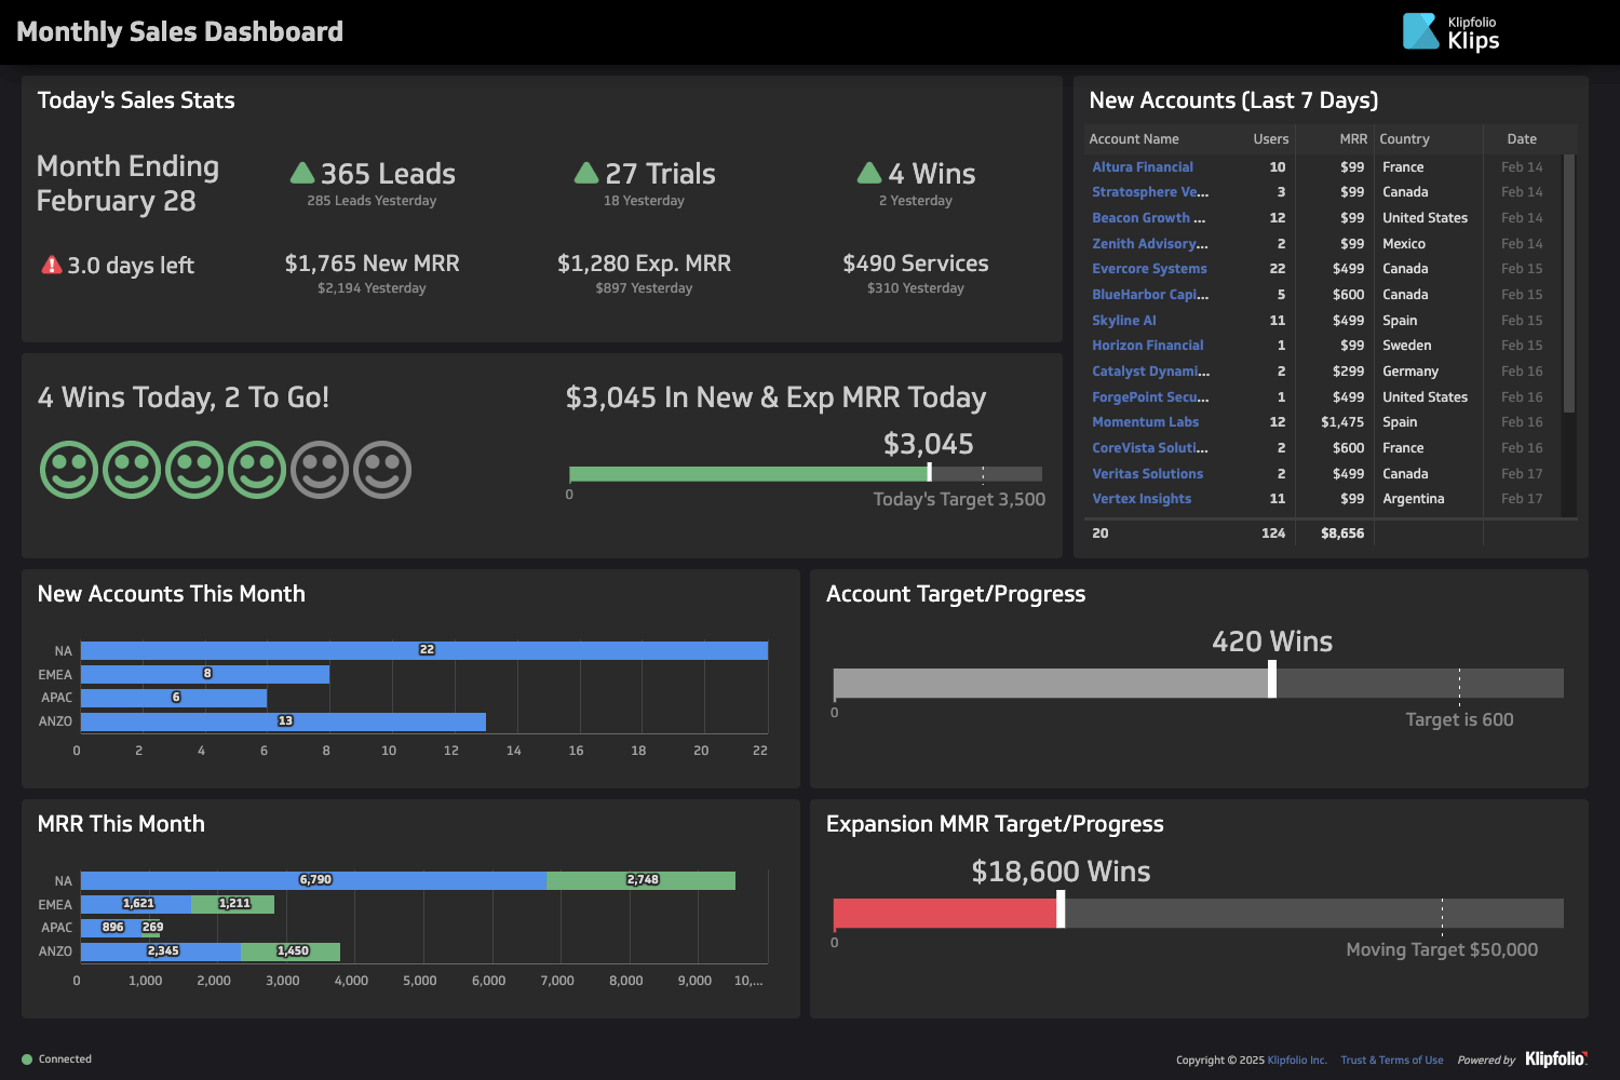
Monthly Sales
A monthly sales dashboard gives your team a clear, real-time look at monthly goals and performance.
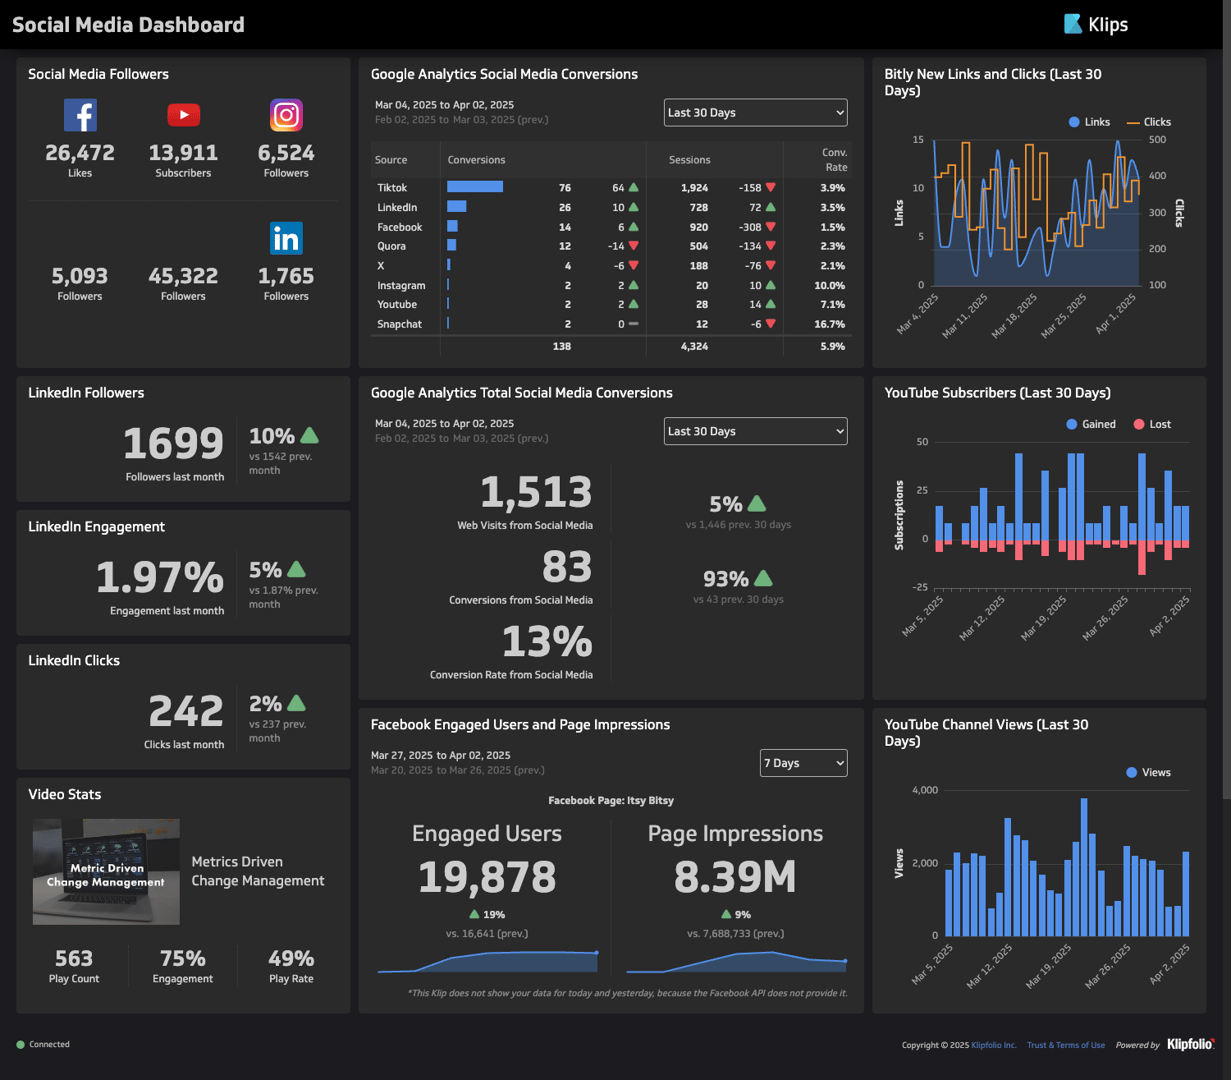
Social Media Monitoring
Track key metrics from multiple social media platforms in one comprehensive dashboard.
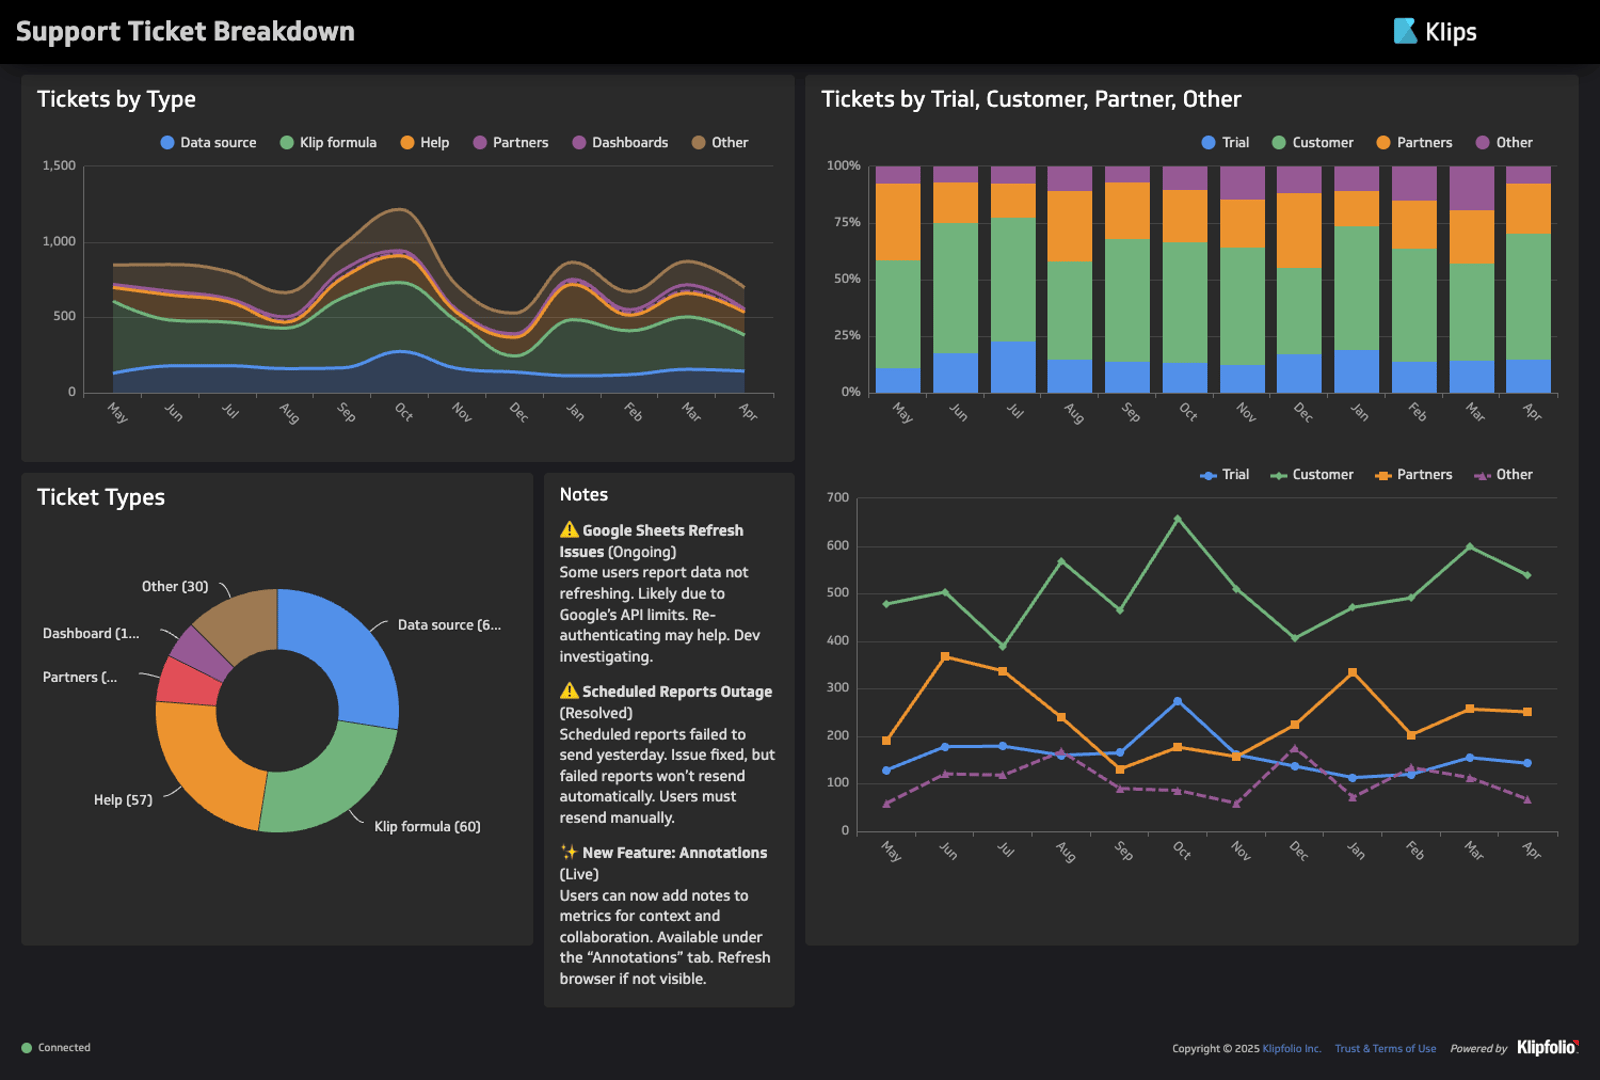
Customer Support
A support dashboard helps you see how well your customer service is doing, in real-time.
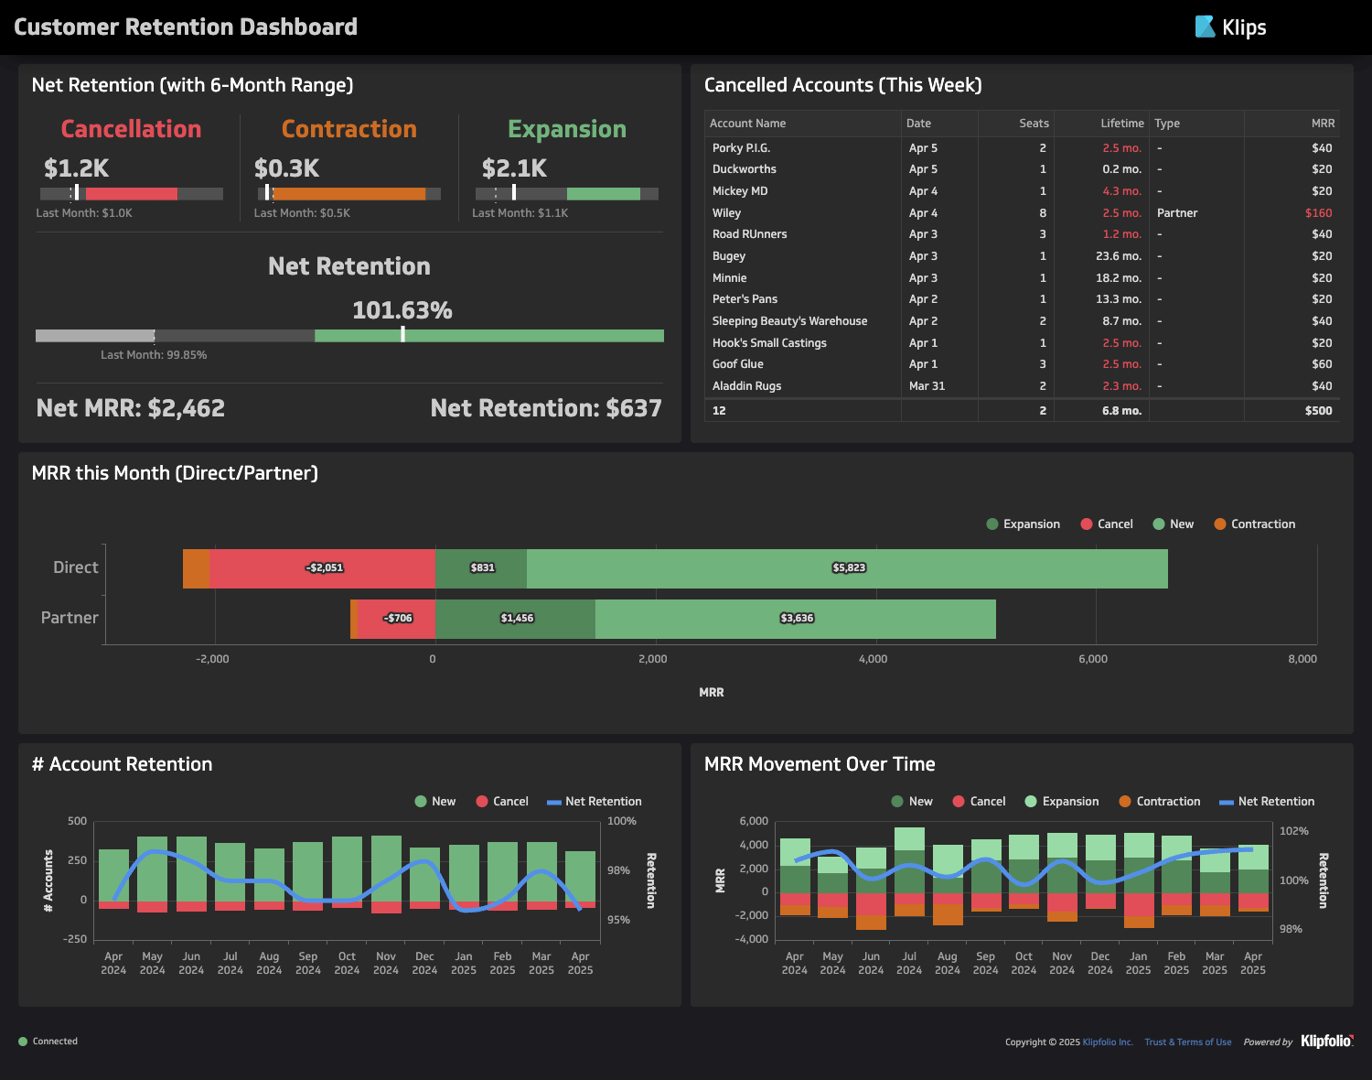
Customer Retention
Build a retention dashboard to track key customer success metrics.
Executive Reporting
An executive reporting dashboard gives leaders a quick, clear view of business performance.
Digital Marketing
Reach your target audience by tracking top digital marketing metrics that measure your success.
Cash Flow
A cash flow dashboard monitors your company's immediate spending power and cash position.
Monthly Sales
A monthly sales dashboard gives your team a clear, real-time look at monthly goals and performance.
Social Media Monitoring
Track key metrics from multiple social media platforms in one comprehensive dashboard.
Customer Support
A support dashboard helps you see how well your customer service is doing, in real-time.
Customer Retention
Build a retention dashboard to track key customer success metrics.
Strength in numbers. And in stars.
We love what we do. And so do our customers.