
Grow your business by helping your clients grow theirs
Deliver beautiful real-time dashboards, automate reporting, and empower your clients to grow — under your brand or ours.
Offer your clients the industry’s highest-rated agency reporting solution
By partnering with Klipfolio, you can start giving your customers access to the world’s best dashboard platform without breaking a sweat (or the bank).
Turn client success into your competitive advantage.
Klipfolio helps your clients see, understand, and act on their data. Whether you build client dashboards, embed analytics in your platform, or provide strategic insights, our partner ecosystem gives you everything you need to succeed.
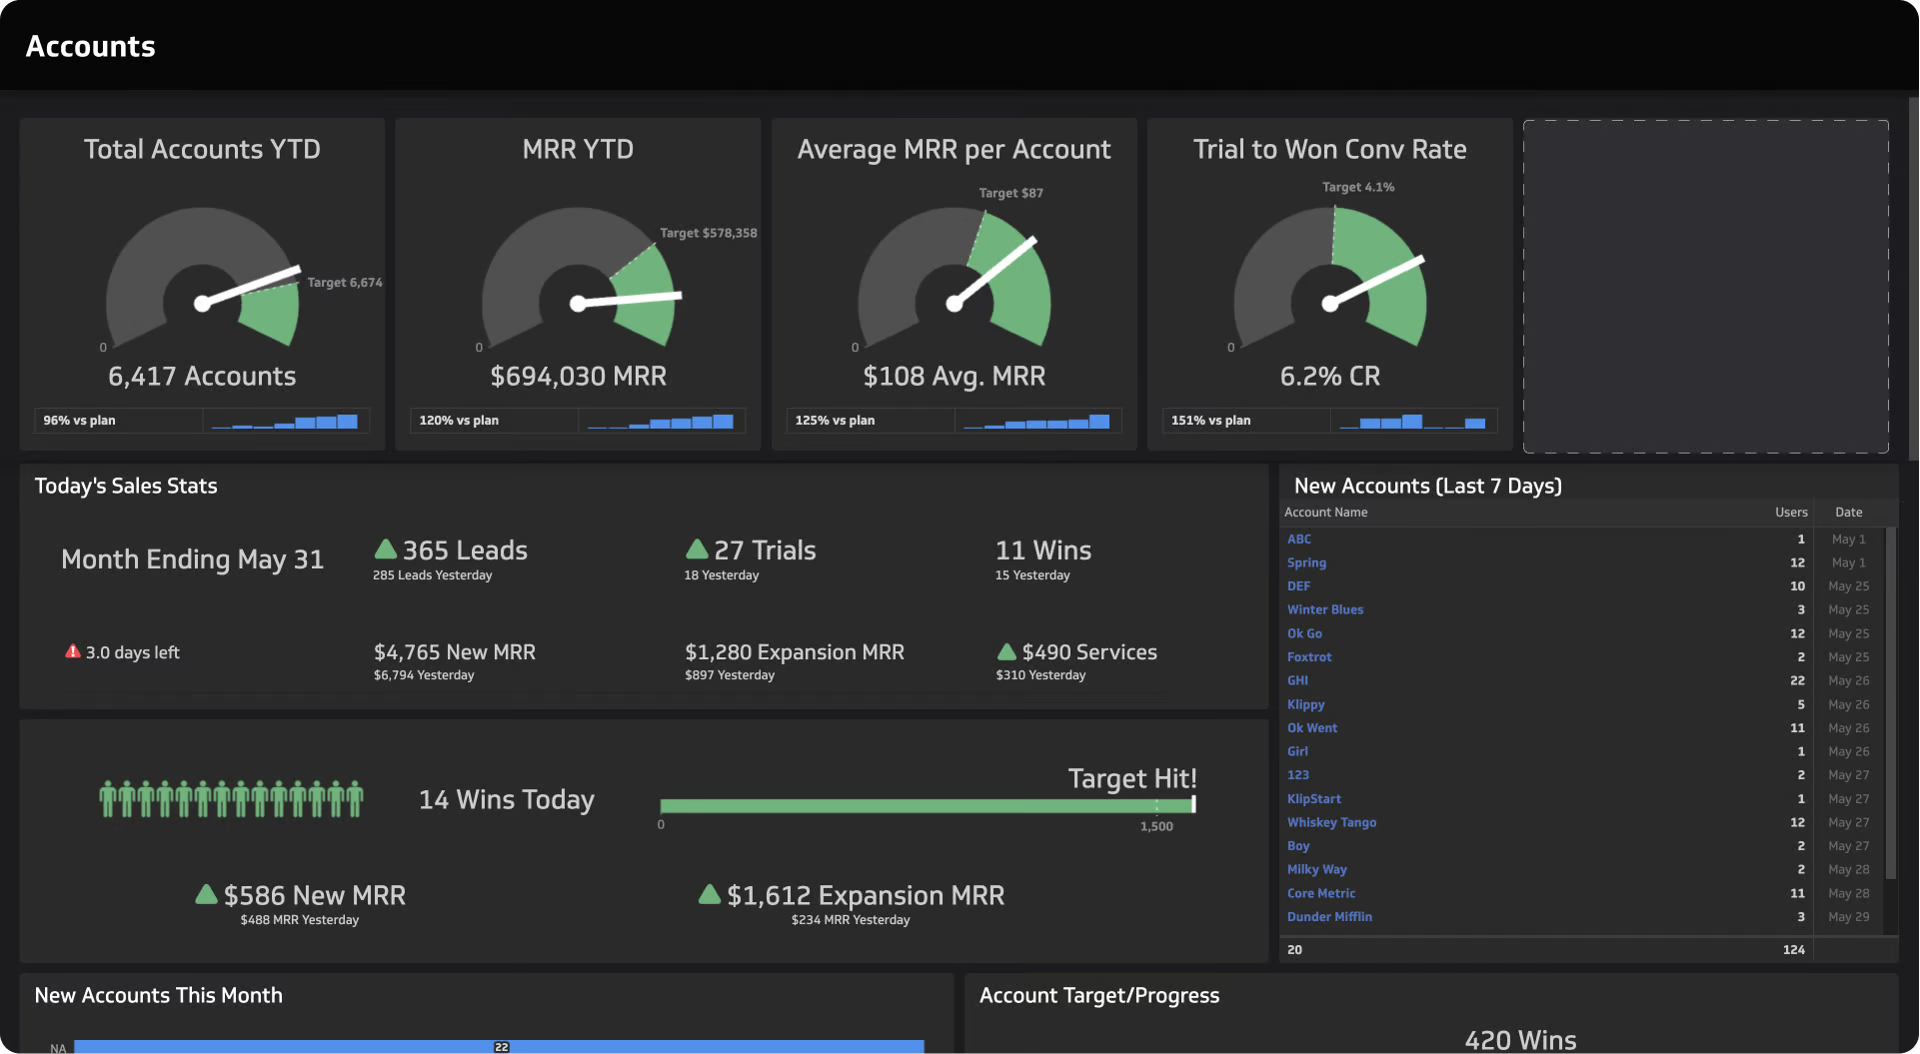
Automate client reporting
Replace spreadsheet reports with live dashboards that automatically update.
Add recurring revenue
Create ongoing analytics services that strengthen retention and expand your offering.
Scale with support
Access training, co-marketing, and a dedicated Partner Success team.
A program built for how you work.
No two Klipfolio Partners are the same. Whether you build, consult, or integrate, we've got the right solution for you.

For agencies that run on results
Automate client reporting, visualize campaign performance, and give your clients the clarity they crave. From SEO and PPC to social and email — bring every channel into one dashboard.

For consultants who turn data into decisions
Deliver real-time dashboards that transform raw data into actionable insight. Build trust, scale your services, and help every client understand their business at a glance.

For advisors who guide with confidence
Combine data from portfolios, spreadsheets, and CRMs into customized, branded dashboards. Help clients stay informed, confident, and aligned with their financial goals.

For software innovators who embed analytics that shine
Add white-labelled dashboards, automate client reporting, and deliver real-time insights inside your app - all powered by Klipfolio.

For resellers who turn insights into revenue
Offer Klipfolio as part of your analytics or consulting services. Add dashboards to your product lineup, earn recurring revenue, and grow your business with branded analytics.
Discover how data-driven partners scale smarter with Klipfolio.
Klipfolio Partners deliver clear, actionable insights to their clients every day. From automated reporting to fully customized dashboards, our platform helps you build consistent, scalable solutions that drive better decisions.

Omnia
Driving Client Success
Everything you need to build, grow, and thrive.
Becoming a Klipfolio Partner means joining a network of innovators who build better client relationships through data. You’ll get the tools, resources, and support to grow your business with confidence.
Client Management
Whether you manage a few client accounts or hundreds, Klipfolio’s client management platform scales with your business.
Learn more
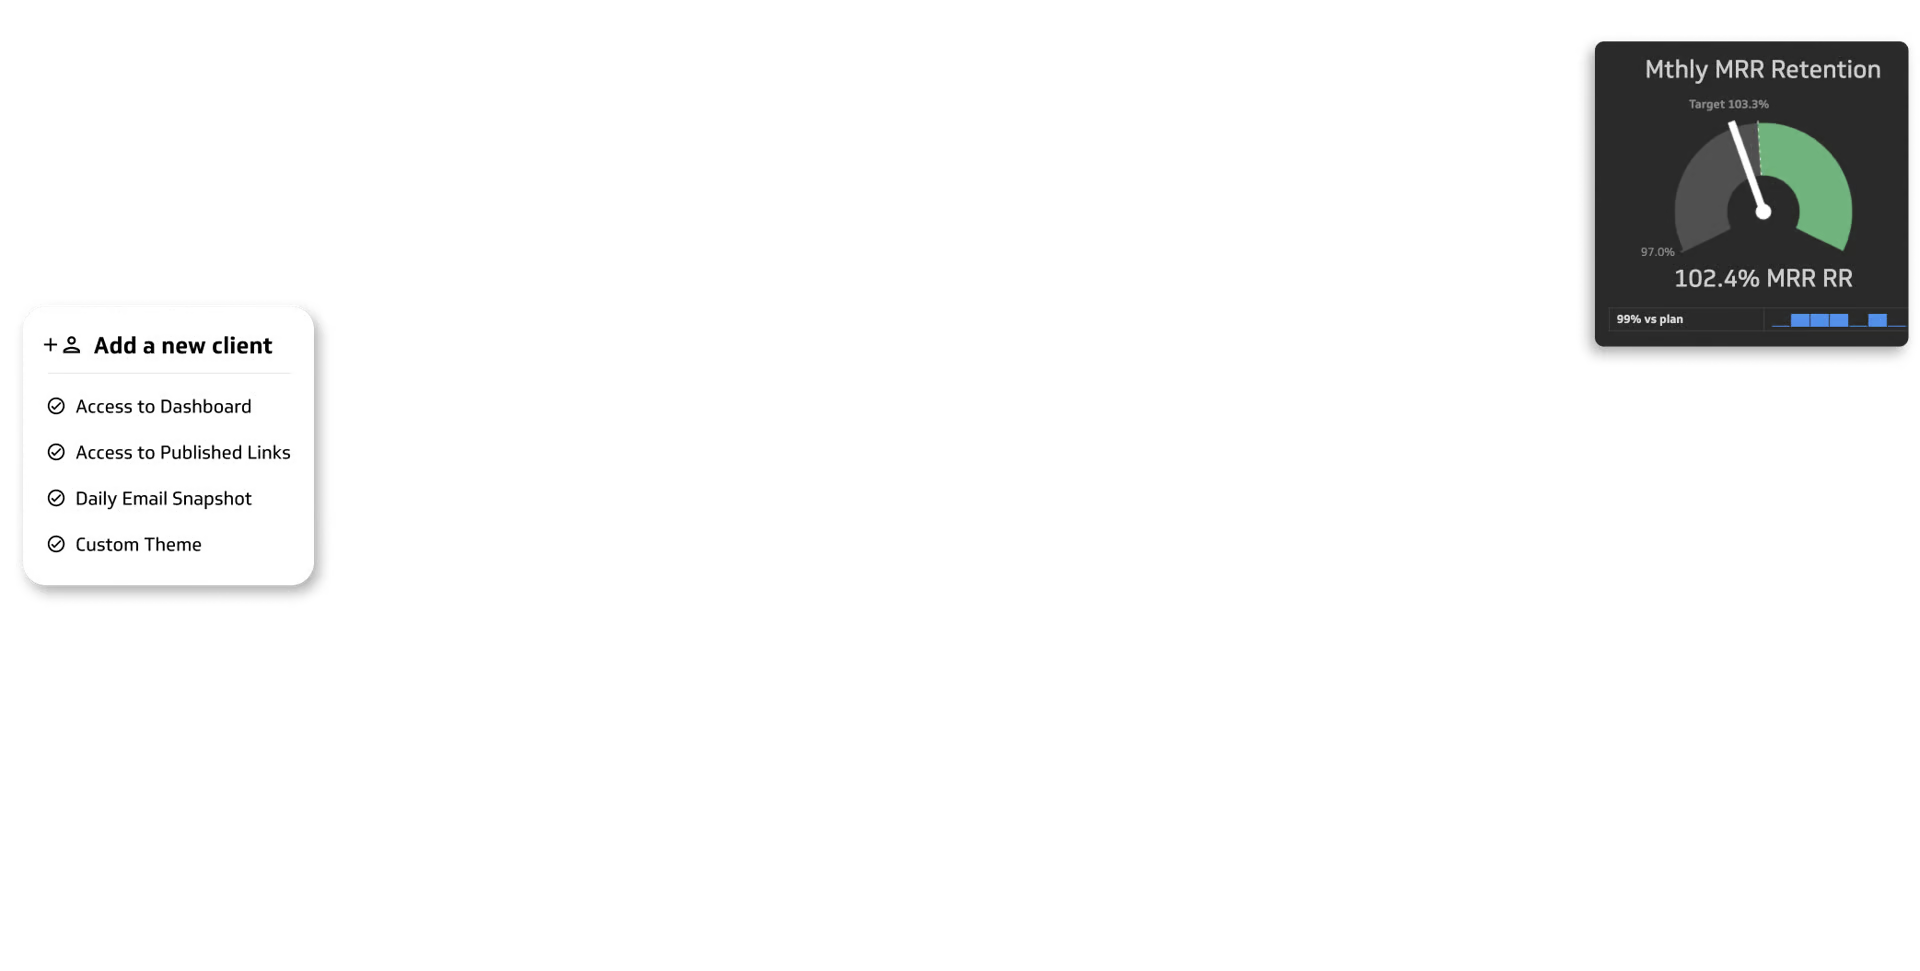
Centralized control
Create, organize, and switch between client accounts with ease. Add new clients, adjust access, and manage everything inside your partner account.

Standard or custom dashboards
Build once, deliver anywhere. Use shared templates for all clients or create unique dashboards within individual accounts.

Free trials and flexible billing
Offer free trials to showcase value, then choose how you bill — manage it yourself or let Klipfolio handle it automatically.

Control and visibility
Grant team access, monitor data refreshes, and apply shared company settings across all clients for consistent, reliable reporting.
Customization and Automation
Klipfolio gives you full control over branding, domains, and automation so you can deliver a seamless experience at scale.
Learn more
Make it your own
Customize every visual detail — from colours and logos to layouts and terminology — for a fully-branded client experience.

Custom domains
Give clients a white-label login with your own URL and keep the Klipfolio name behind the scenes.

Template-driven scale
Reuse your best dashboards and import updates from client accounts instantly — no rebuilding required.

Automate everything
Use Klipfolio’s API to streamline setup, updates, and sharing, saving hours of repetitive work.
Sharing & Publishing
From secure logins to automated emails and embedded visualizations, Klipfolio gives you flexible ways to share dashboards, all powered by live data.
Learn more
Controlled access
Grant the right people the right permissions. Assign roles, set access levels, and manage who can view or edit dashboards across every client account.
Email and links
Send automated email reports or share secure published links — perfect for scheduled updates, quick client check-ins, or executive summaries.

Embeddable visualizations
Embed visualizations or live dashboards into your client portal, website, or internal tools with flexible presentation and integration options.

Real-time visibility
Give clients self-serve access to always-up-to-date dashboards. Live data refreshes ensure they’re never looking at old numbers.
Klips Power for Partners
Build custom dashboards and reports that showcase your clients’ data beautifully — giving you flexibility, speed, and complete control over every visualization.
Learn more
Connect to virtually any data
Bring all your clients’ data together with 100+ pre-built integrations and flexible API connections.

From messy to masterpiece
Turn raw, messy data into polished visualizations with powerful formulas, functions, and transformations.

Dashboards your way
Build and customize dashboards exactly the way you — and your clients — want them.

Serve more and scale fast
Scale from a few clients to hundreds with powerful automation, reusable dashboards, and our management API.
Your Klipfolio Partner Toolkit
Everything you need to learn, promote, and grow as a Klipfolio Partner — from certification and resources to community and co-marketing opportunities.

Jumpstart Guide for Partners
Your quick-start guide to setting up client accounts and dashboards and creating a customized look-and-feel.

Partner Docs & Help Center
Access documentation designed for partners — from client management and white-labelling to API automation and billing options.

Expand Your Reach
Team up with Klipfolio on co-marketing campaigns, blog posts, case studies, podcasts, and partner spotlights to reach new audiences and showcase your capabilities.

Klipfolio Certification
Validate your expertise, get the recognition you deserve, and stand out in our Partner Directory.

The Klipfolio Data Hive
Join our private Slack community to connect with other partners, share tips, and get early access to updates.

Partner Support
Need help with a technical question or client account? Our Partner Support team is here for you.