Monthly Active Users (MAU)
Monthly Active Users (MAU) measures the number of unique individuals who engage with a product, service, or platform within a given month — a key signal of whether your product is actually being used.
Monthly Active Users
Monthly Active Users (MAU) measures the number of unique individuals who engage with a product, service, or platform within a given month.
For SaaS teams, marketers, and product leaders, Monthly Active Users (MAU) is one of the clearest signals of whether a product is actually being used, not just installed or signed up for. This article covers what MAU means, how to calculate it, why it matters, and where it falls short.
What is Monthly Active Users (MAU)?
Monthly Active Users is a SaaS metric that counts the number of unique individuals who engage with a product or platform at least once within a calendar month. It measures active participation, not just account creation or downloads.
Understanding Monthly Active Users
MAU goes beyond installs and registrations. A user counts only when they take a meaningful action: logging in, completing a task, or interacting with a feature. That distinction matters because it tells you how many people are actually getting value from your product, not just how many signed up.
This metric tracks user logins, sessions, or other predefined engagement indicators. Over time, it shows whether your user base is growing, stable, or quietly shrinking.
A high MAU count signals that users return and find the product worth their time. A declining MAU is an early warning: something has changed, whether that's the product, the market, or the competition.
MAU also surfaces patterns. Seasonal dips, the impact of a feature launch, or the lift from a marketing campaign all show up in the monthly trend. That makes it useful not just as a health check, but as a feedback loop for product and growth decisions.
Who uses Monthly Active Users and how?
MAU is used most heavily in SaaS and social media, where recurring engagement drives revenue.
SaaS companies rely on active usage to justify subscriptions. If users aren't engaging, they churn. Tracking MAU helps product teams spot where users disengage, whether that's during onboarding, after a specific feature interaction, or following a pricing change. That insight shapes where to invest next.
Social platforms like Meta use MAU to report scale and advertiser reach. For Meta, an MAU is someone who has engaged with their platforms (Facebook, Messenger, or Instagram) via web or mobile within 30 days.
X (the platform formerly known as Twitter) moved away from MAU and now tracks monetized daily active users (mDAU): people who use the platform in a way that allows the company to present them with ads. That shift reflects how different business models prioritize different engagement signals.
How do you calculate MAU?
Calculating MAU starts with defining what "active" means for your product.
That definition varies. On a social platform, an active user might be someone who logs in, posts, or comments. In a project management tool, it might be someone who opens a task or updates a record. The right definition depends on what meaningful engagement looks like in your context.
Once you have a definition:
- Pull data from your analytics platform or database for the calendar month
- Filter for users who met your activity definition at least once
- Deduplicate so each person is counted once, regardless of how many times they were active
- Report the count as your MAU for that period
A few things to watch:
- Shared devices can inflate counts if multiple people use the same account or hardware
- Bot traffic should be excluded from your active user count
- Consistency matters more than precision: use the same definition and methodology every month so your trend data is comparable
There is no universal formula, but the logic is straightforward:
MAU = Count of unique users who performed [defined action] at least once in the month
Advantages of using MAU as a KPI
Easy to calculate and understand
MAU requires only basic data tracking and analysis. Unlike Customer Lifetime Value or Net Promoter Score, it doesn't involve complex modelling or assumptions about future behaviour. Most analytics tools surface it automatically.
That simplicity also makes it easy to communicate. Founders, investors, and team members who aren't steeped in data can follow MAU trends and understand what they mean for the business.
Create custom dashboards for you and your team.
Get started with KlipsProvides more context than total user count
Total registered users is a vanity metric. MAU is more honest. If you have 90,000 registered accounts but only 17,000 active users in a given month, that gap tells you something important about how your product is actually being used.
MAU also reveals how engagement shifts over time, helping you understand whether a product update drove more usage, whether a cohort of users has gone quiet, or whether seasonal patterns are at play.
Shows user growth and overall business health
Tracking MAU month over month gives you a reliable signal of trajectory. Consistent growth suggests your acquisition and retention efforts are working together. A plateau or decline prompts the right questions: Is the product meeting expectations? Is churn outpacing new user growth?
When you're evaluating whether to expand into a new market or launch a new product line, MAU trend data gives you a grounded view of demand and momentum, not just a snapshot.
Limitations of using MAU
No standardized definition
There is no industry-wide standard for what counts as "active." One company might count any login; another might require a specific action. That inconsistency makes MAU comparisons across companies unreliable.
When benchmarking against competitors or evaluating a partner's claims, always ask how they define an active user. The number means nothing without the definition behind it.
It may not reflect the depth of engagement
A user who logs in once a month and a user who completes ten tasks a day both count as one MAU. The metric doesn't distinguish between shallow and deep engagement.
If your product's value depends on frequent, meaningful use, MAU alone won't tell you whether users are actually getting that value. Pairing MAU with metrics like Daily Active Users (DAU), session length, or feature adoption gives a more complete picture.
Tracking MAU without the manual work
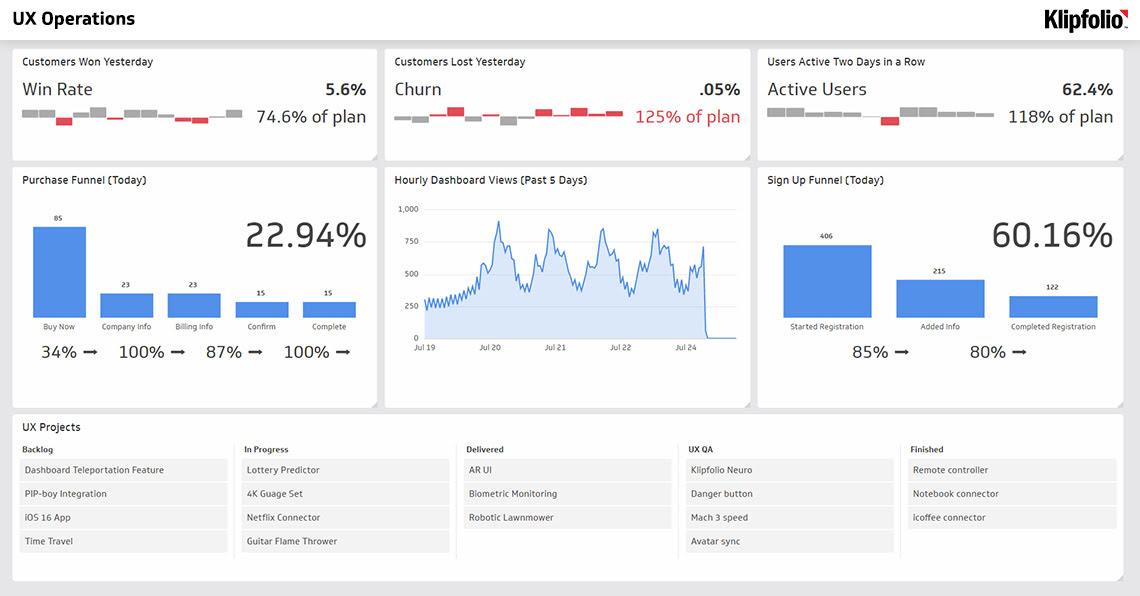
Pulling MAU from your database each month is straightforward, but keeping it visible to the people who need it requires a bit more. A dashboard that surfaces MAU alongside related metrics like DAU, churn rate, and new signups means your team sees the full picture without anyone having to compile a report.
Klipfolio connects to the tools where your user data lives and keeps those numbers current, so the trend is always in front of you, not buried in a spreadsheet or waiting for someone to pull it.
Bottom line
Monthly Active Users is a reliable, easy-to-understand signal of whether your product is being used and whether that usage is growing. It won't tell you everything on its own, but as part of a broader set of key performance indicators (KPIs), it gives leaders a clear read on product health and user engagement.
Define "active" clearly, apply that definition consistently, and track MAU alongside complementary metrics. That combination gives you the confidence to act on what the numbers are telling you.