Salesforce
Salesforce is a leading customer relationship management (CRM) platform used by sales teams to manage leads, opportunities, and pipeline. Connect Salesforce to Klipfolio to build real-time dashboards that surface the metrics your team actually needs — without manual exports.
Track all your Salesforce KPIs in one place
Sign up for free and start making decisions for your business with confidence.
Pulling your Salesforce CRM data into a live dashboard takes minutes — and eliminates the manual exports that slow your team down.
How to connect Salesforce to Klipfolio
Klipfolio connects to Salesforce via OAuth. Before you begin, confirm your Salesforce account has the necessary permissions.
- In Klipfolio, open the Connector Gallery and select Salesforce (or Salesforce Sandbox for sandbox environments).
- Sign in to Salesforce and grant Klipfolio permission to access your account data.
- Choose your retrieval method: Salesforce Report, Simple SOQL Query, or Advanced SOQL Query.
- Select your report or configure your query, preview the returned data, and click Continue.
- Name your data source, set a refresh rate, and click Save.
View the step-by-step setup guide
Top reasons to use Klipfolio for Salesforce dashboards
Every Salesforce instance is different. Klipfolio is built for that reality.
Your CRM, your metrics. Salesforce is built on custom reports and fields. Klipfolio lets you pull exactly the data you need — pipeline value, lead velocity, close rates — and present it the way your team actually works.
Real-time visibility for the whole sales org. Display live Salesforce data on a TV dashboard so every rep and manager sees the same numbers at the same time. No more stale screenshots in Slack.
Flexible querying without SQL expertise. Use Simple SOQL mode to build queries with drop-down menus — no query language required. Switch to Advanced SOQL when you need to join objects or pull from history records like OpportunityHistory.
Distribution that fits your workflow. Share dashboards via public links, scheduled email snapshots, or embedded views. See live examples: Monthly Sales Dashboard and Sales Leaderboard.
Custom visualizations built for sales. Use the Klip Editor to design charts, leaderboards, and scorecards tailored to your custom sales dashboard — not a generic template.
From Salesforce to dashboard
| What you do in Salesforce | What Klipfolio adds |
|---|---|
| Run and export reports manually | Automated dashboards that refresh on your schedule |
| View data inside Salesforce only | Share live dashboards via links, email, or TV display |
| Build standard reports with limited layout options | Custom visualizations using your exact fields and metrics |
| Check individual rep activity one record at a time | Sales leaderboards that motivate your team in real time |
Stop exporting CSVs. Start sharing dashboards your whole sales team can act on.
Use pre-built Salesforce metrics
Assemble a Salesforce dashboard by selecting pre-built metrics from the Klip Gallery.
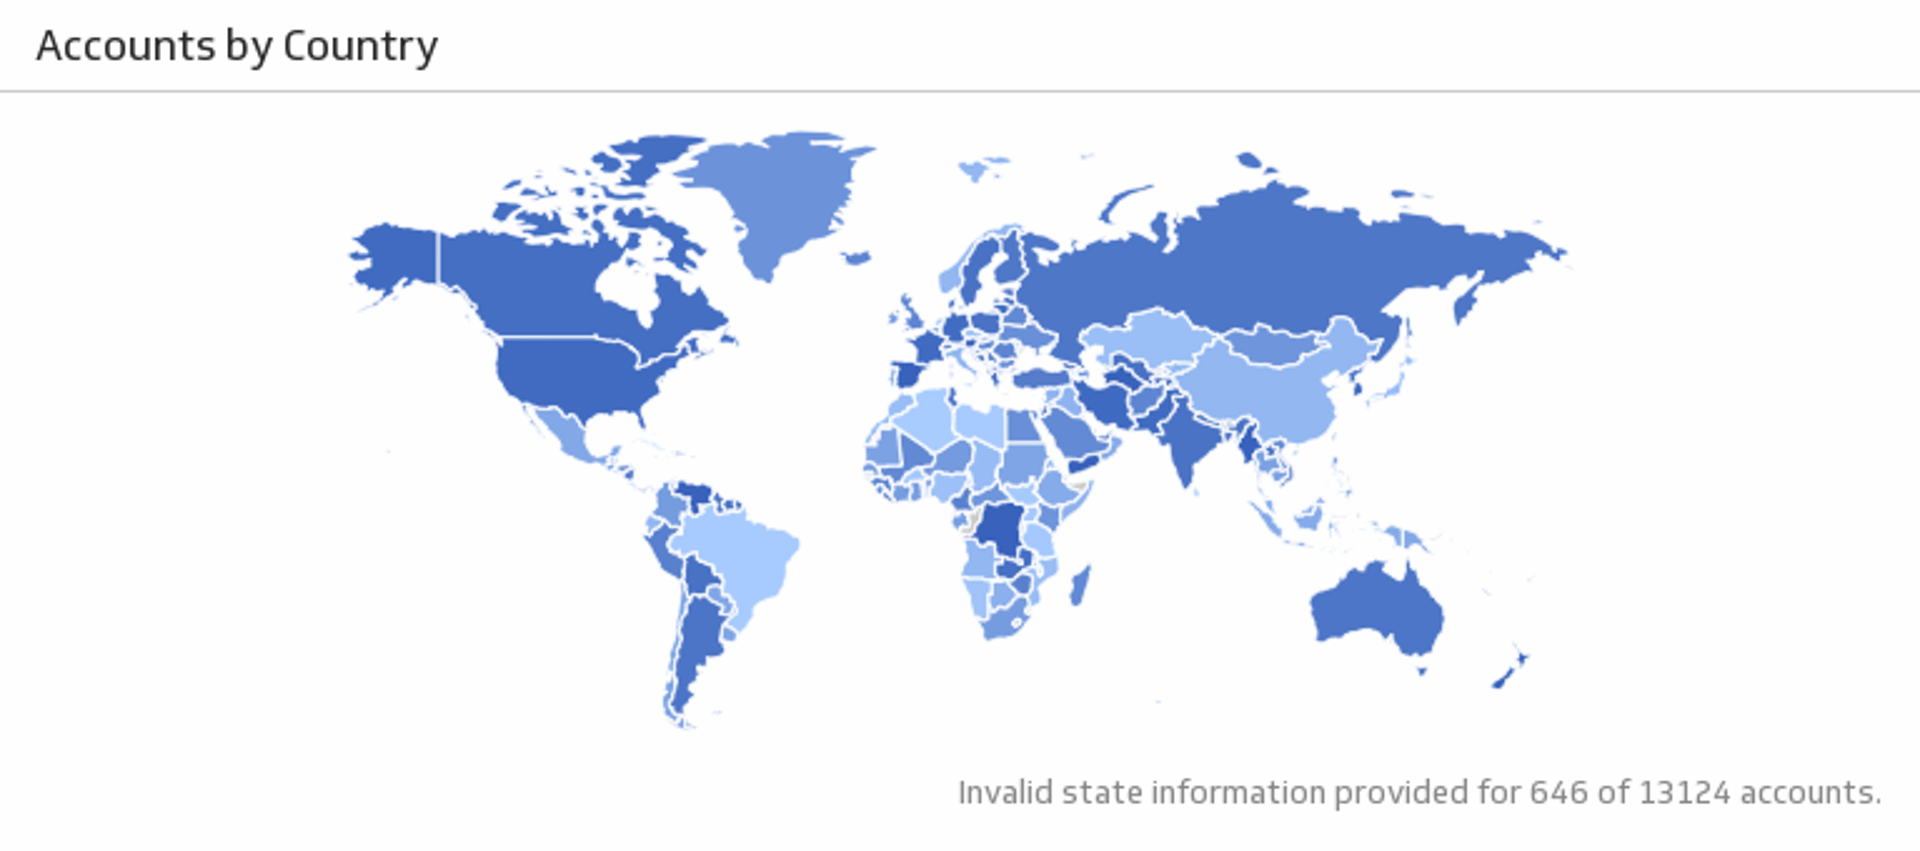
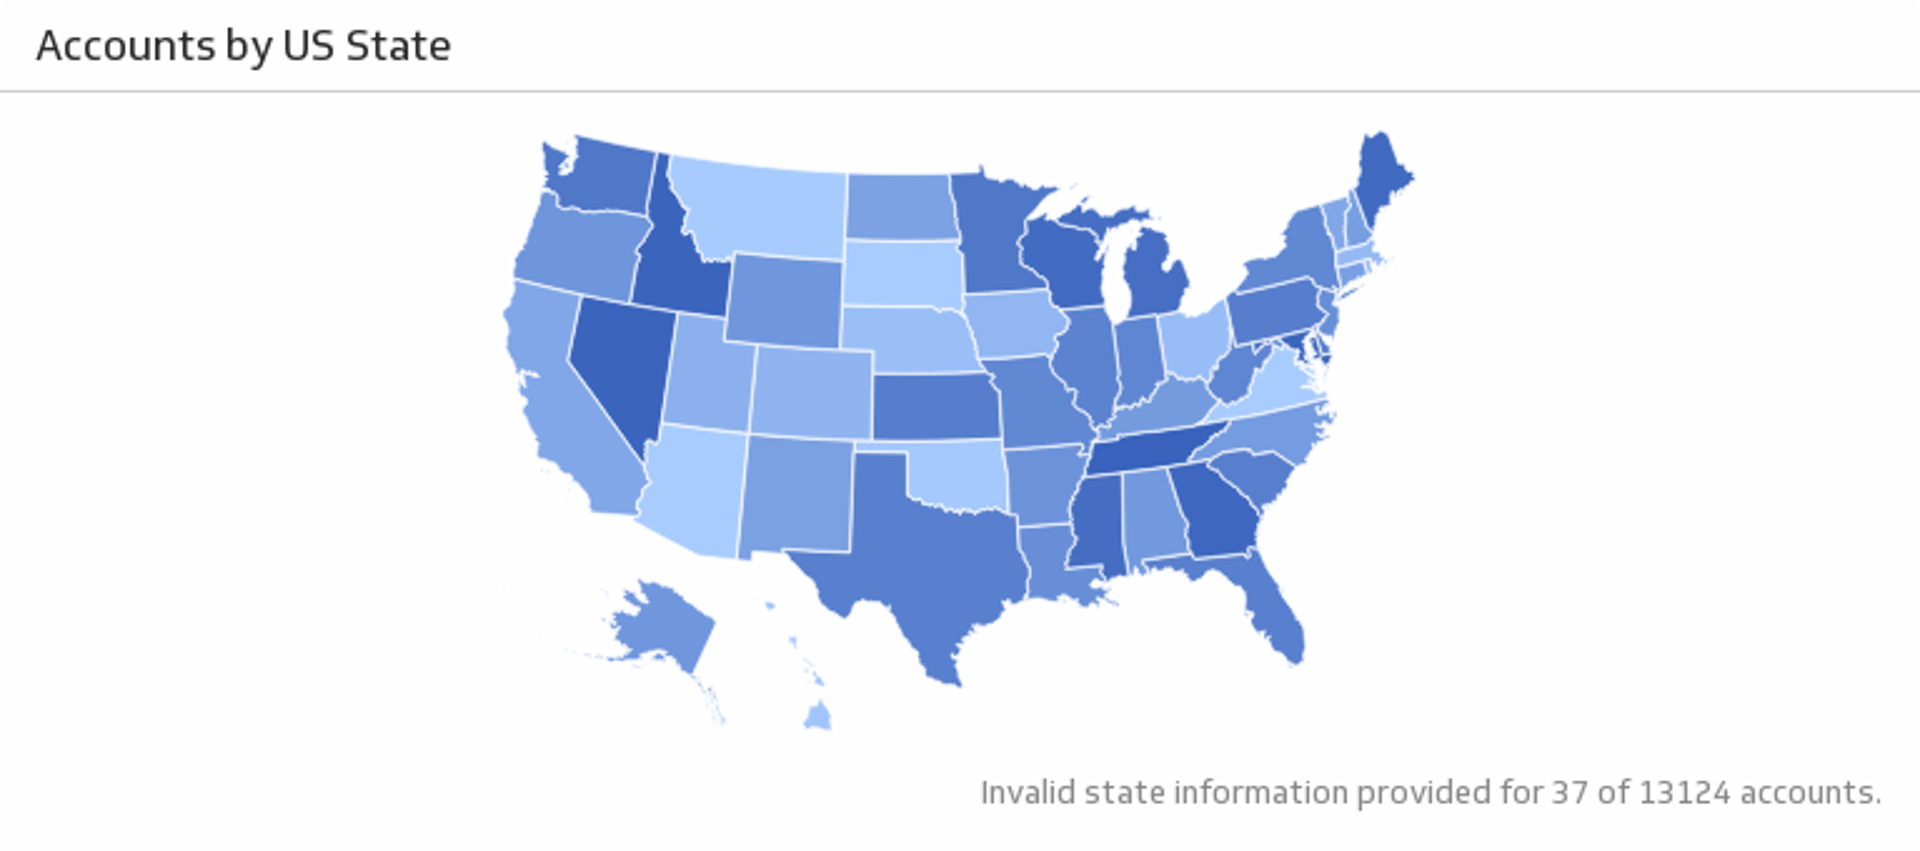
Accounts by U.S. State
See the location of your U.S. Salesforce accounts.
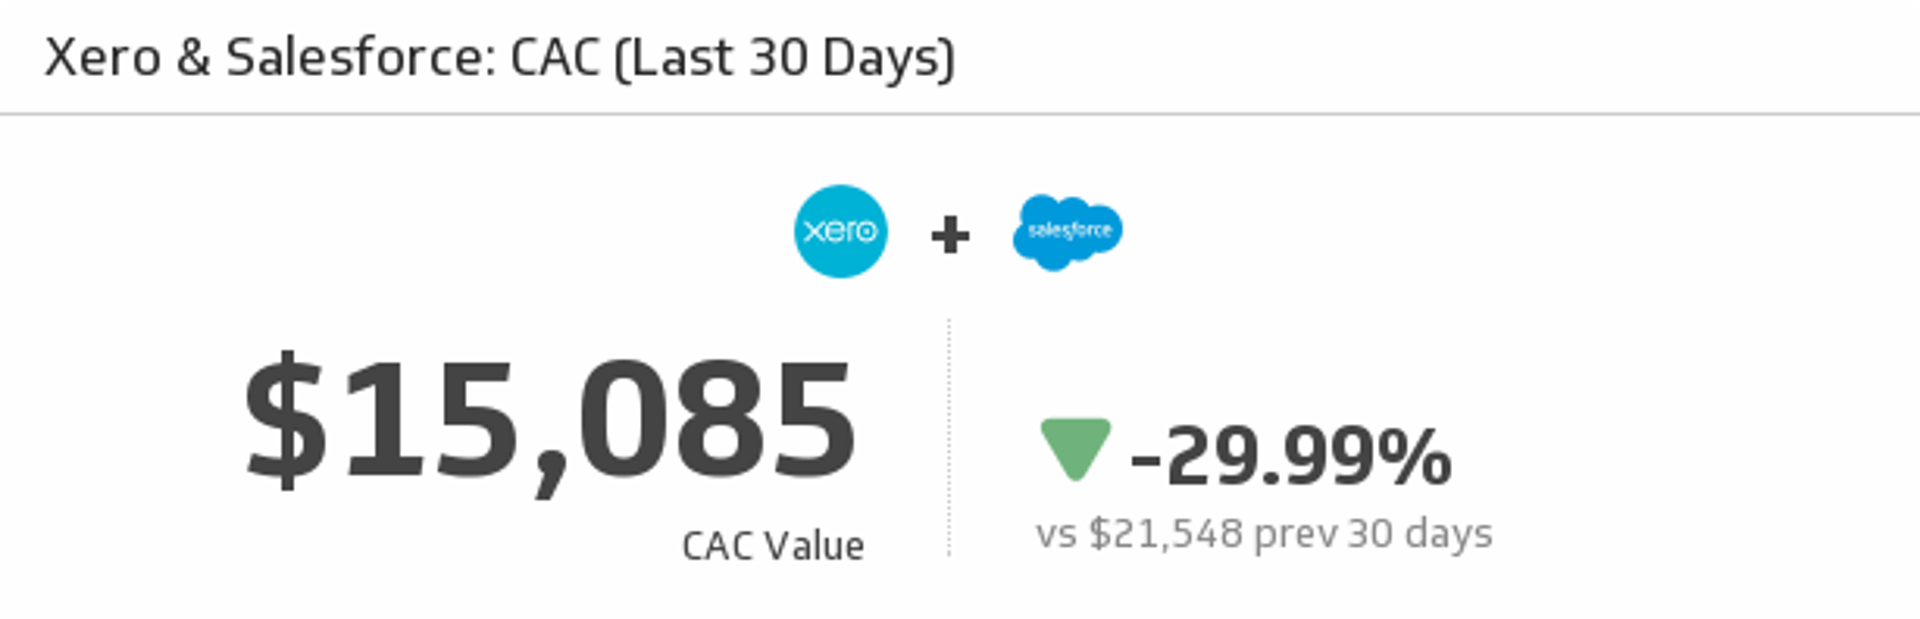
CAC (Last 30 Days)
Let this Klip address the most important question on your marketing team - what is our cost to acquire a customer (CAC)? This Klip uses your monthly Xero and Salesforce data to answer that very question.
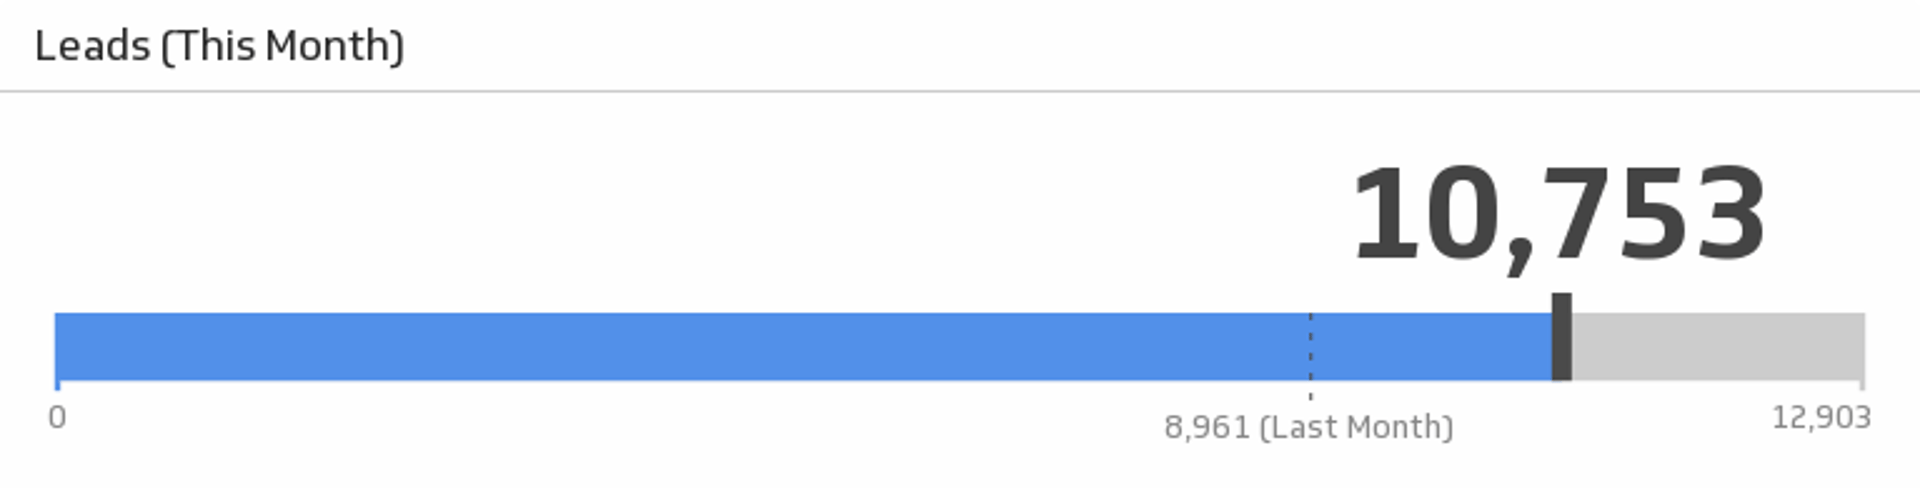
Leads This Month
Monitor your leads this month and see how the number compares to the previous month.
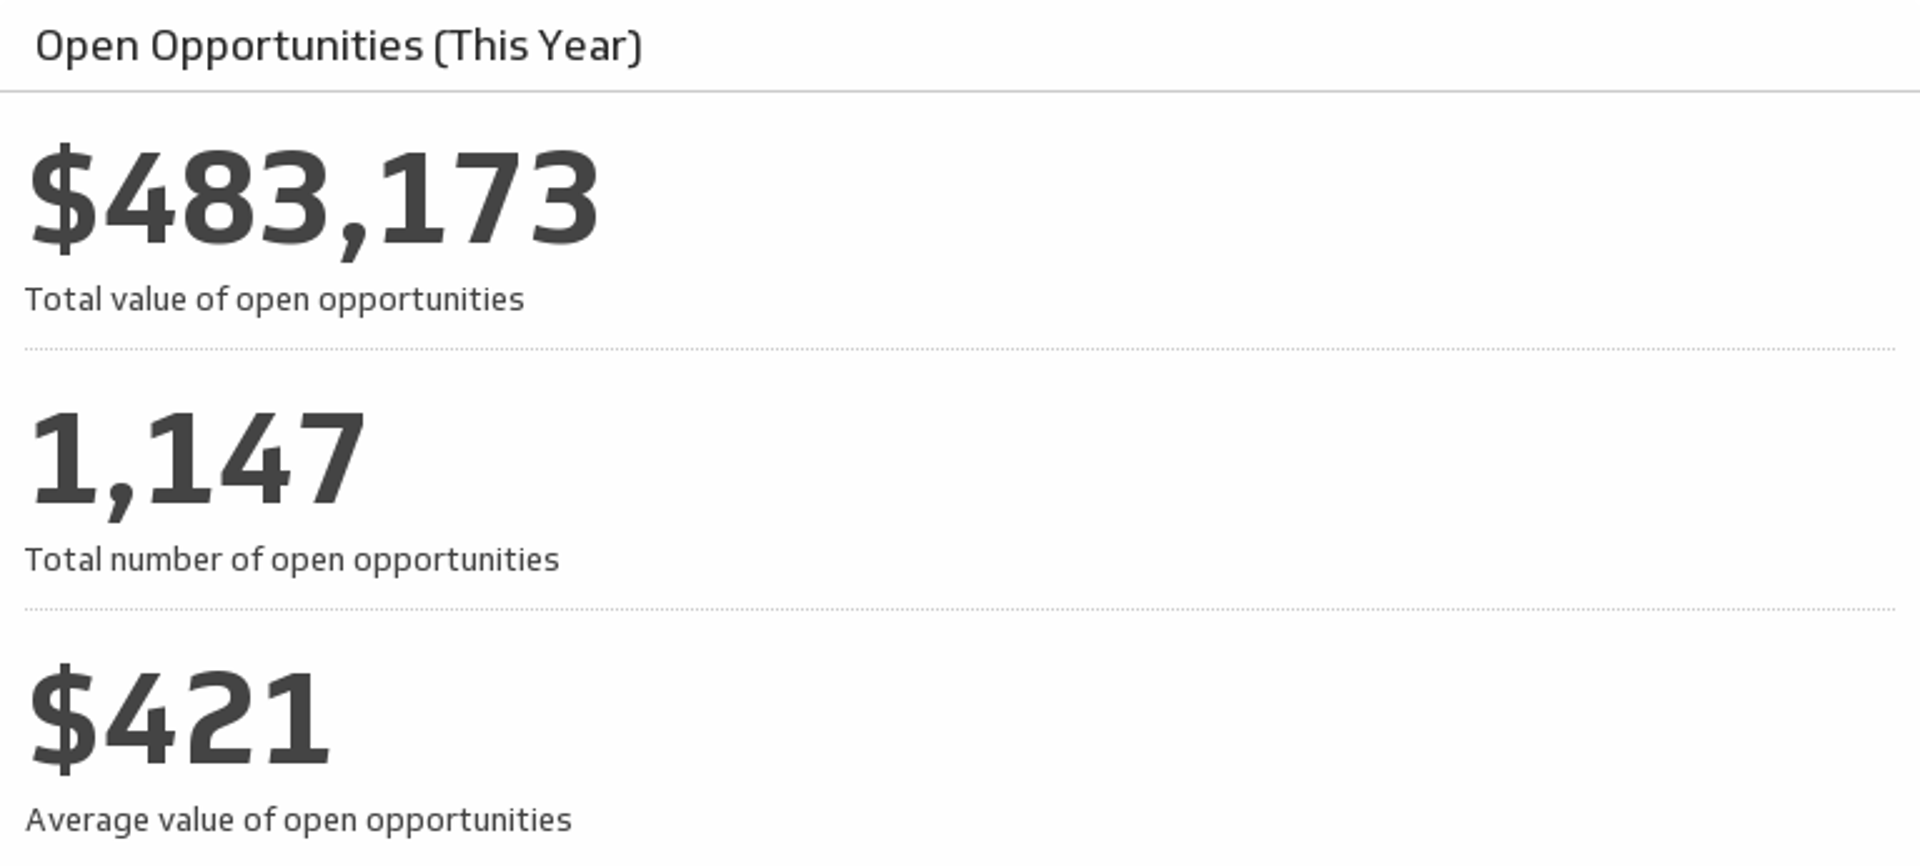
Open Opportunites (This Year)
Track your key metrics on open opportunities and always know what your sales potential is.
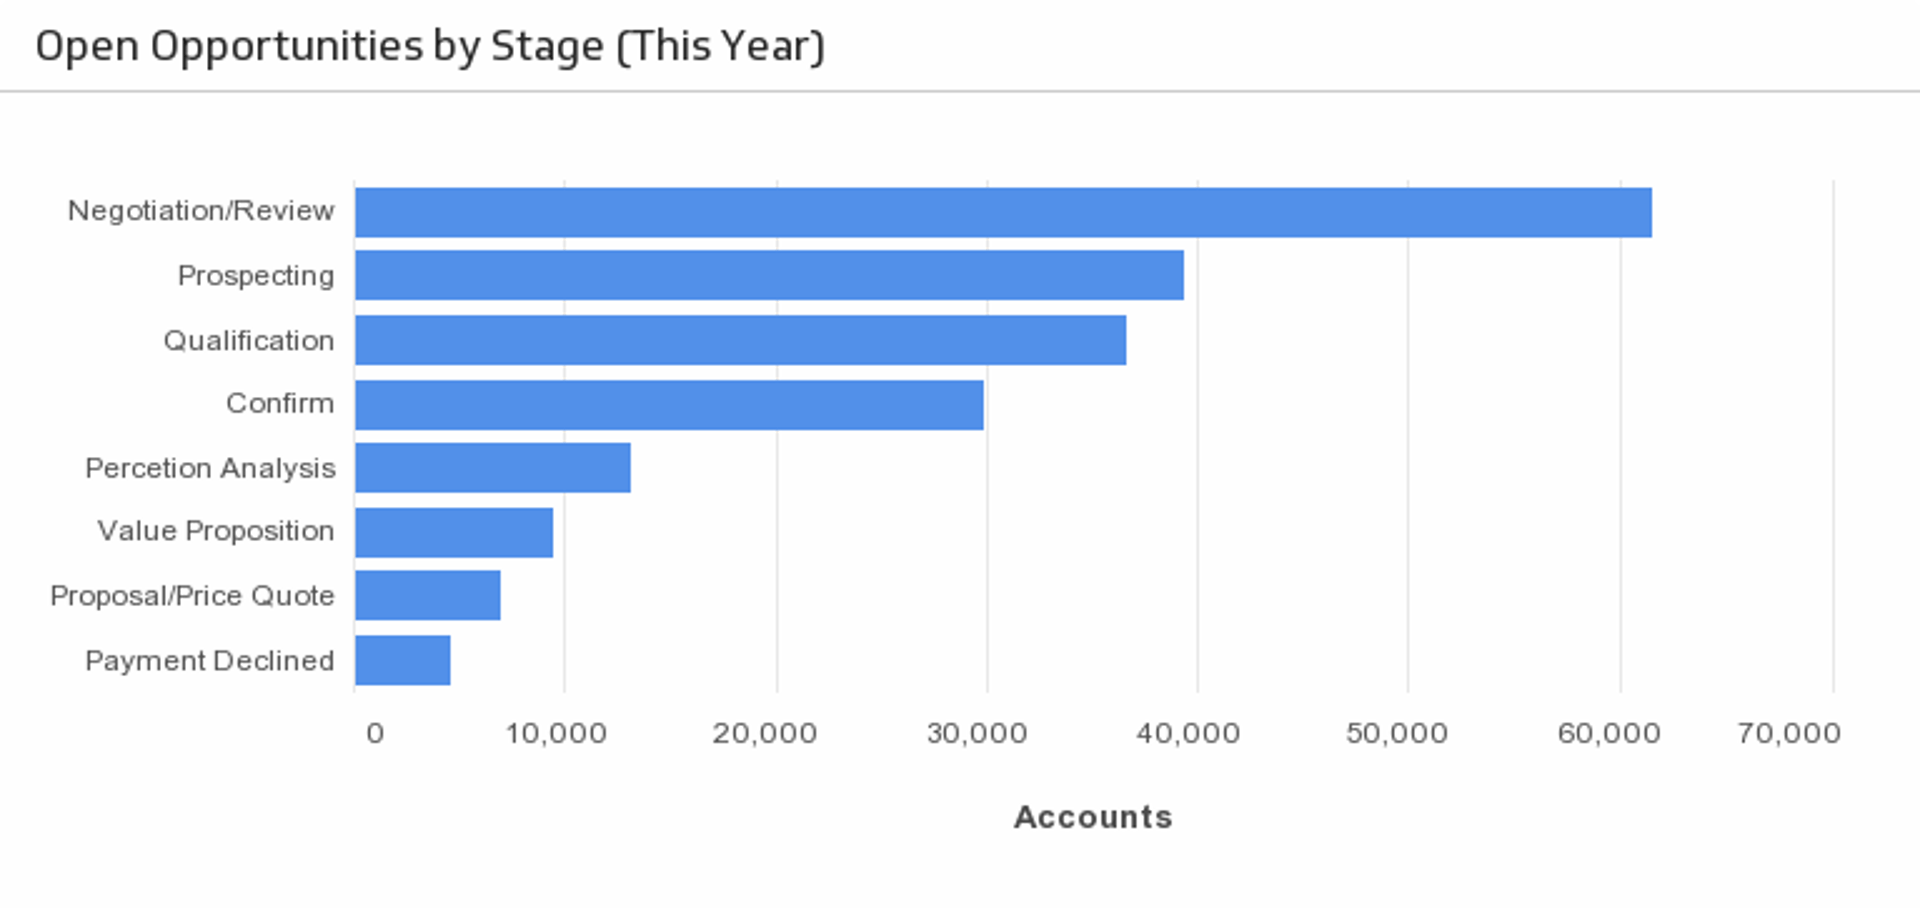
Open Opportunities by Stage
Understand the stage at which your opportunities are in the sales cycle.
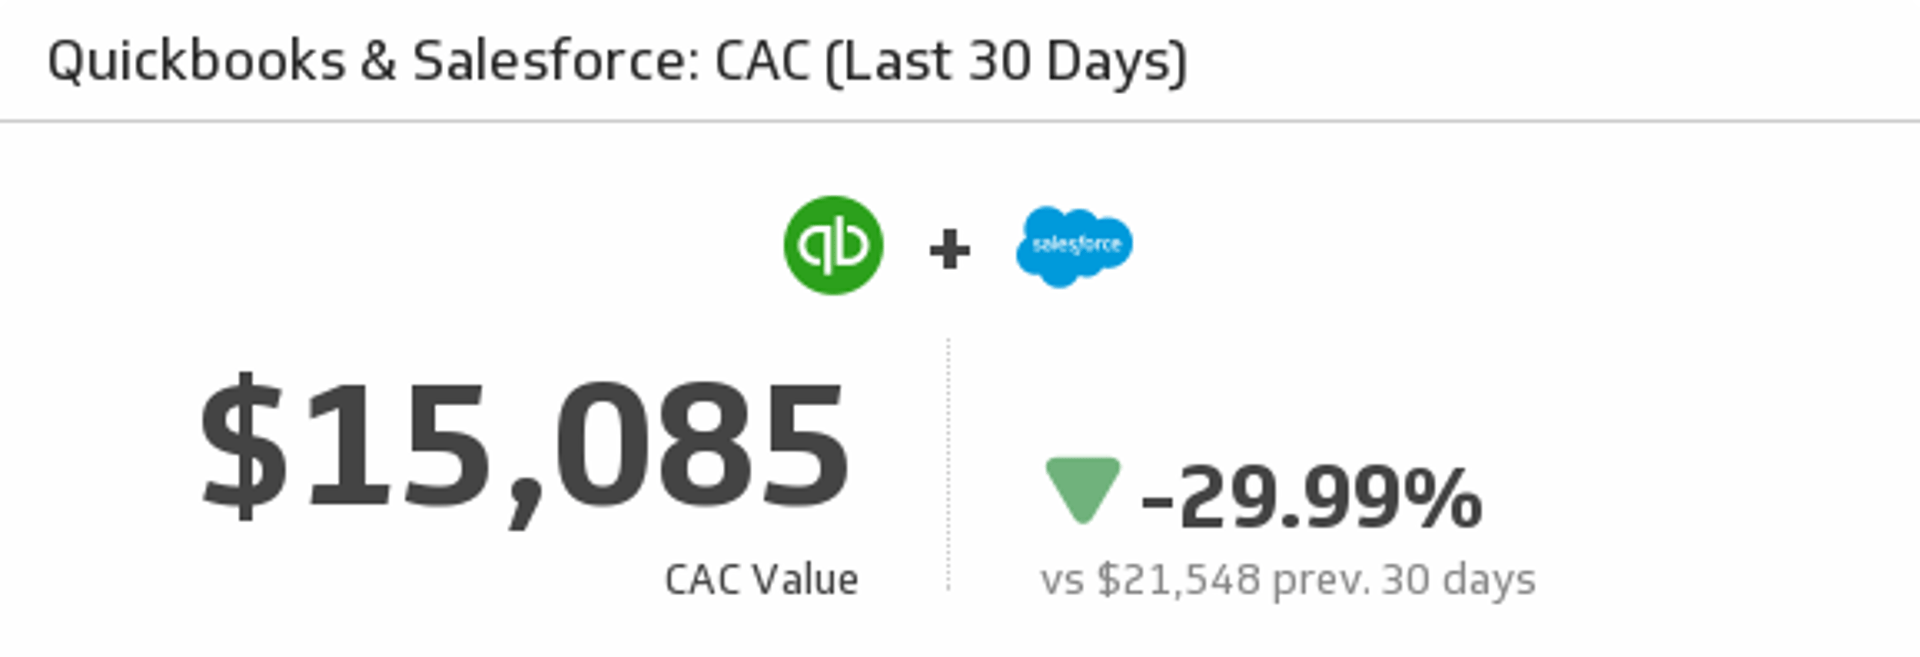
QuickBooks and Salesforce CAC (Last 30 Days)
Mash up your QuickBooks and Salesforce data to measure your Customer Acquisition Cost over the last 30 days.
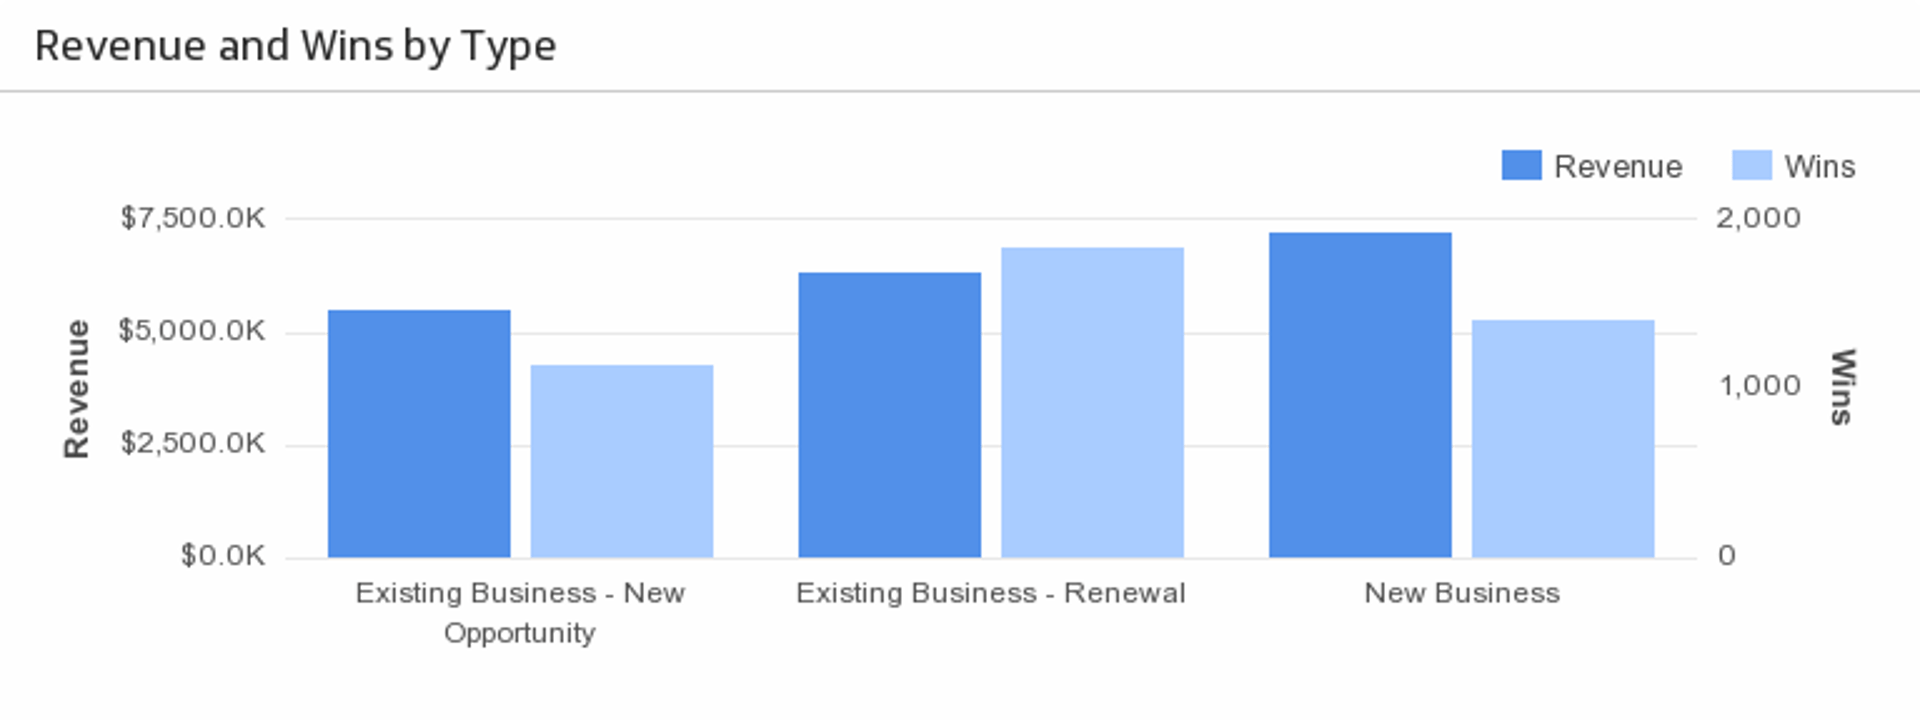
Revenue and Wins by Type
Understand what types of opportunities are bringing in the most revenue.
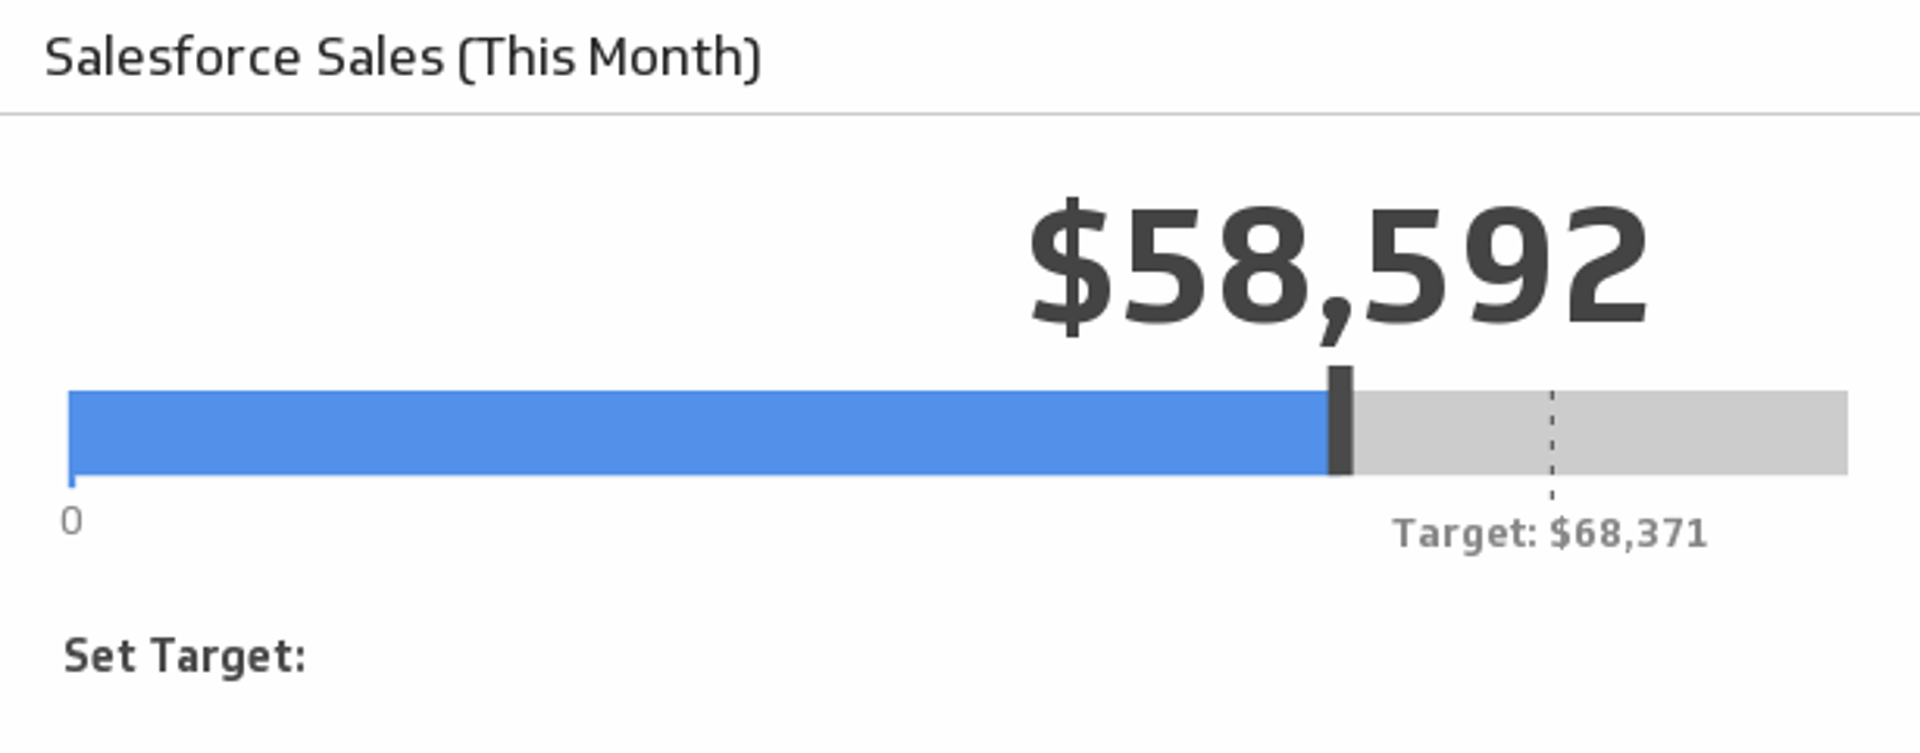
Sales This Month
Monitor your sales this month and compare to the average of the last three months.

Sales This Year
Monitor the total value of your sales since January 1st.


Use the Connector Gallery to create a custom Salesforce dashboard
With our Connector Gallery, you can create custom API queries to pull in data from your Salesforce account. Building custom queries allows you to specify the metrics and time periods that you want to track.
You can use custom queries to build out visualizations in Klipfolio. You can also combine your Salesforce data with other relevant data to create your custom dashboard.
Learn more about working with the Salesforce API and how you can start building your own Salesforce queries in Klipfolio.