Klip Gallery
Track your key performance measures with pre-built Klips. Get the ones that matter most to your business from the Gallery to your dashboard in minutes.
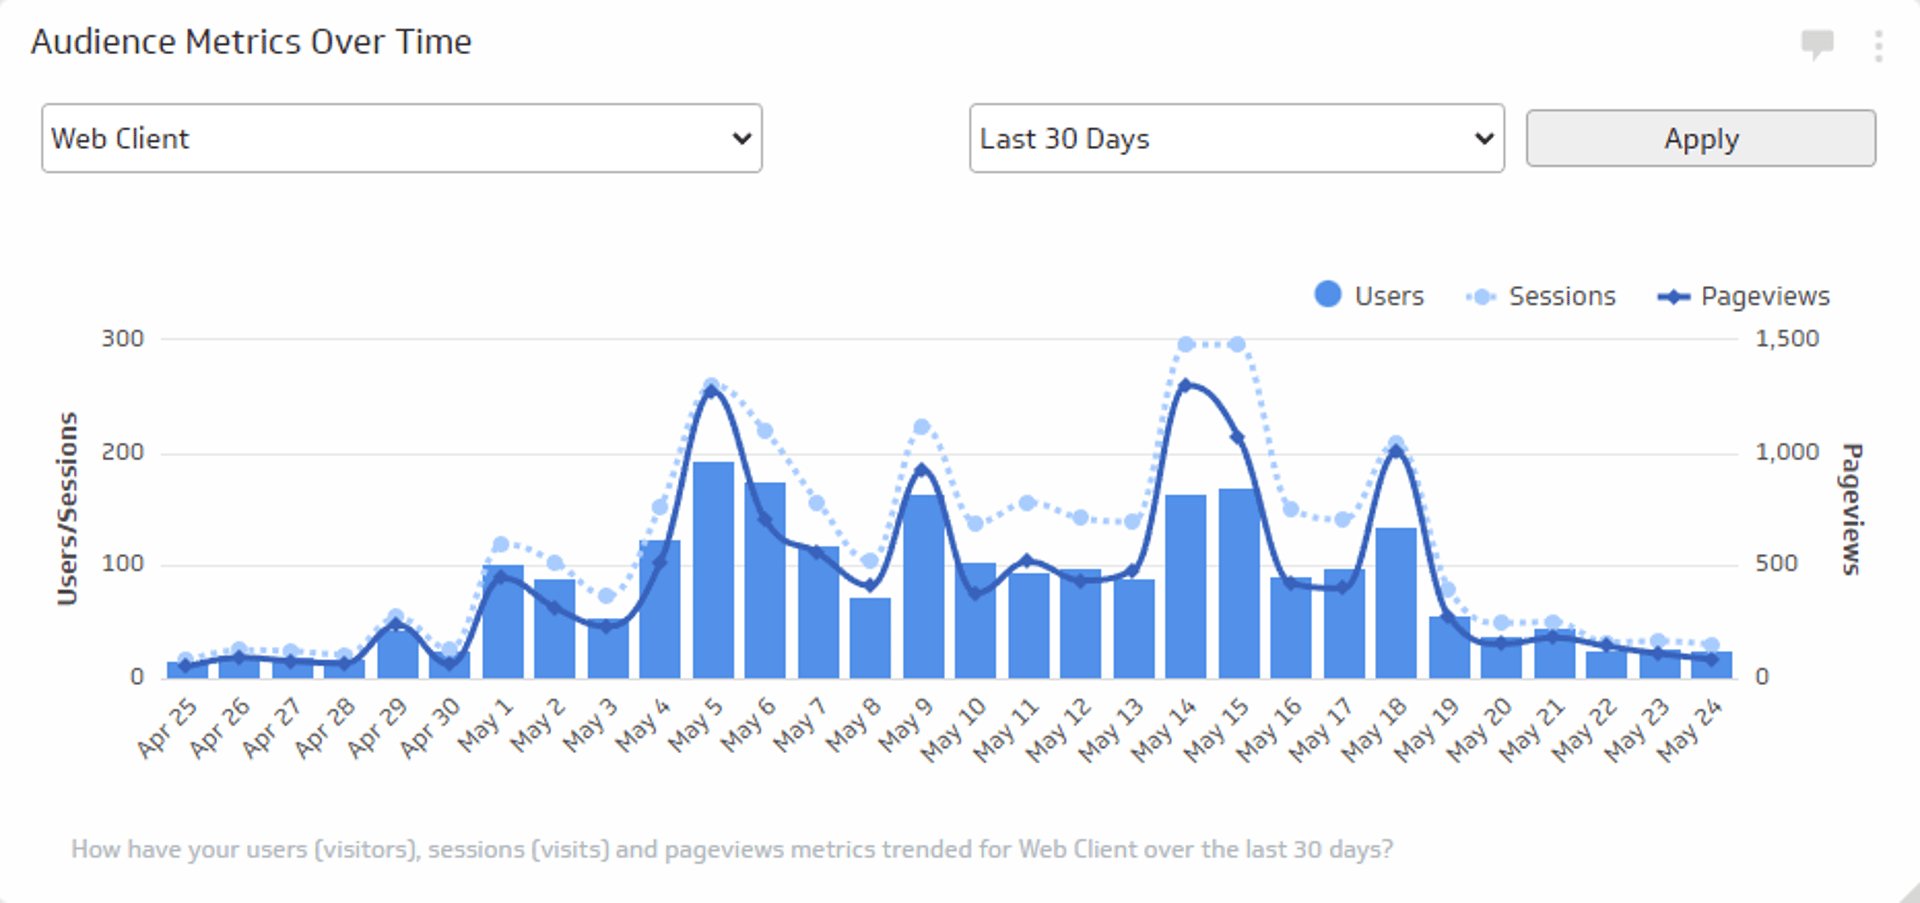
Audience Metrics Over Time
Track the total number of users, sessions, and views trend over time.
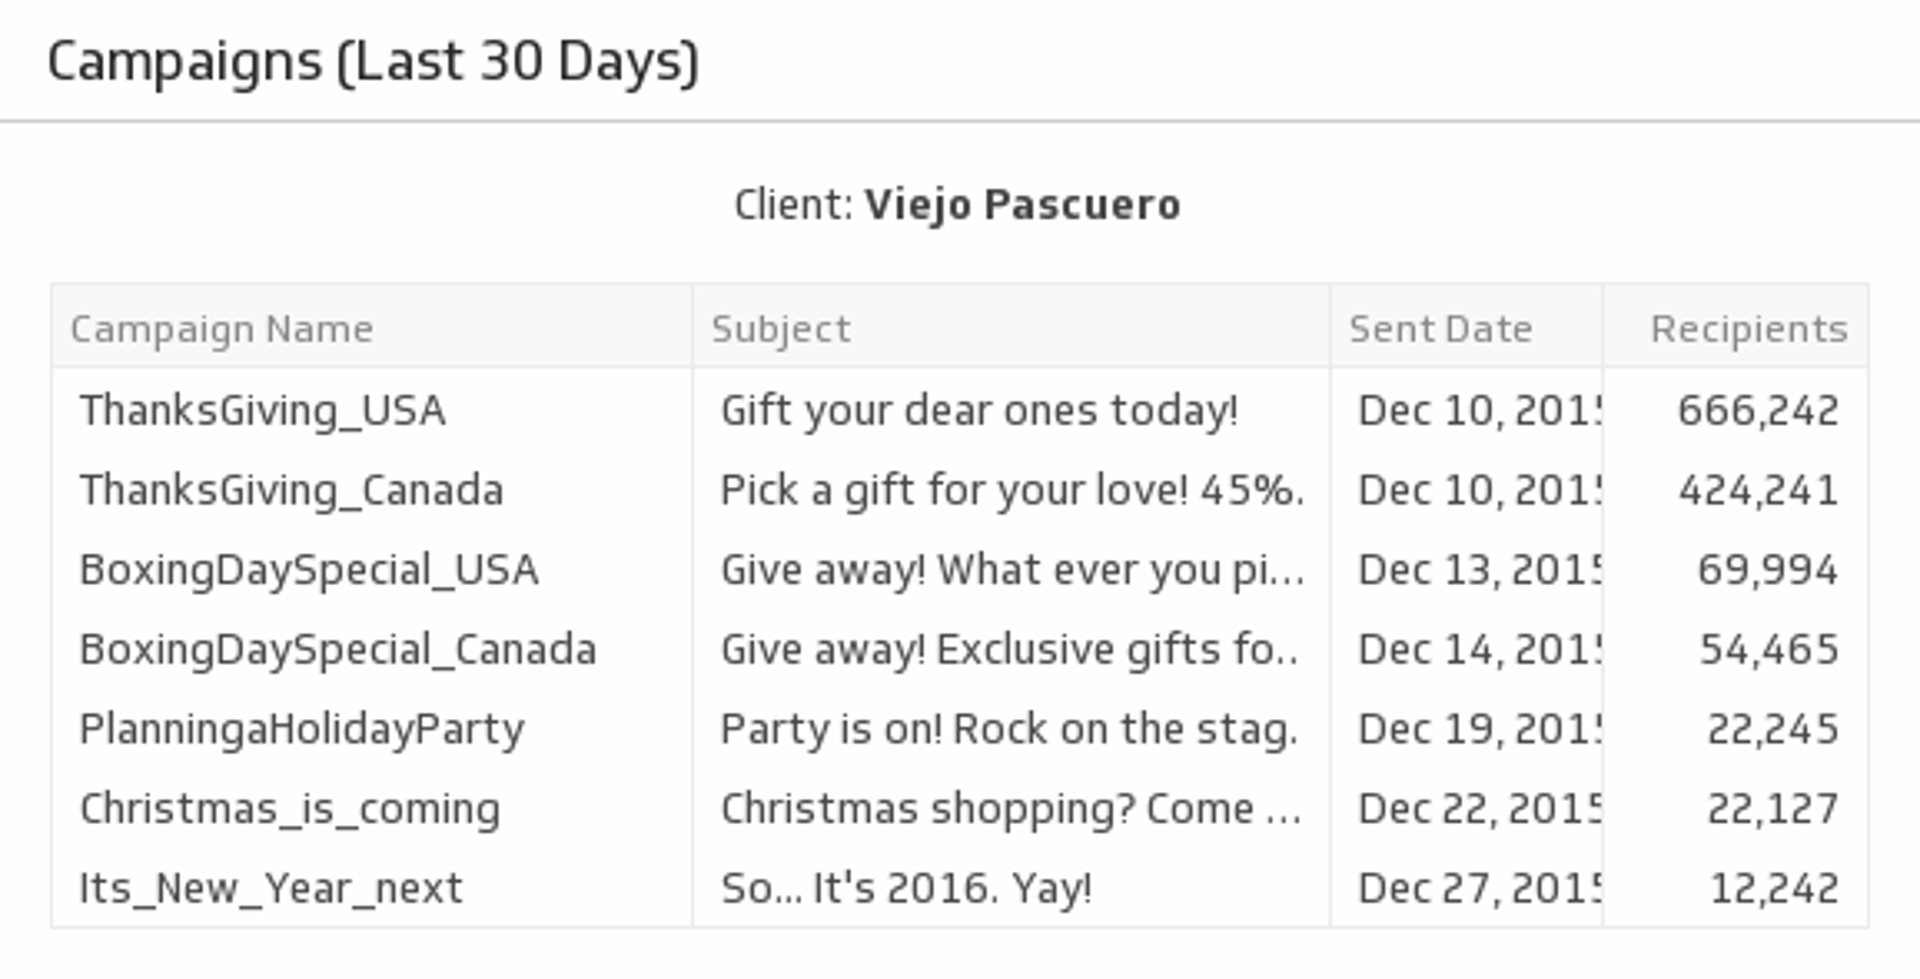
UsesCampaigns (Last 30 Days)
Never lose track of your email campaigns with a list of all your mail-outs over the past 30 days.
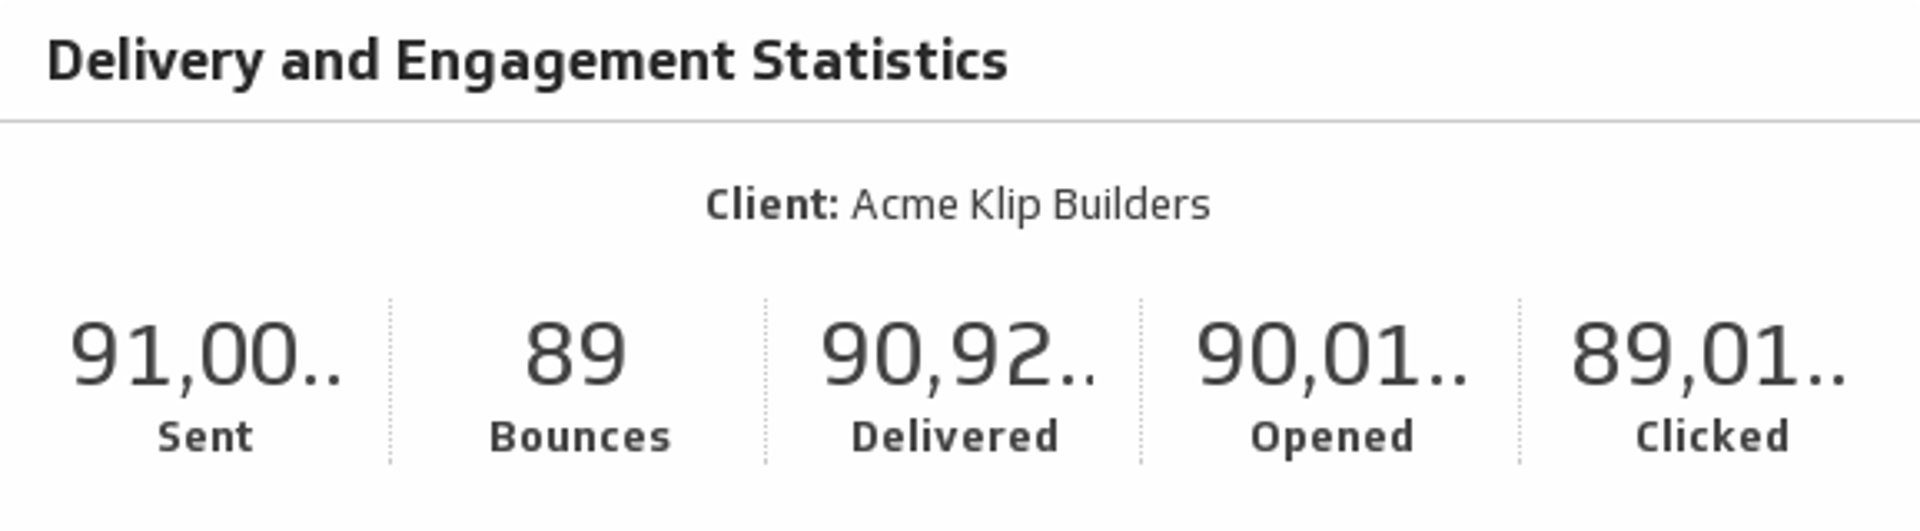
UsesDelivery and Engagement Statistics
Show the delivery and engagement statistics of your Campaign Monitor client.
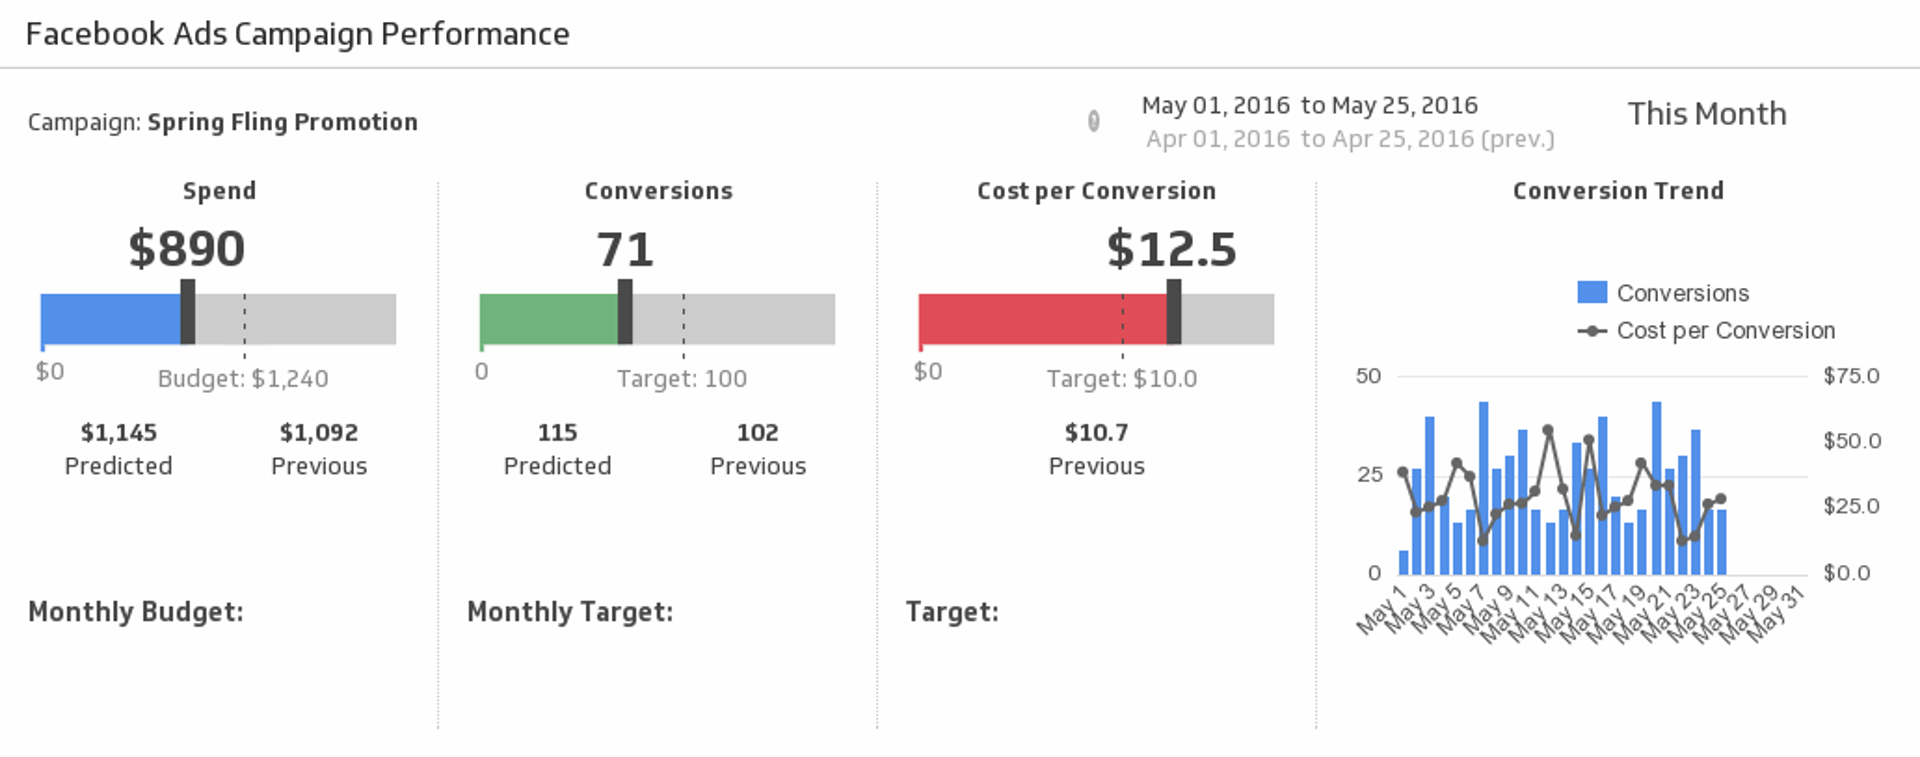
UsesFacebook Campaign Performance
Make sure your message is reaching the right audience by measuring your Facebook Ads campaign performance for the date range of your choice.
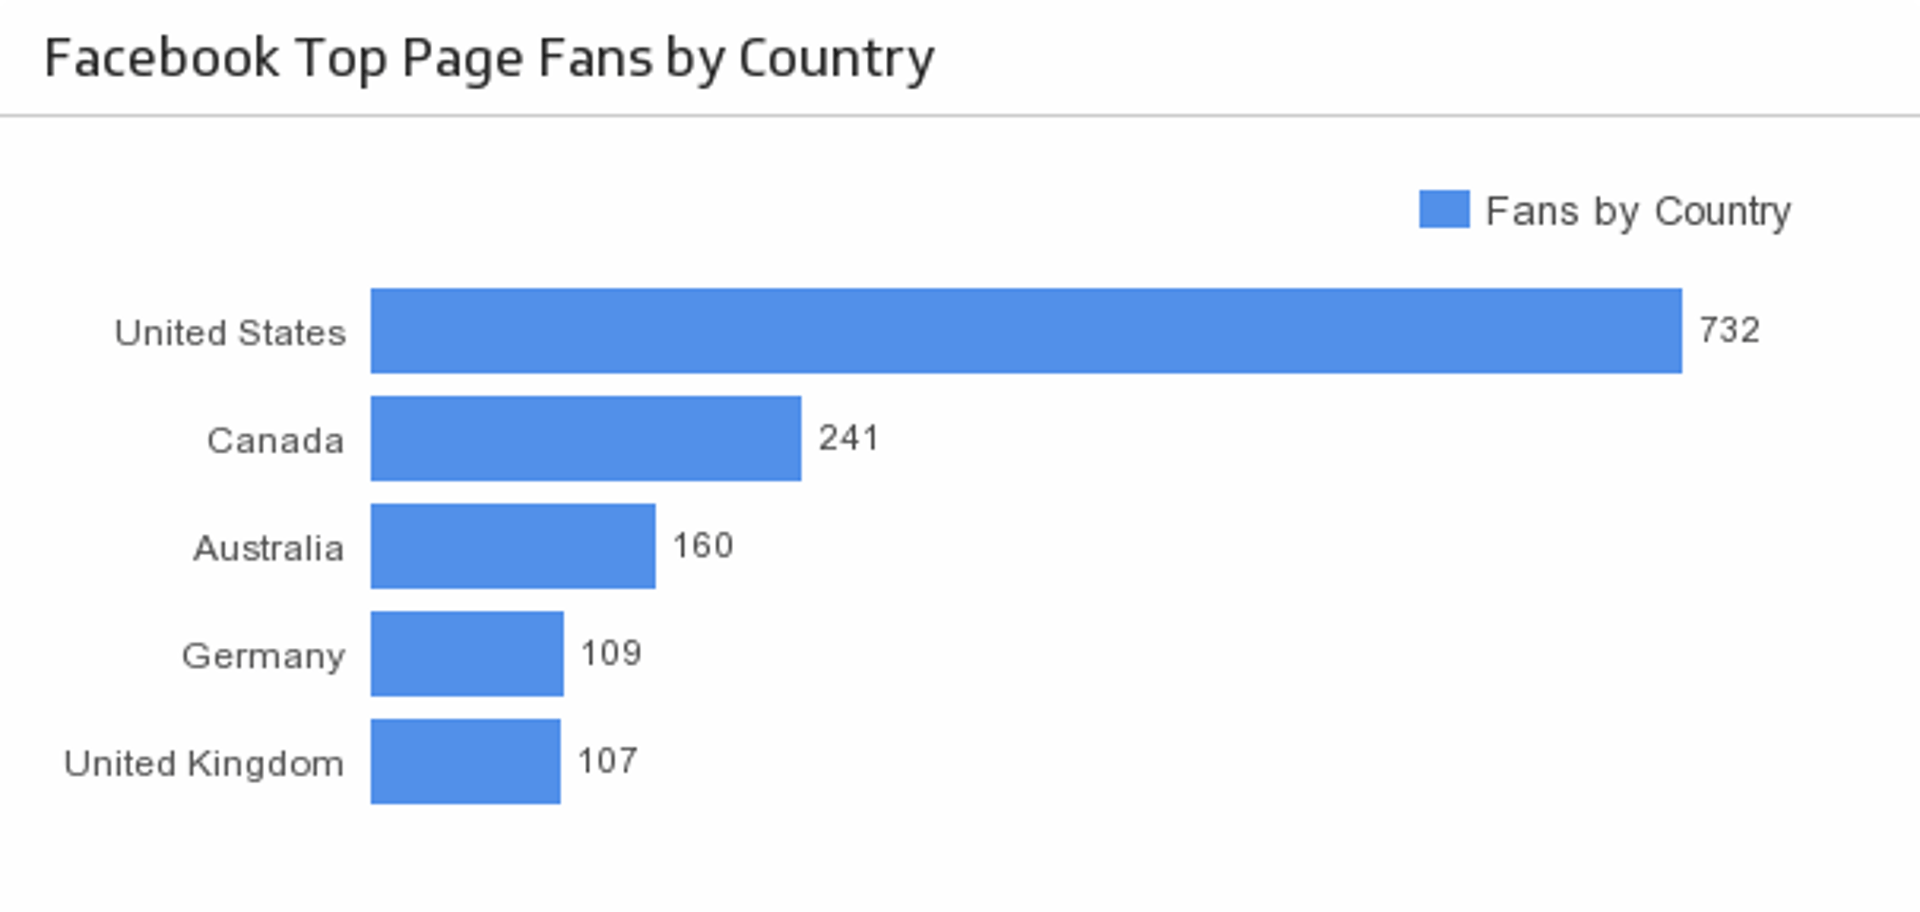
UsesFans by Country
Discover the top five countries that your Facebook fans are from.
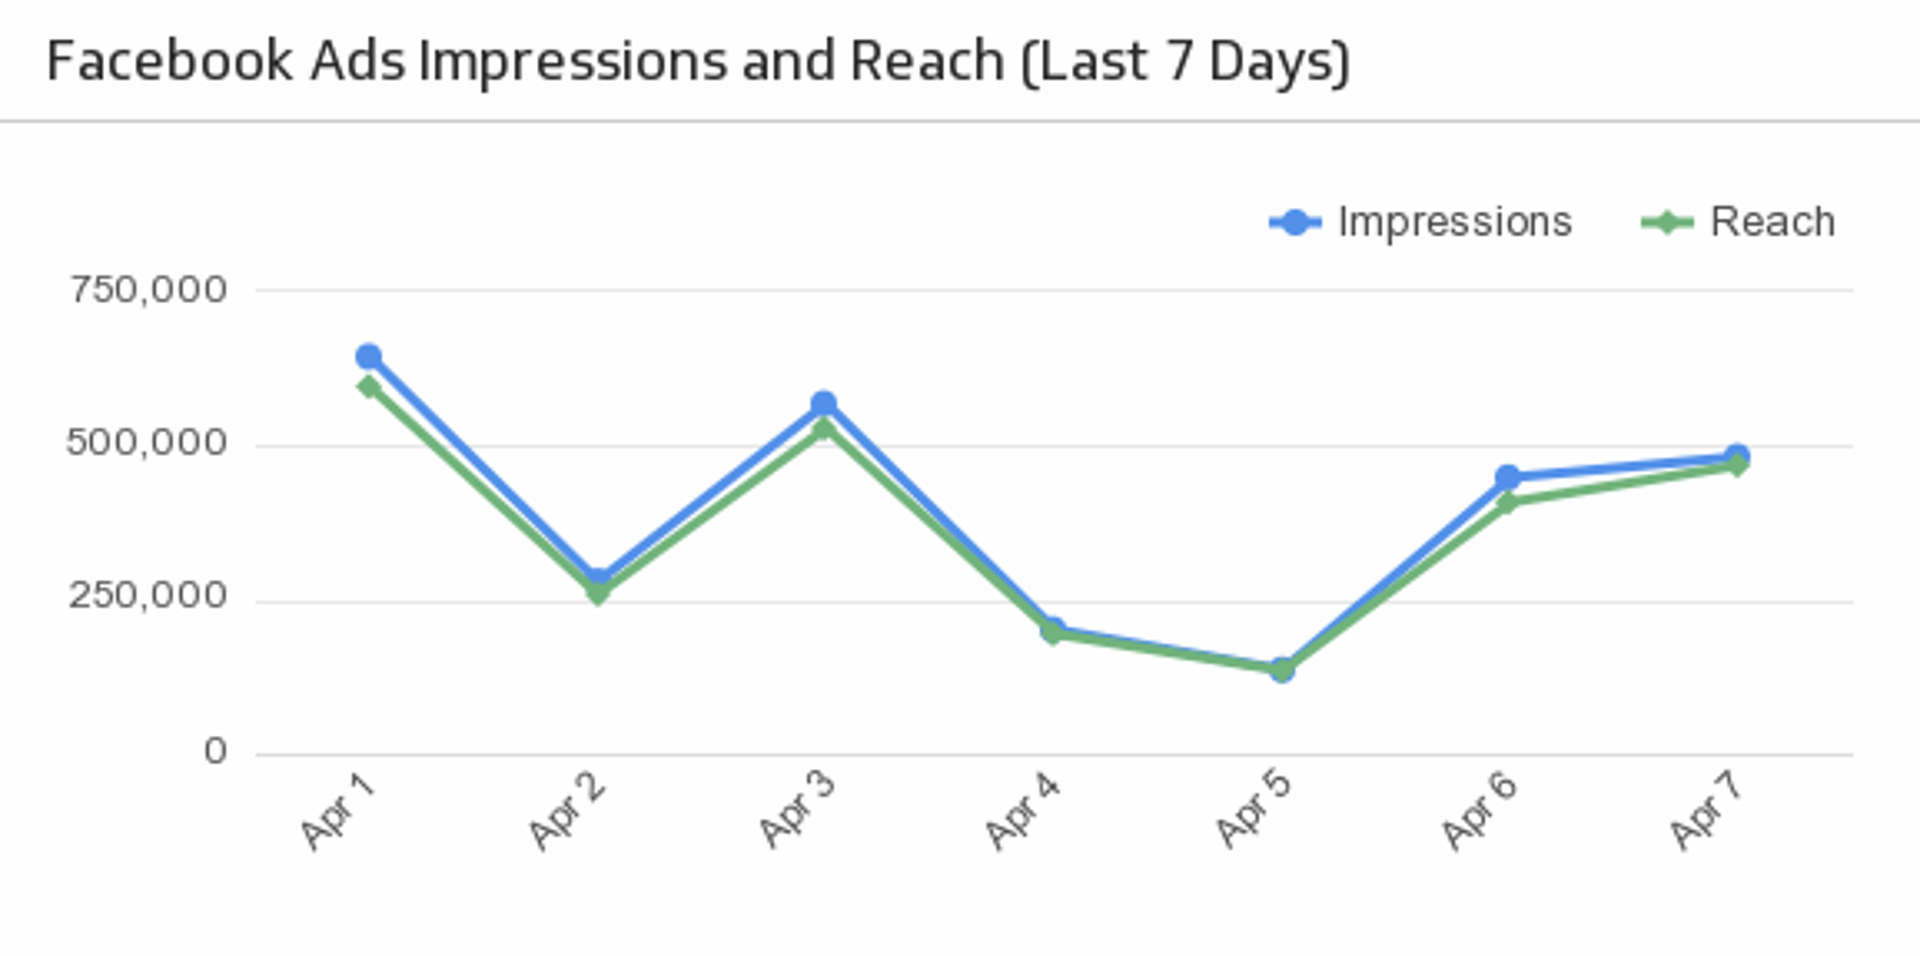
UsesImpressions and Reach (Last 7 Days)
Compare your Facebook Ad impressions with reach over the past 7 days.
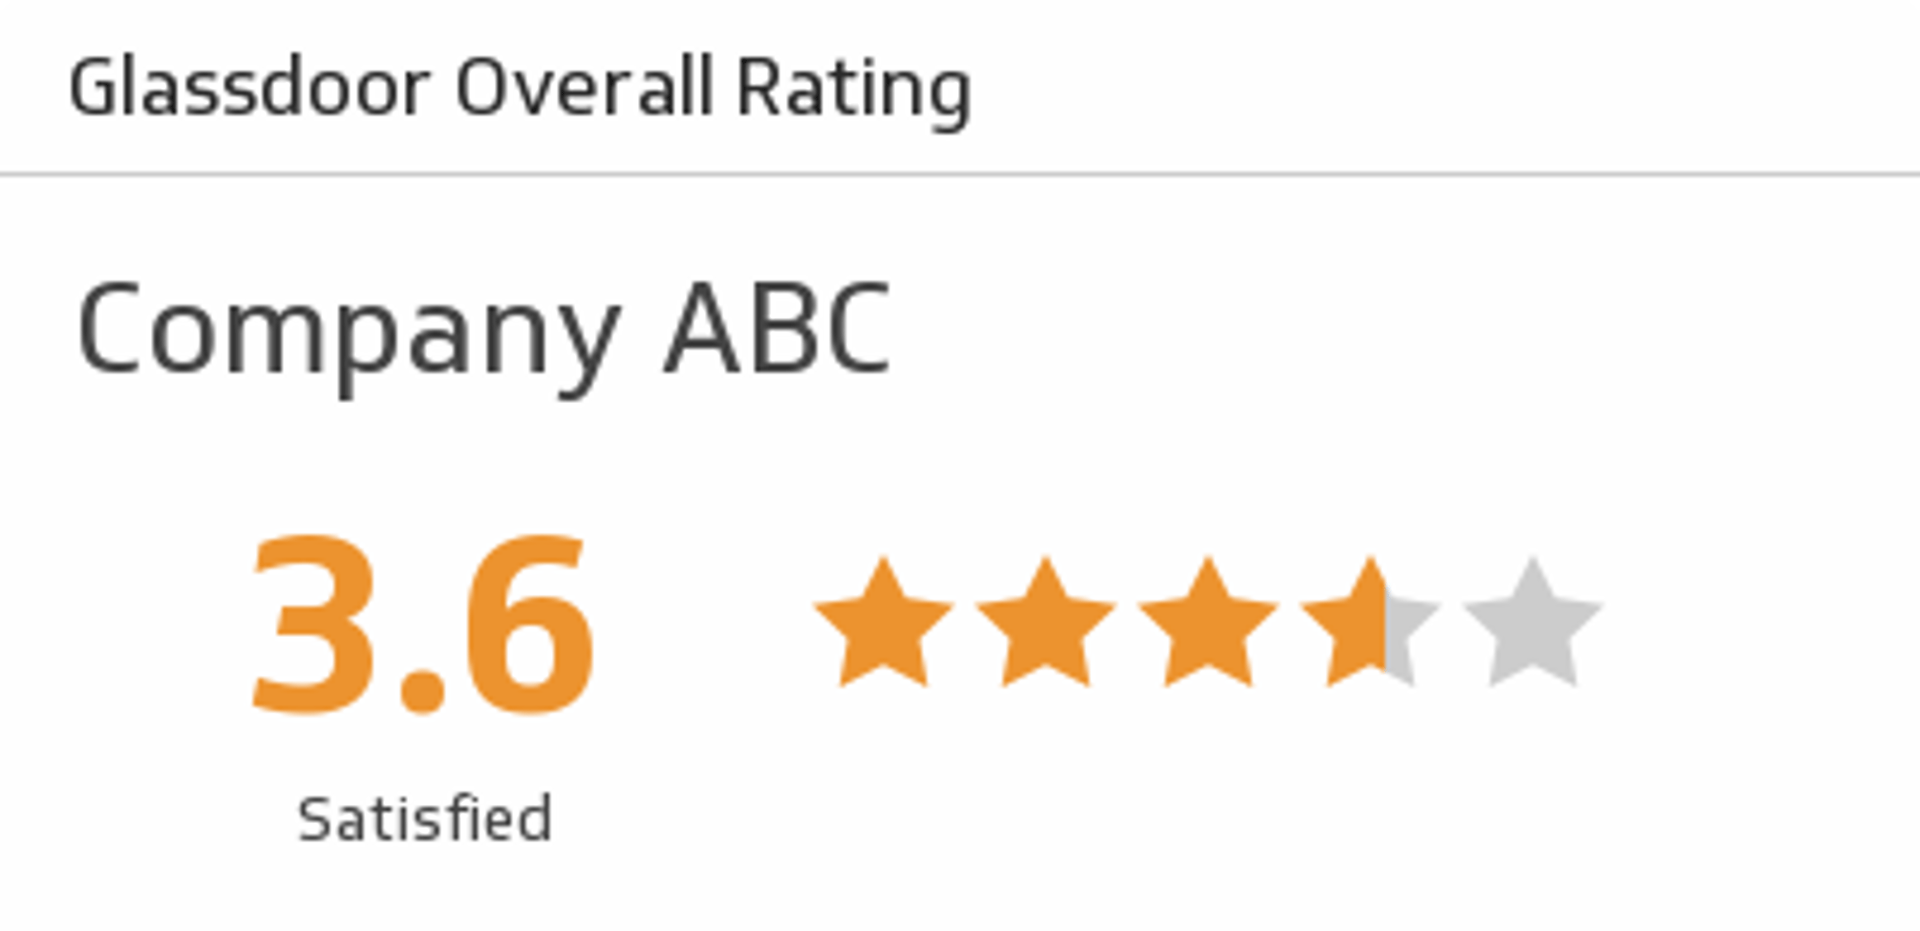
UsesOverall Rating
Discover how a company is rated overall by past and present employees.
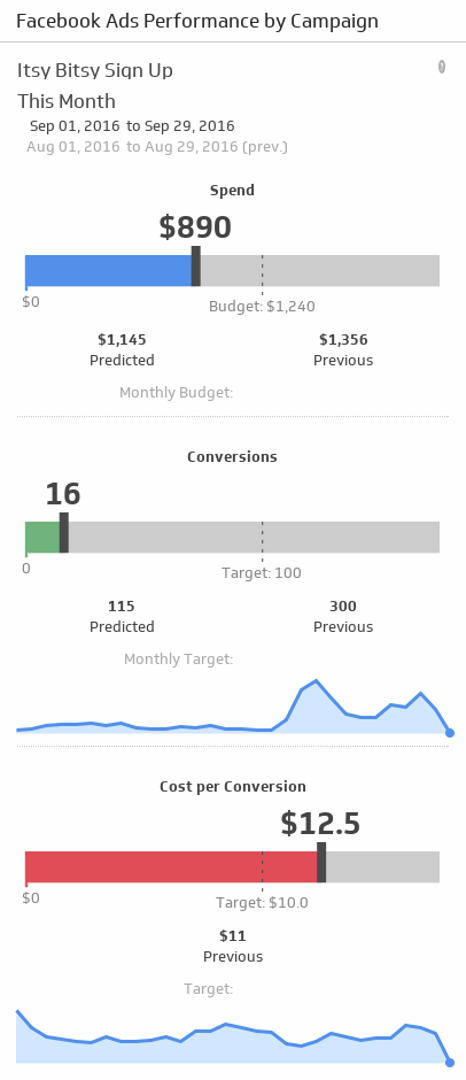
UsesPerformance by Campaign
Is your campaign on budget and meeting your conversion targets? Make sure your message is reaching the right audience by monitoring your Facebook Ads campaign performance for the date range and campaign of your choice.
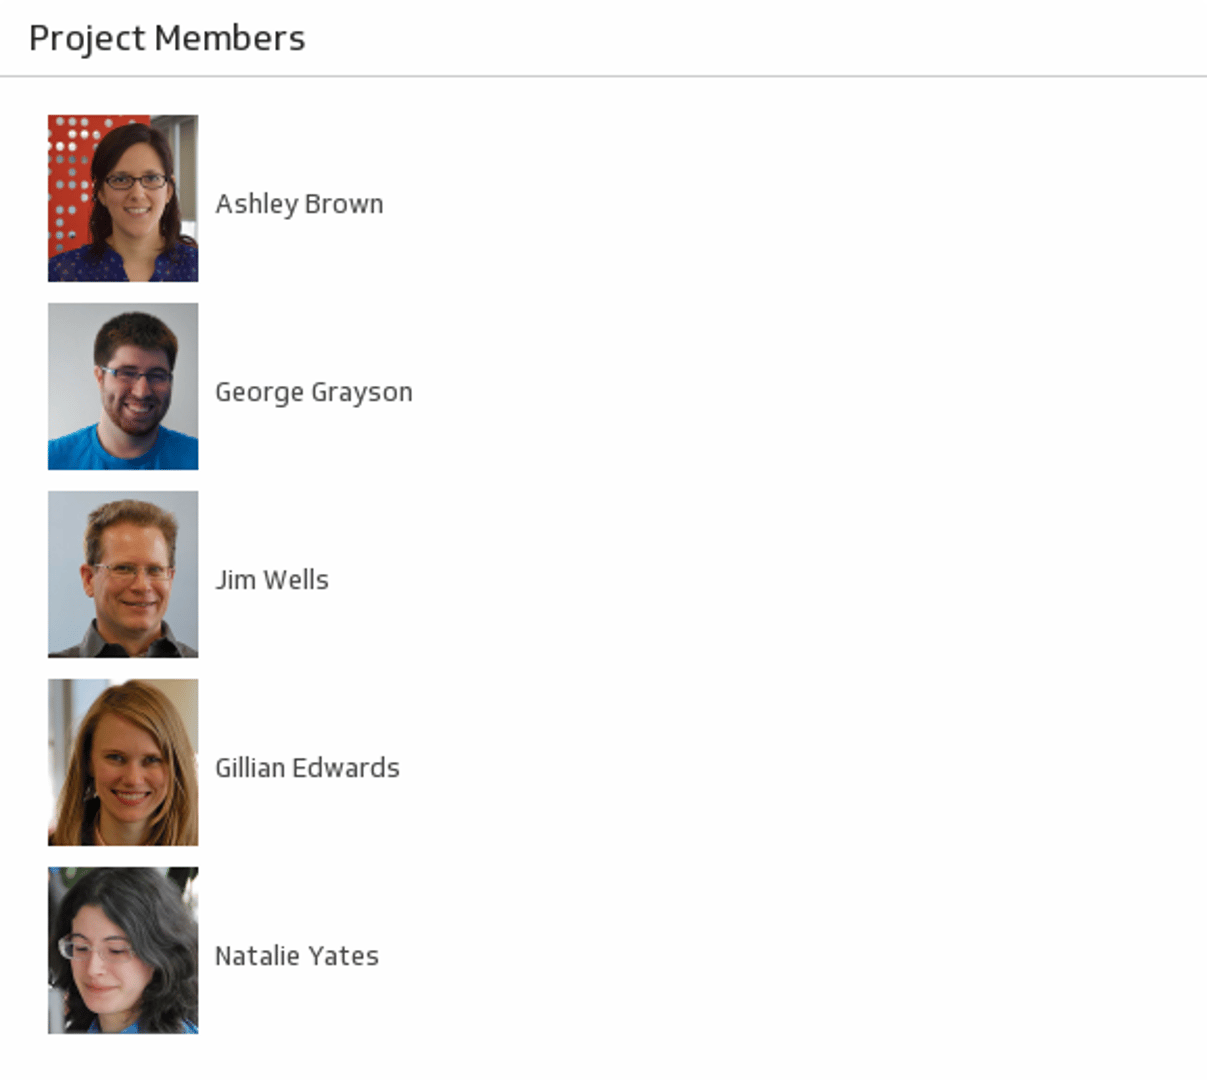
UsesProject Members
Let your team shine by displaying a list of members on your dashboard.
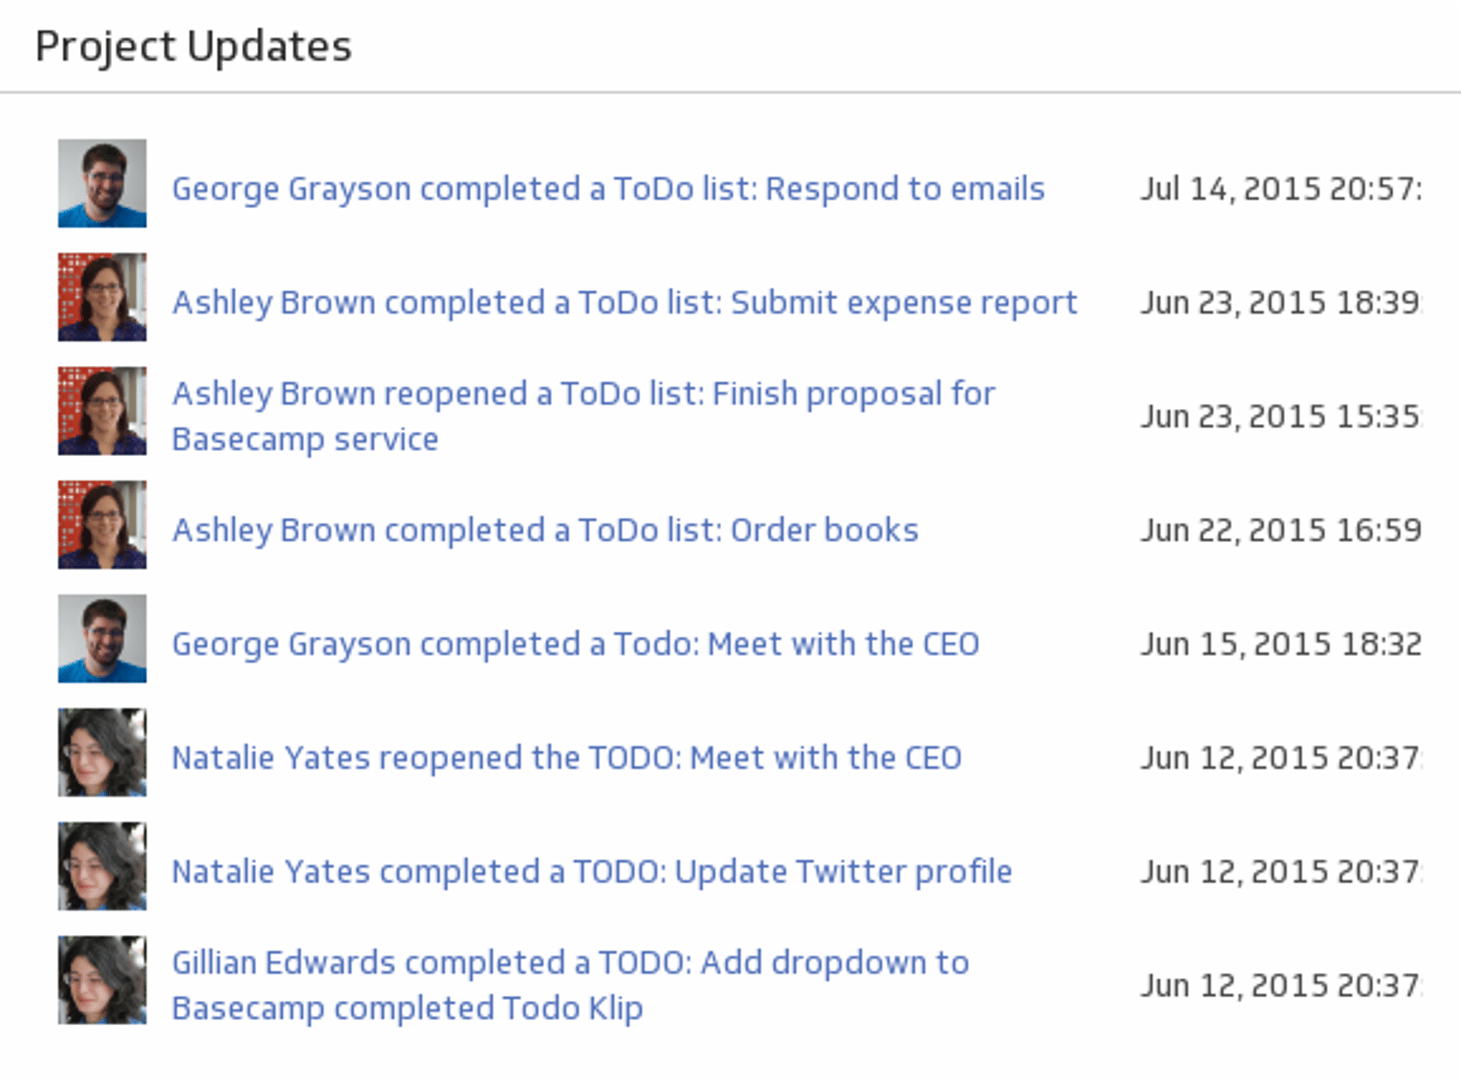
UsesProject Updates
Monitor your team's activity with a real-time list of updates.
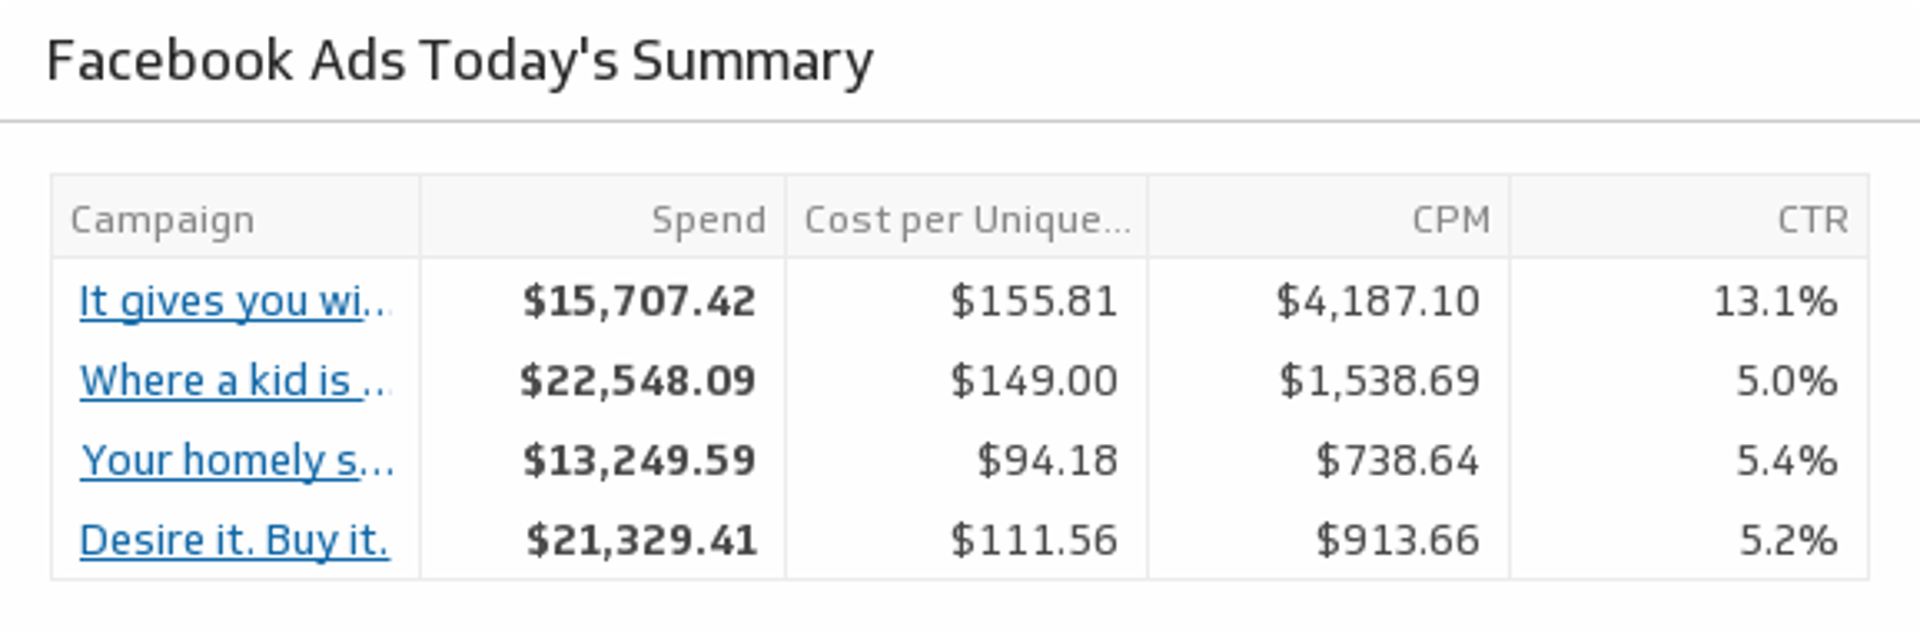
UsesToday's Summary
Drill down into today's campaign metrics and monitor your Facebook Ad objectives.
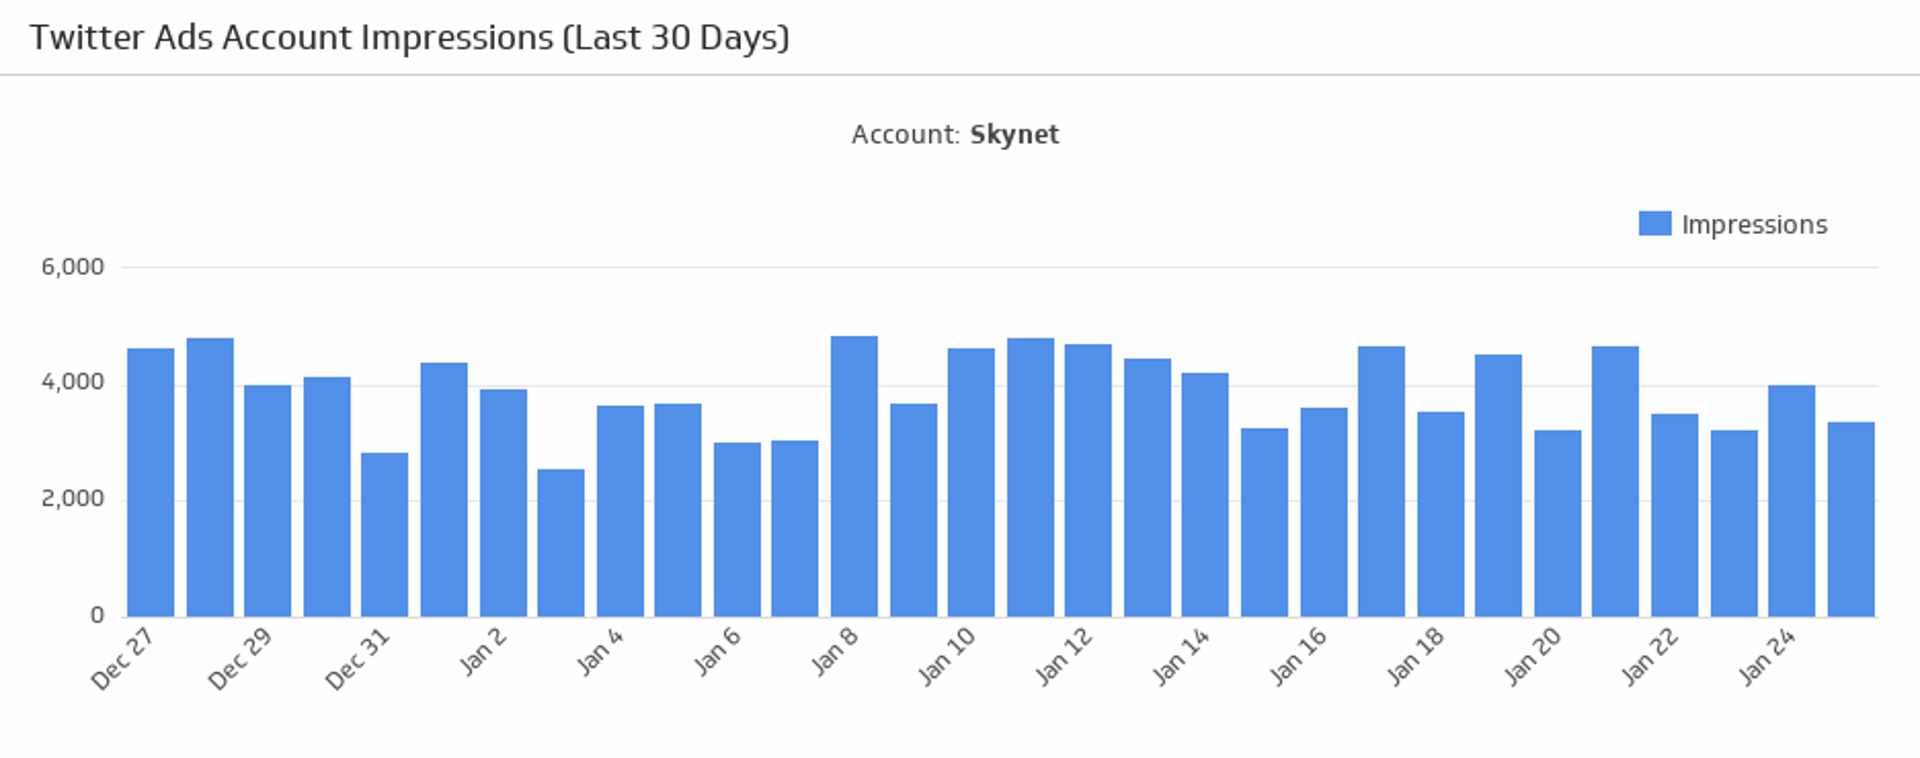
UsesAccount Impressions
Make sure your Twitter Ads account is making an impression! Monitor the number of impressions generated from your Twitter Ads account over the last 30 days.
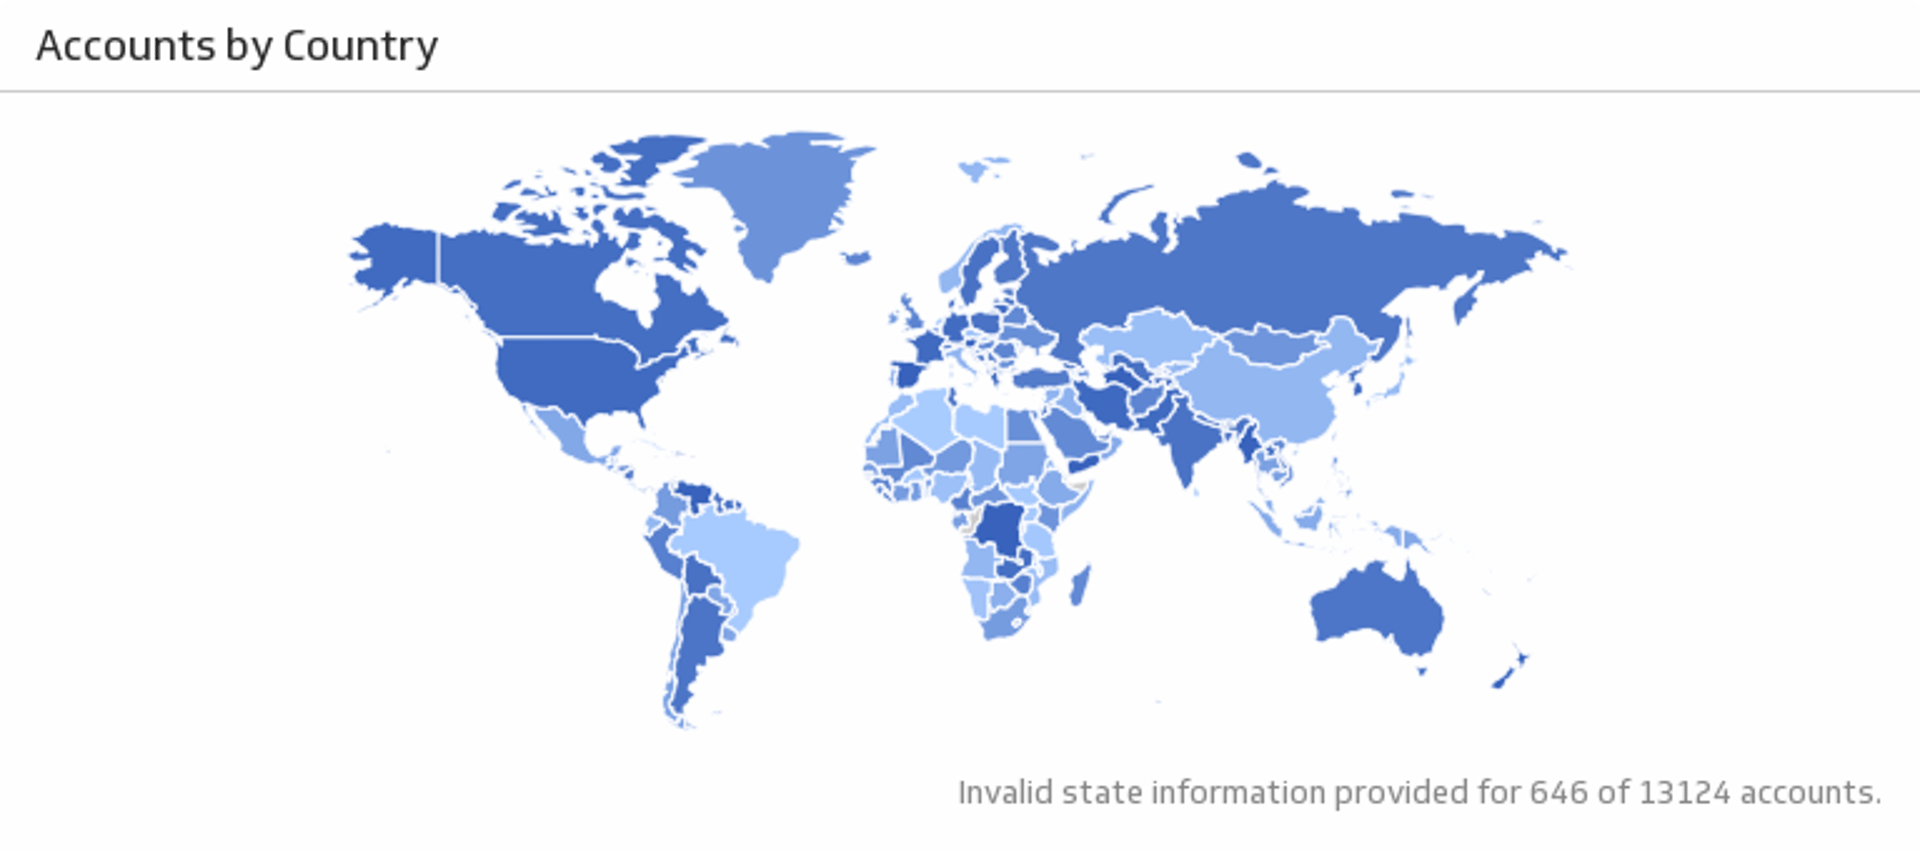
UsesAccounts by Country
See the location of your Salesforce accounts.
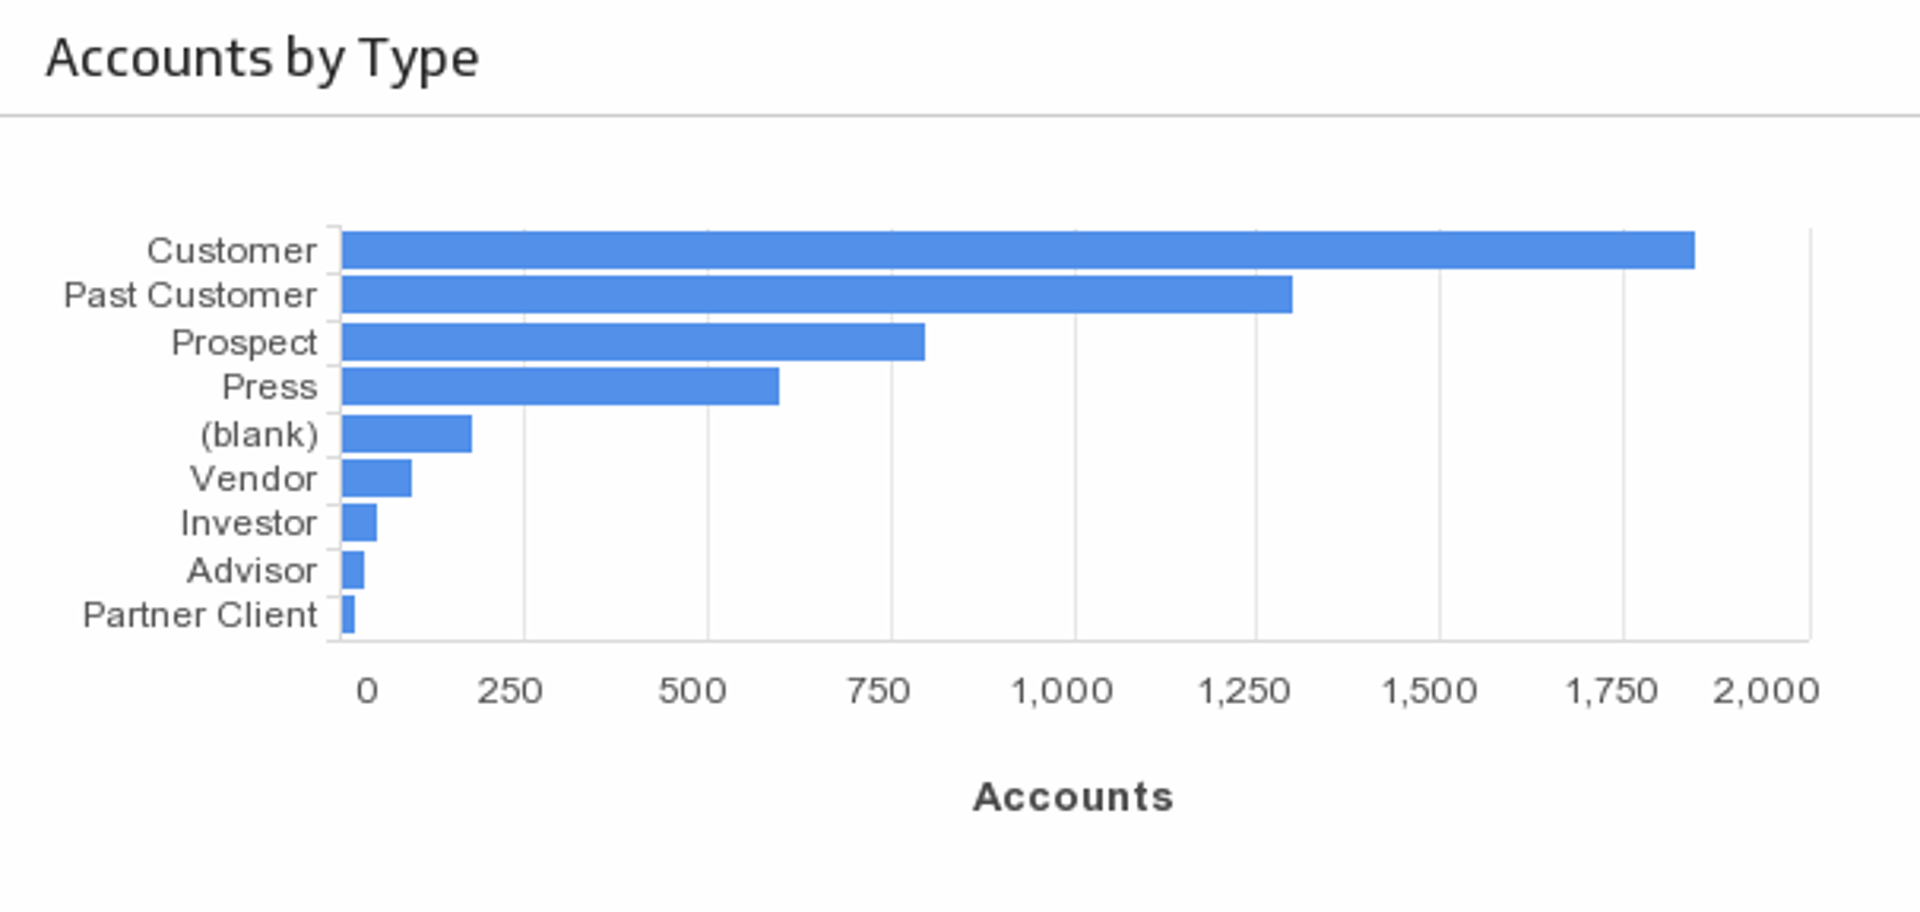
UsesAccounts by Type
See the distribution of your accounts by type.
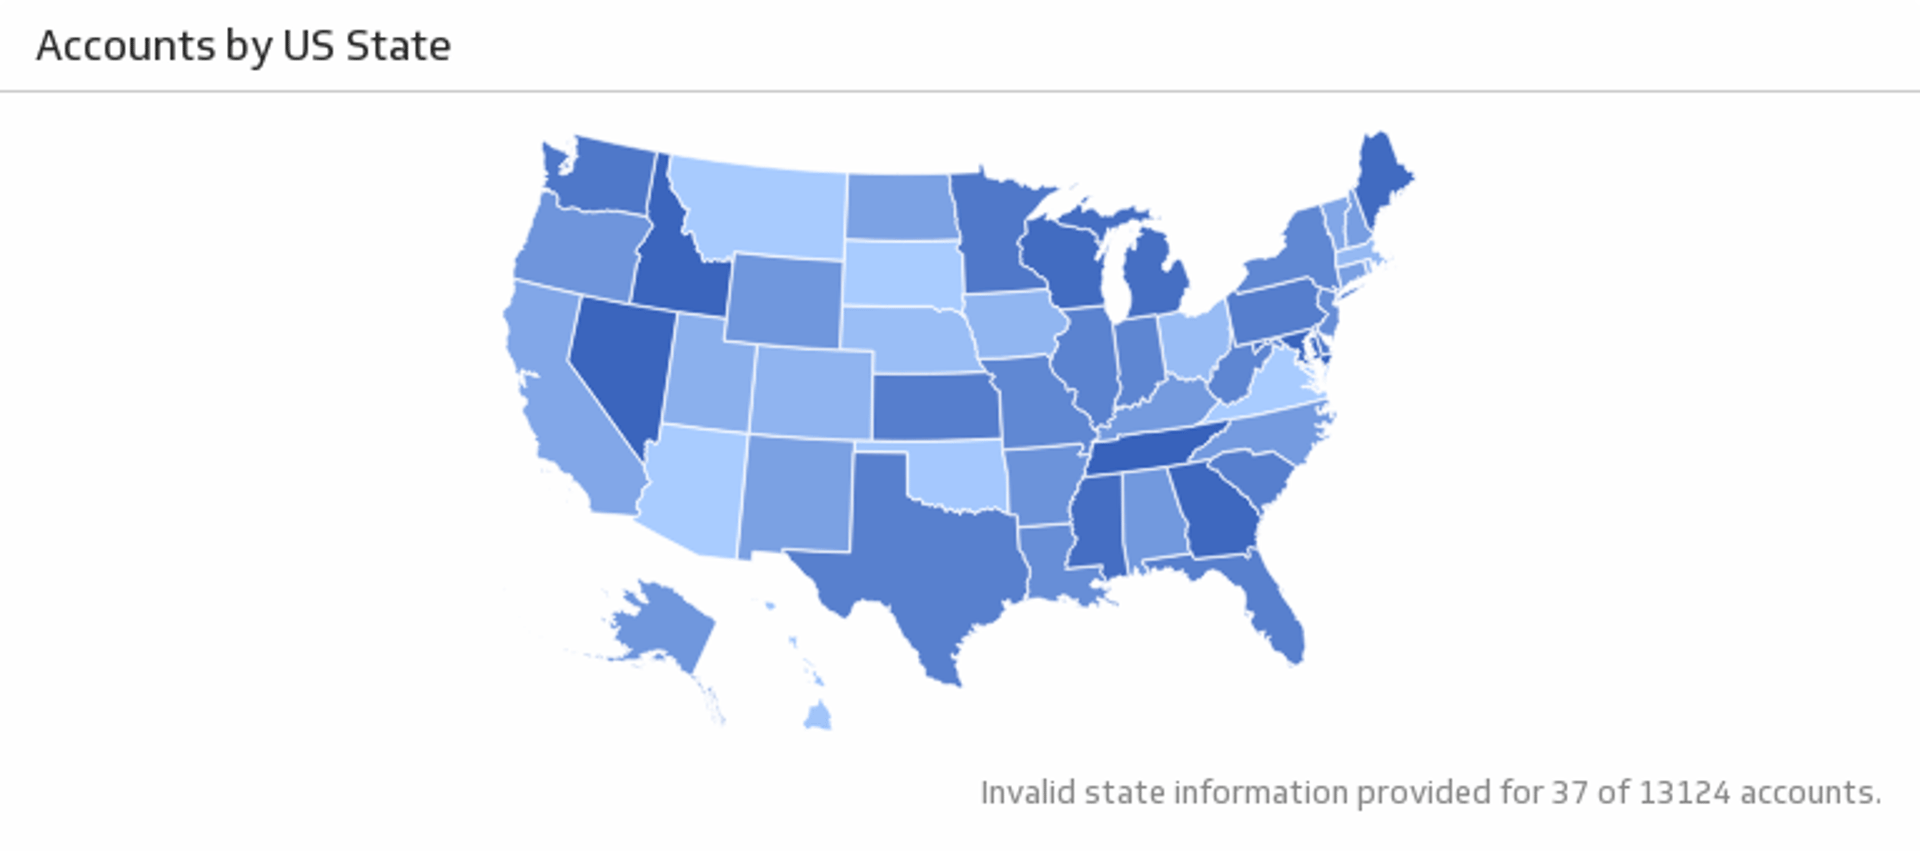
UsesAccounts by U.S. State
See the location of your U.S. Salesforce accounts.
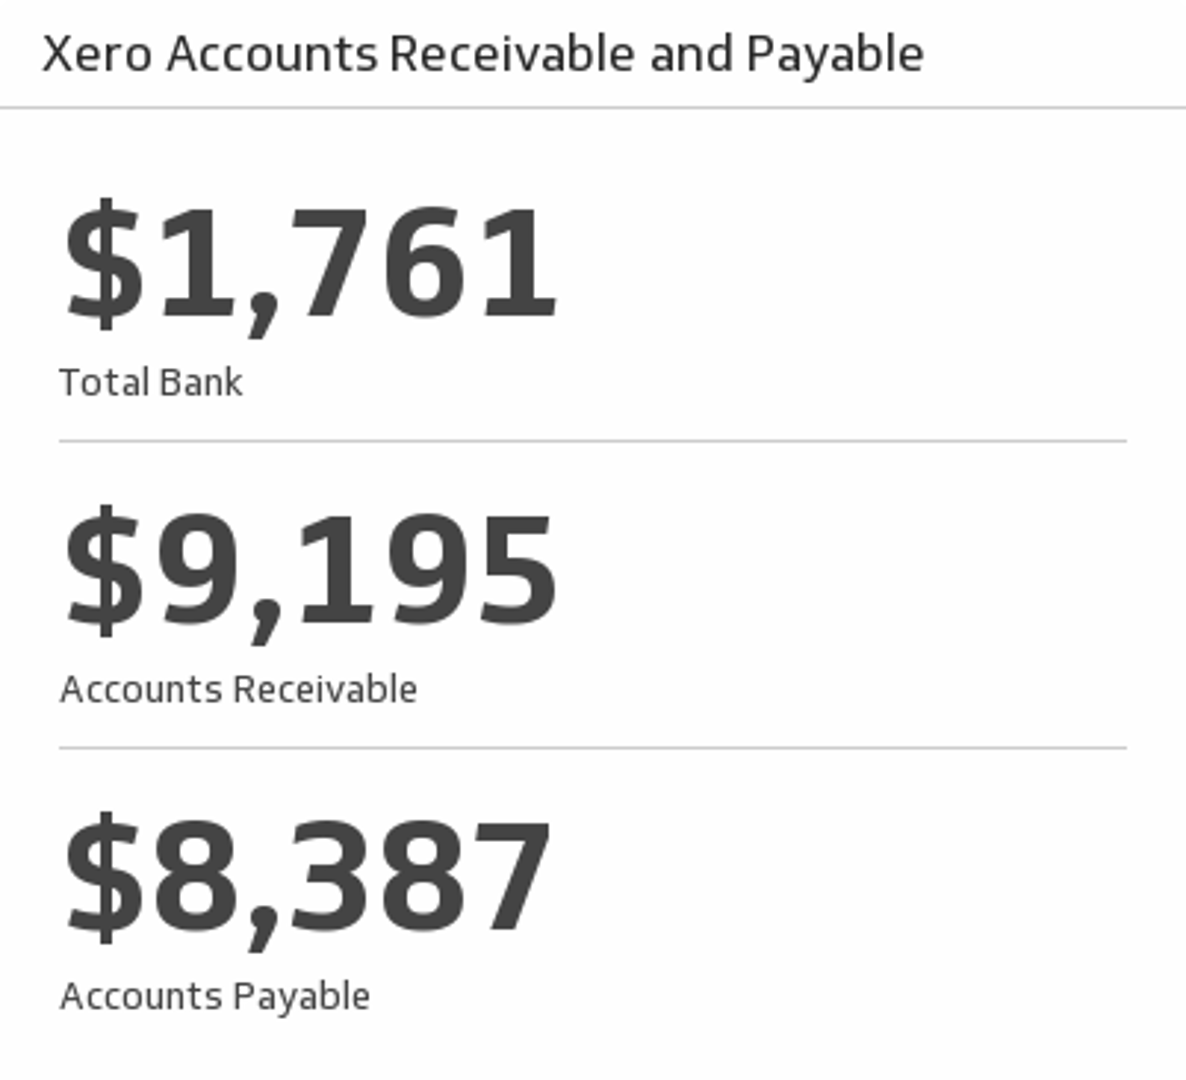
UsesAccounts Receivable and Payable
Track your total bank balance, accounts receivable and payable for this month.
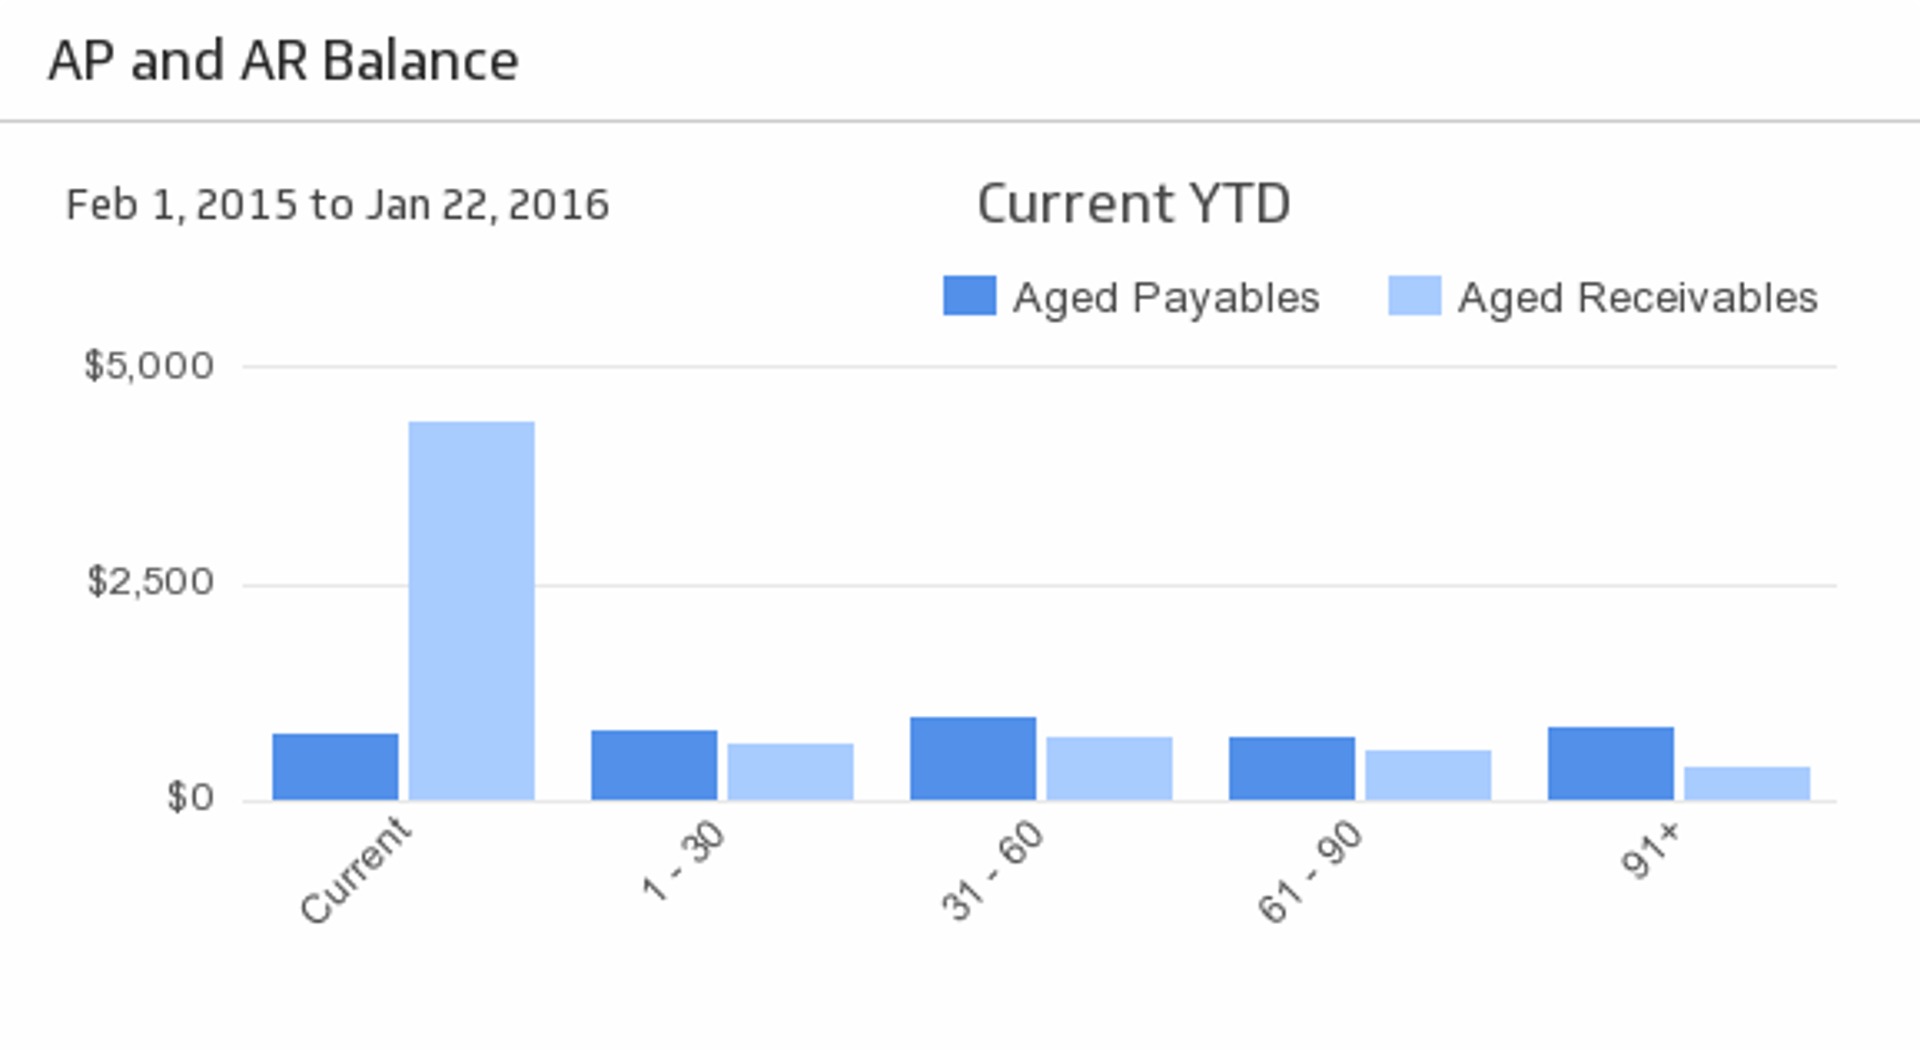
UsesAP and AR Balance
See your Accounts Payable and Accounts Receivable at-a-glance during the time period of your choice.
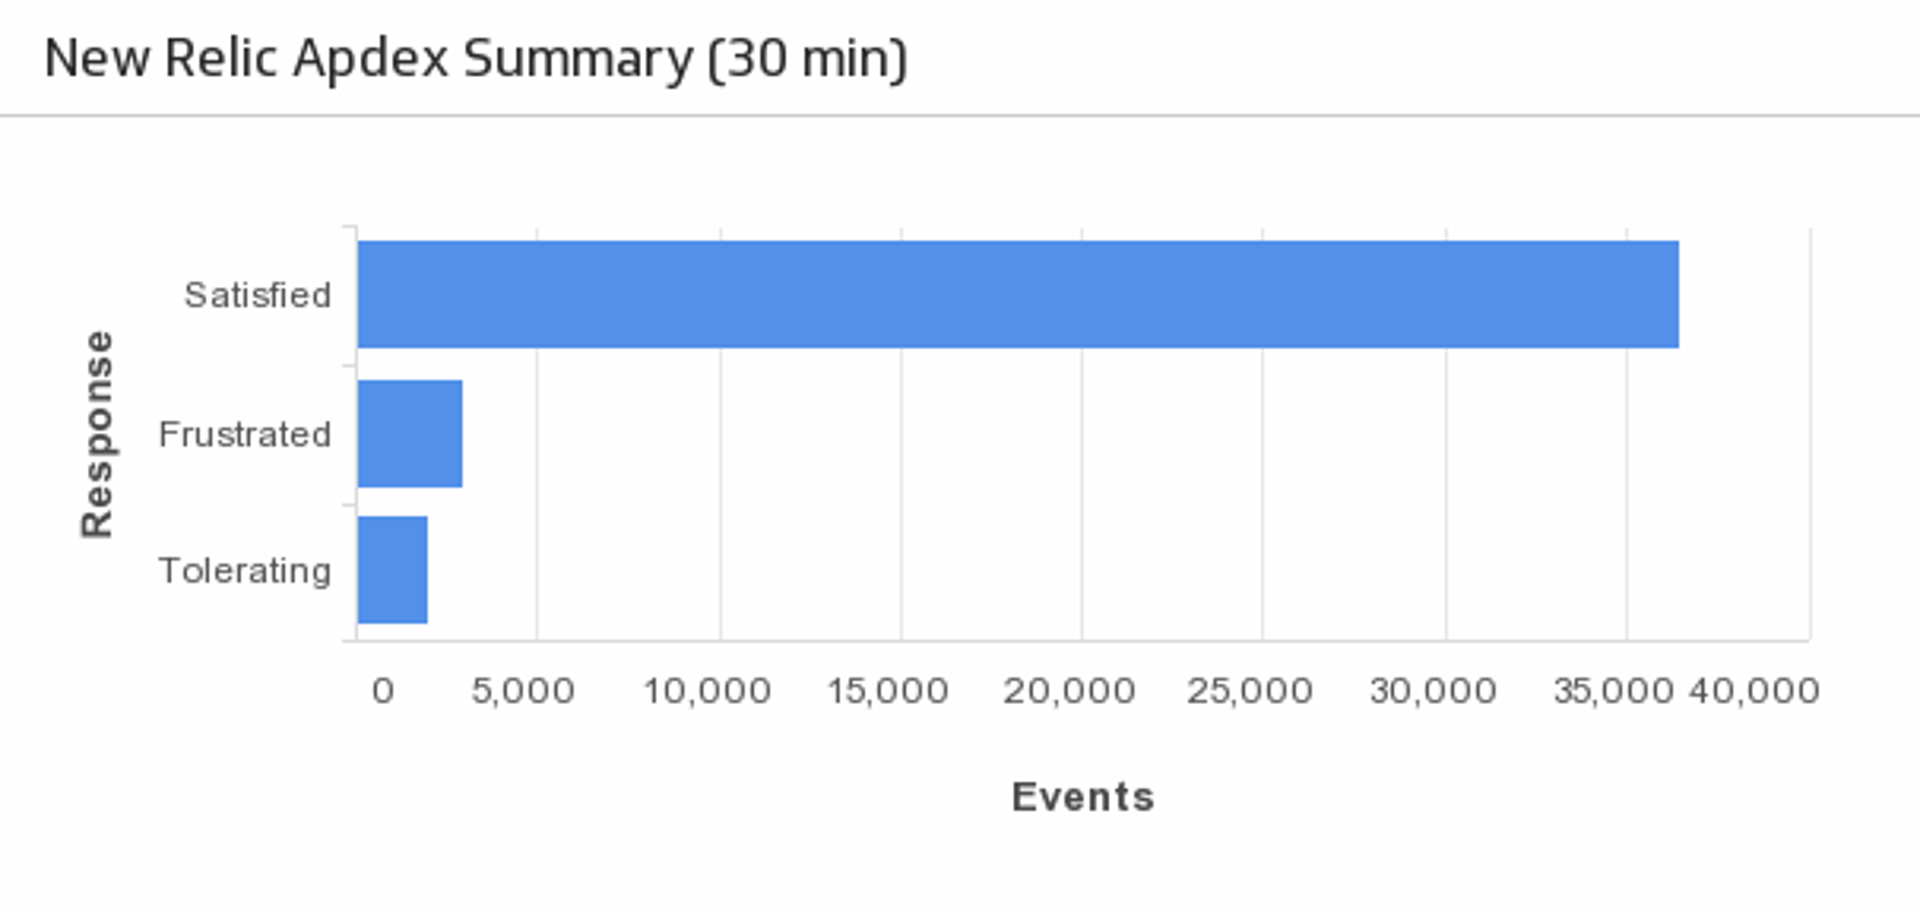
UsesApdex Summary
Displays a summary of application performance for the last 30 minutes.
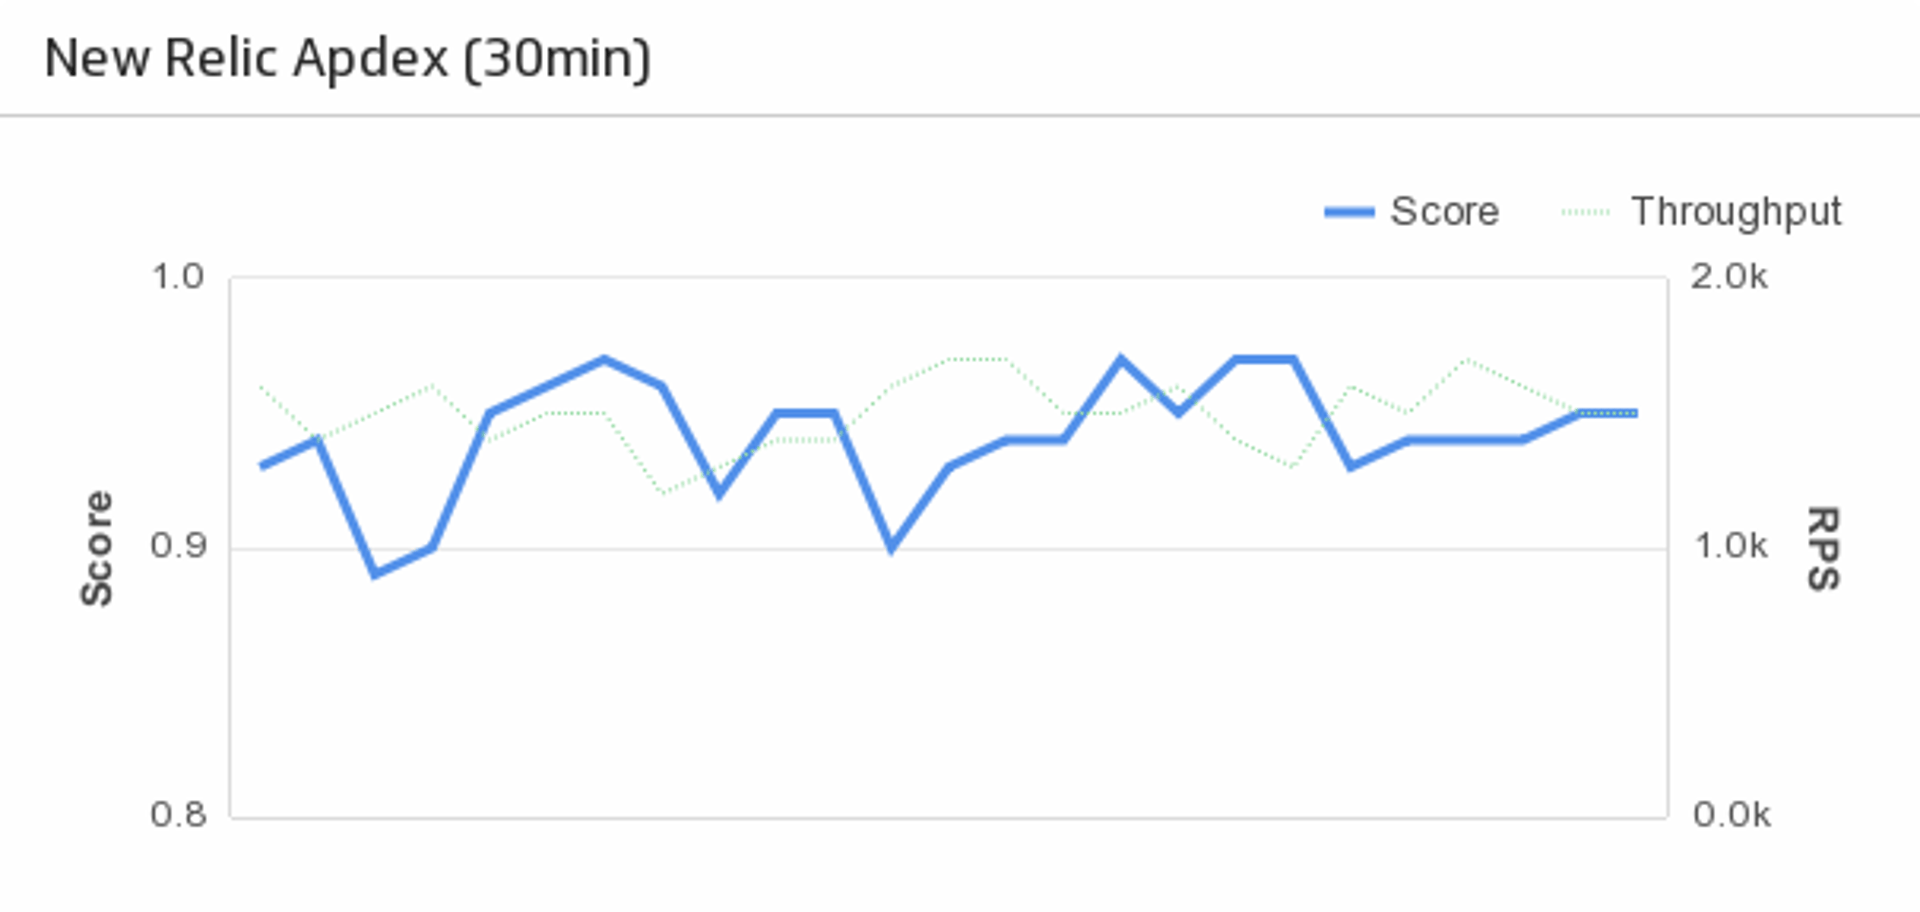
UsesApplication Apdex
Displays application apdex score and throughput for the last 30 minutes.
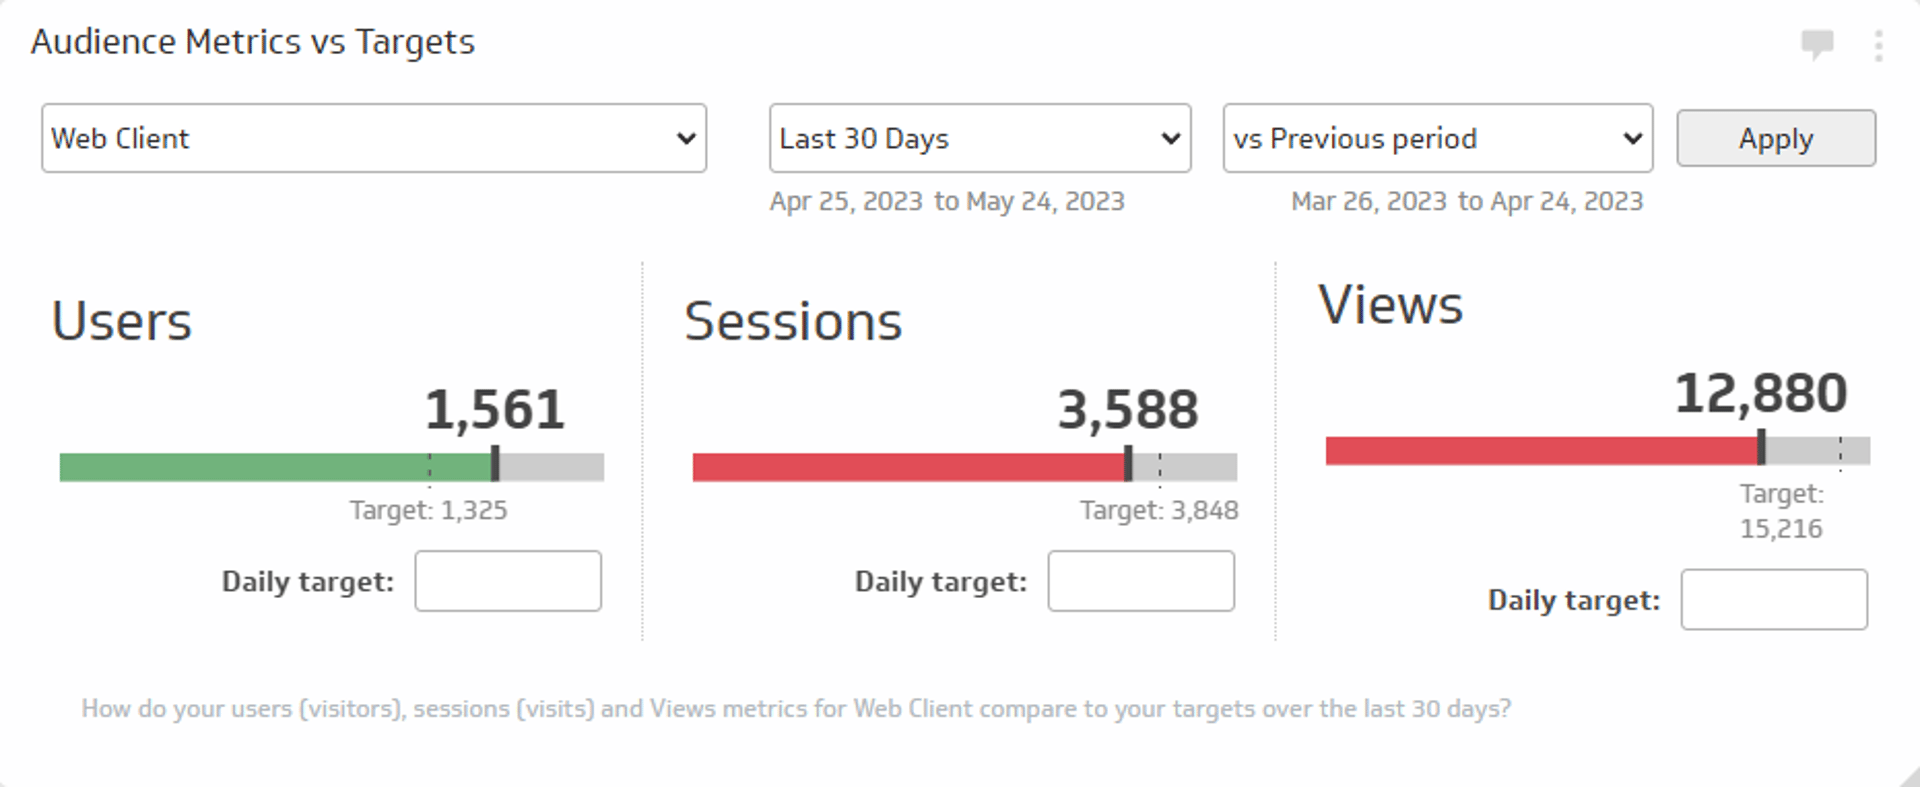
UsesAudience Metrics vs. Targets
Track the total number of users, sessions, and views for a specific time period and compare those values to daily targets or to a previous period.
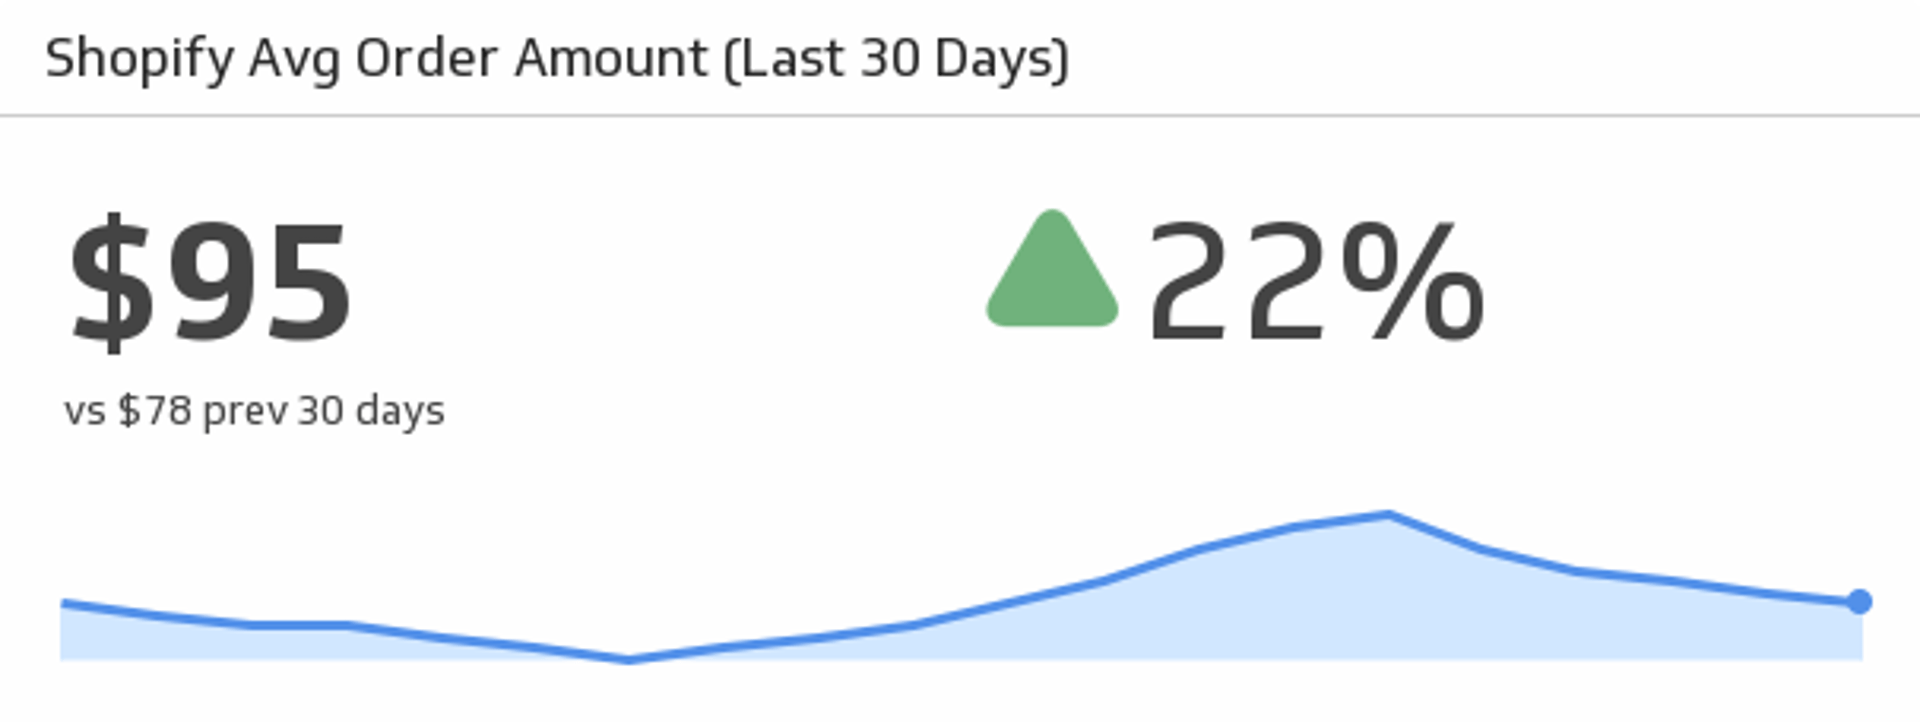
UsesAverage Order Amount (Last 30 days)
See the trend, track, and compare your average orders over the past 30 days.
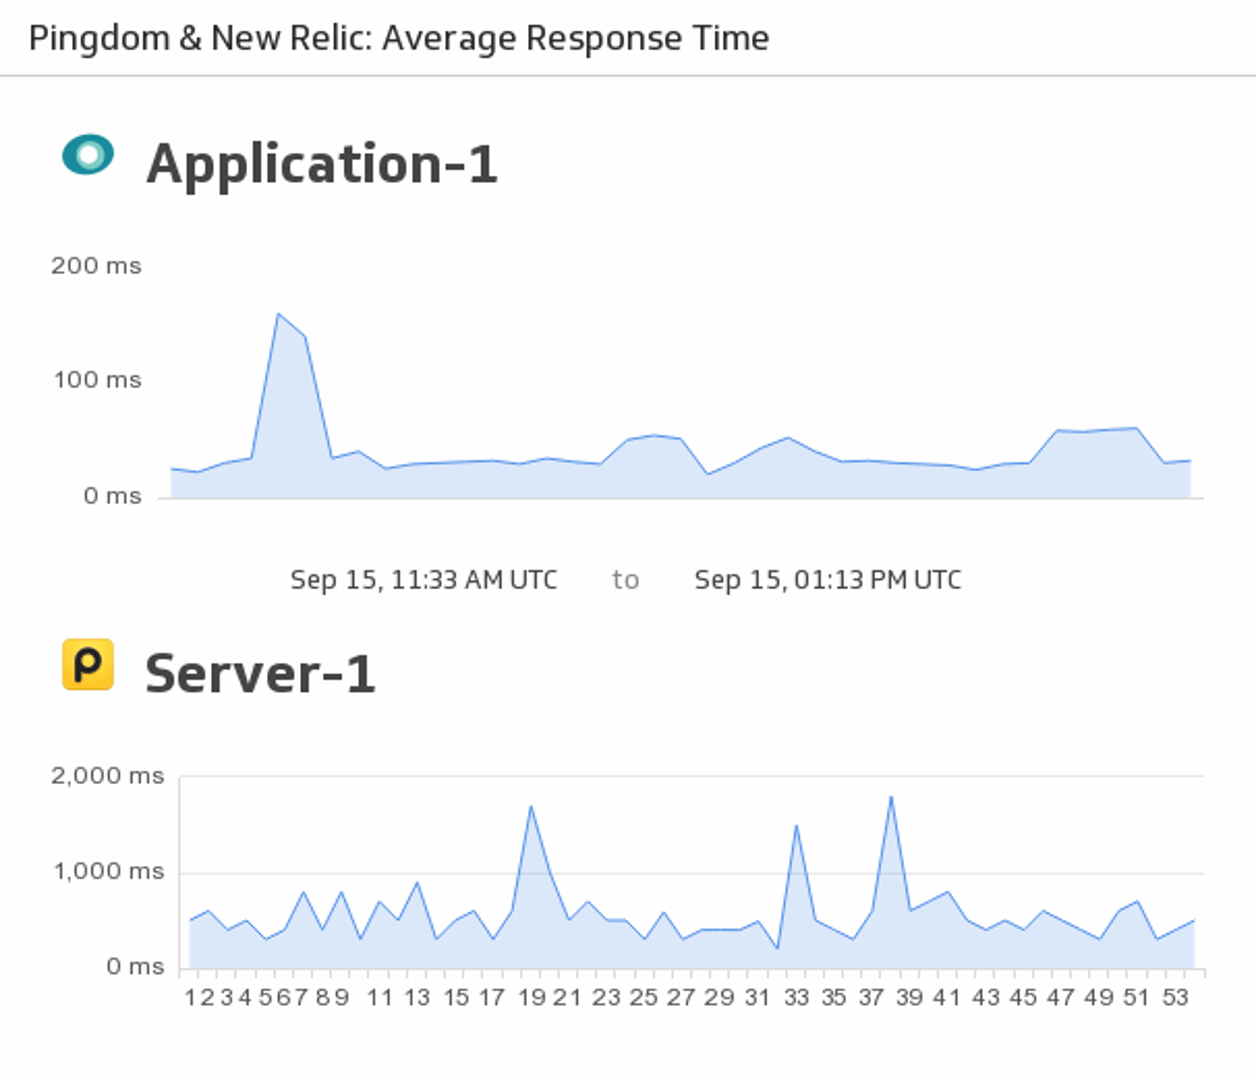
UsesAverage Response Time
Make sure to stay on top of your server and application response time by merging your New Relic and Pingdom data to monitor responsiveness in real-time.
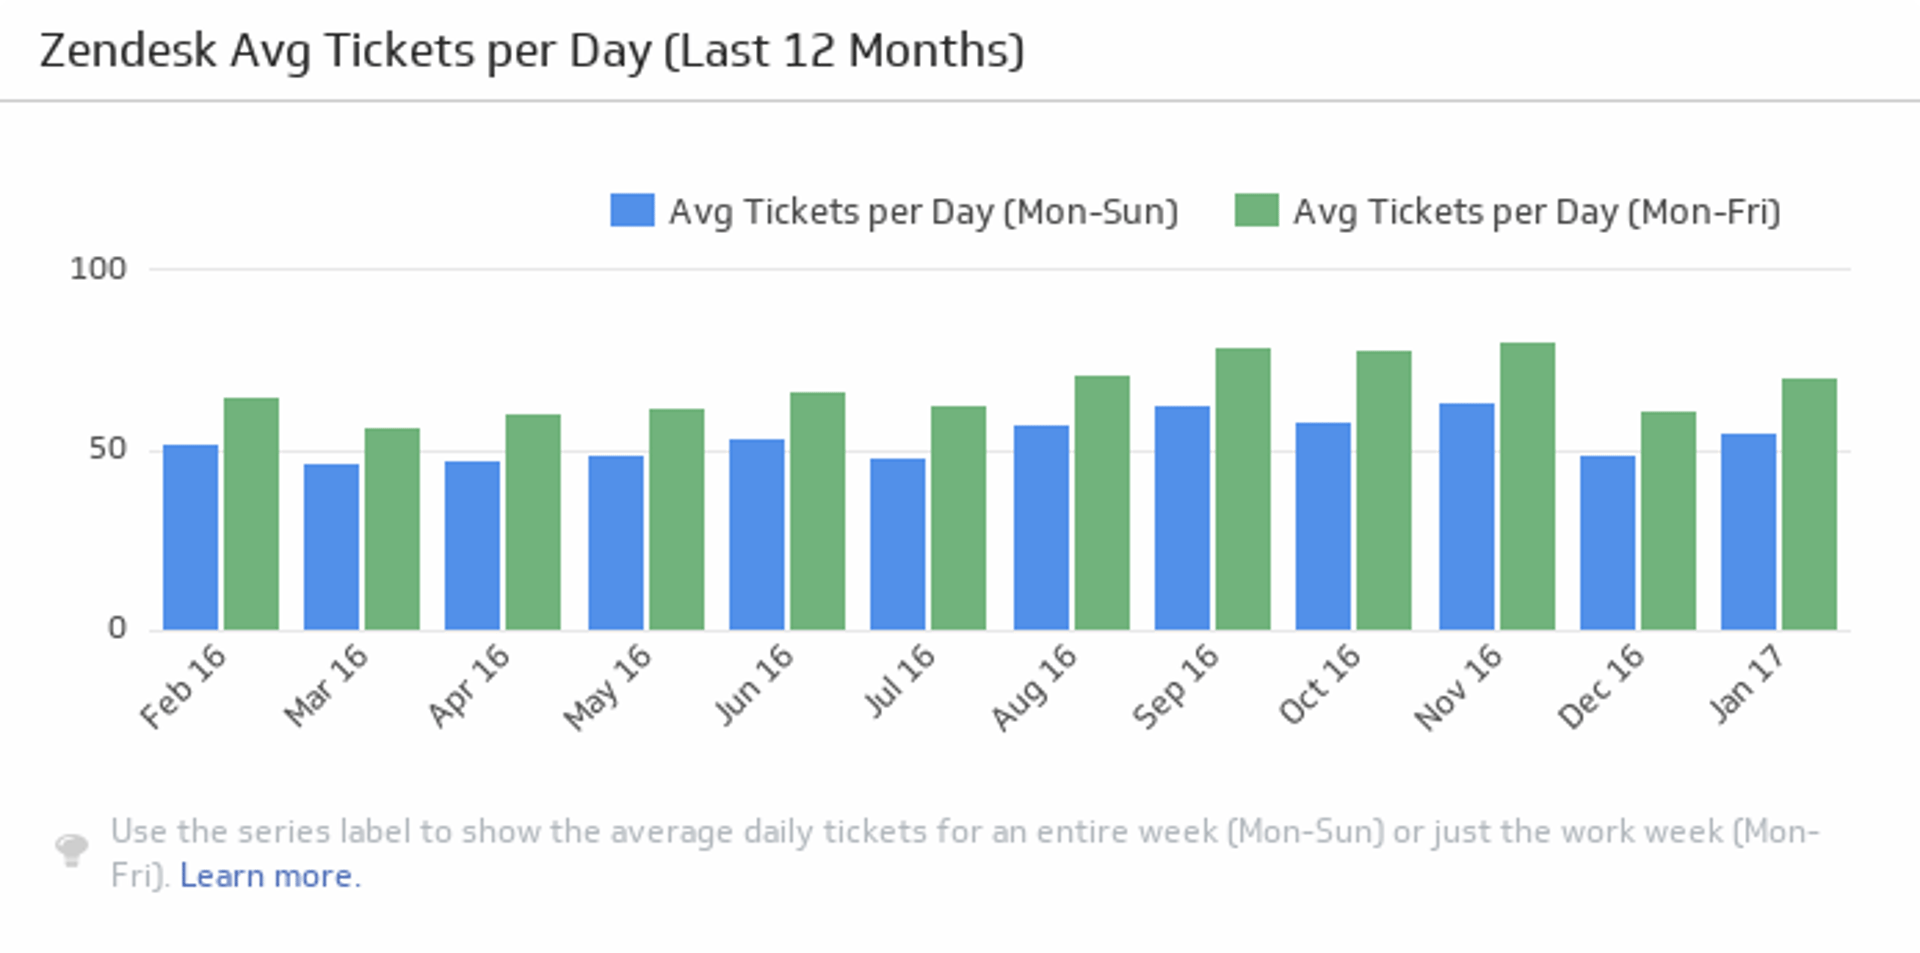
UsesAverage Tickets per Day
Monitor the average number of tickets per day over the past twelve months, and compare the monthly averages for five days and seven days.
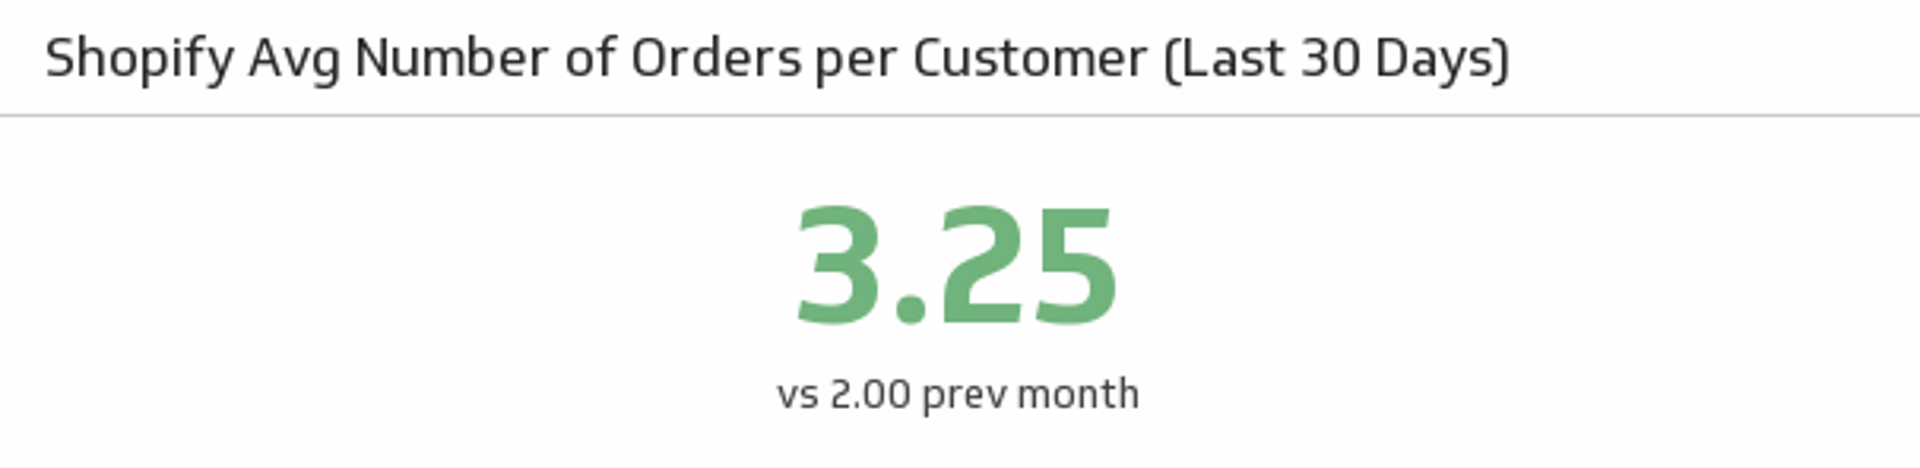
UsesAvg Number of Orders per Customer
See the average number of orders your customers have made over the past 30 days and compare it to the previous month.
Uses