Google Sheets
Top-rated dashboard solution to turn Google Sheets into beautiful data visualizations to wow your boss/clients. Agency Approved. ? Get a free trial today!
Track all your Google Sheets KPIs in one place
Sign up for free and start making decisions for your business with confidence.
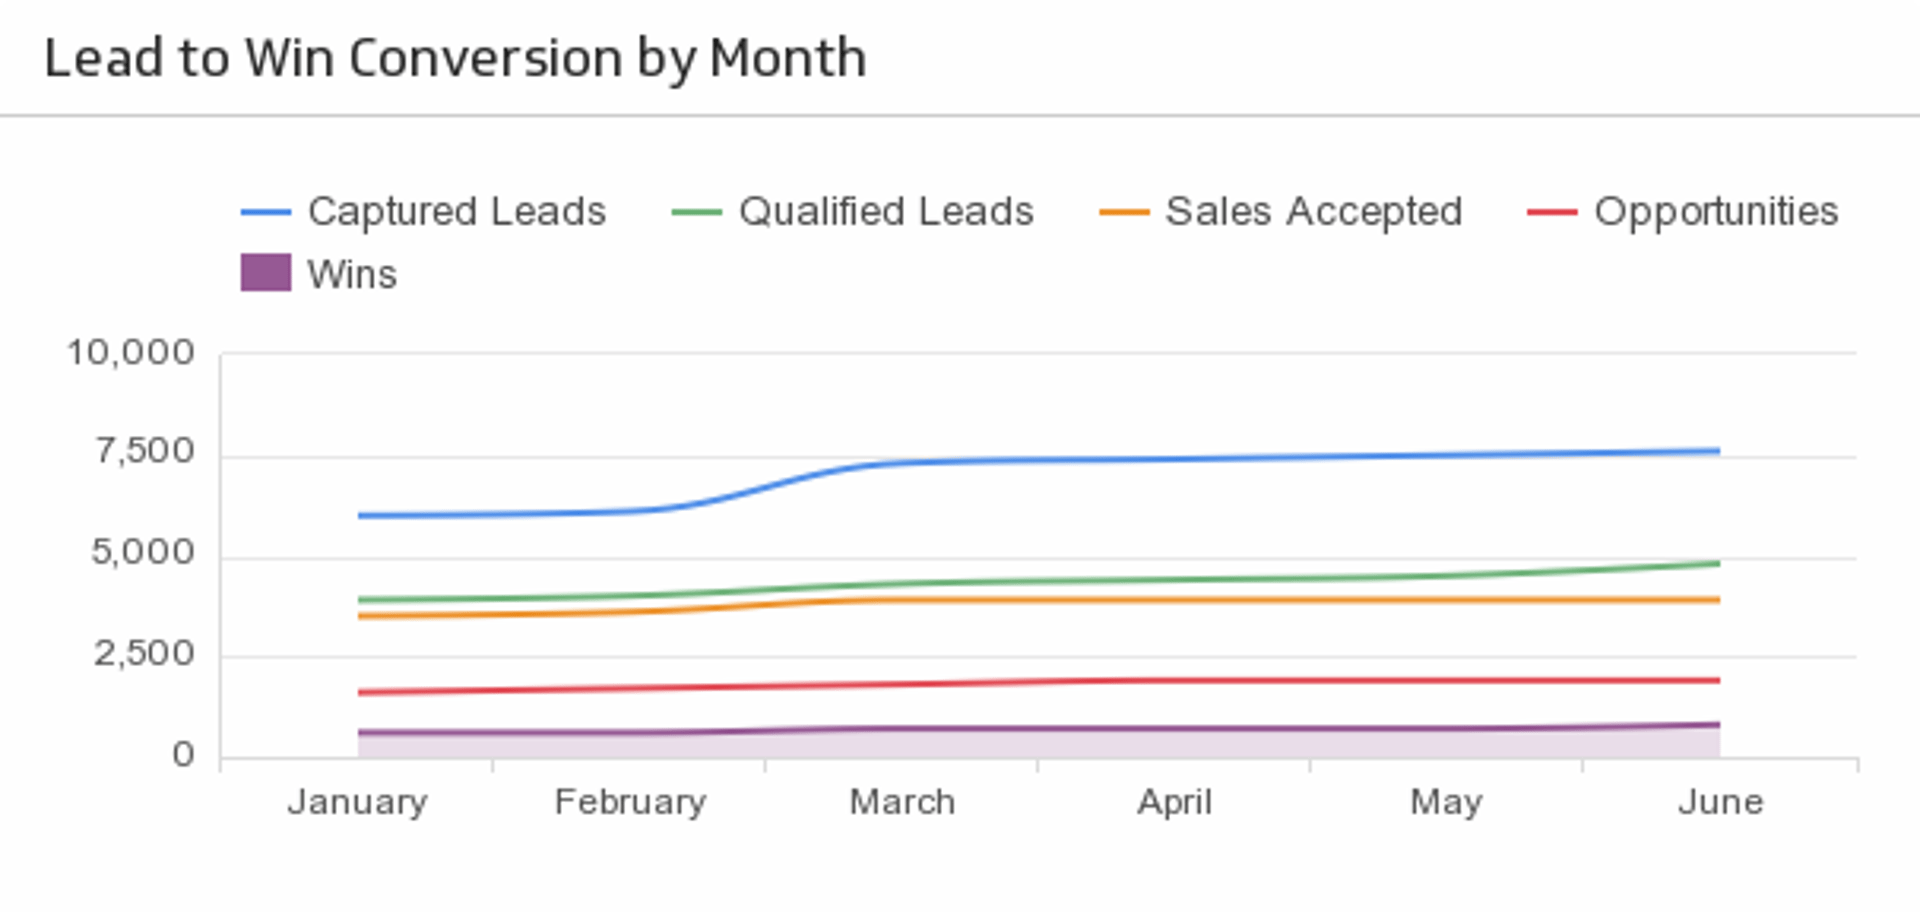
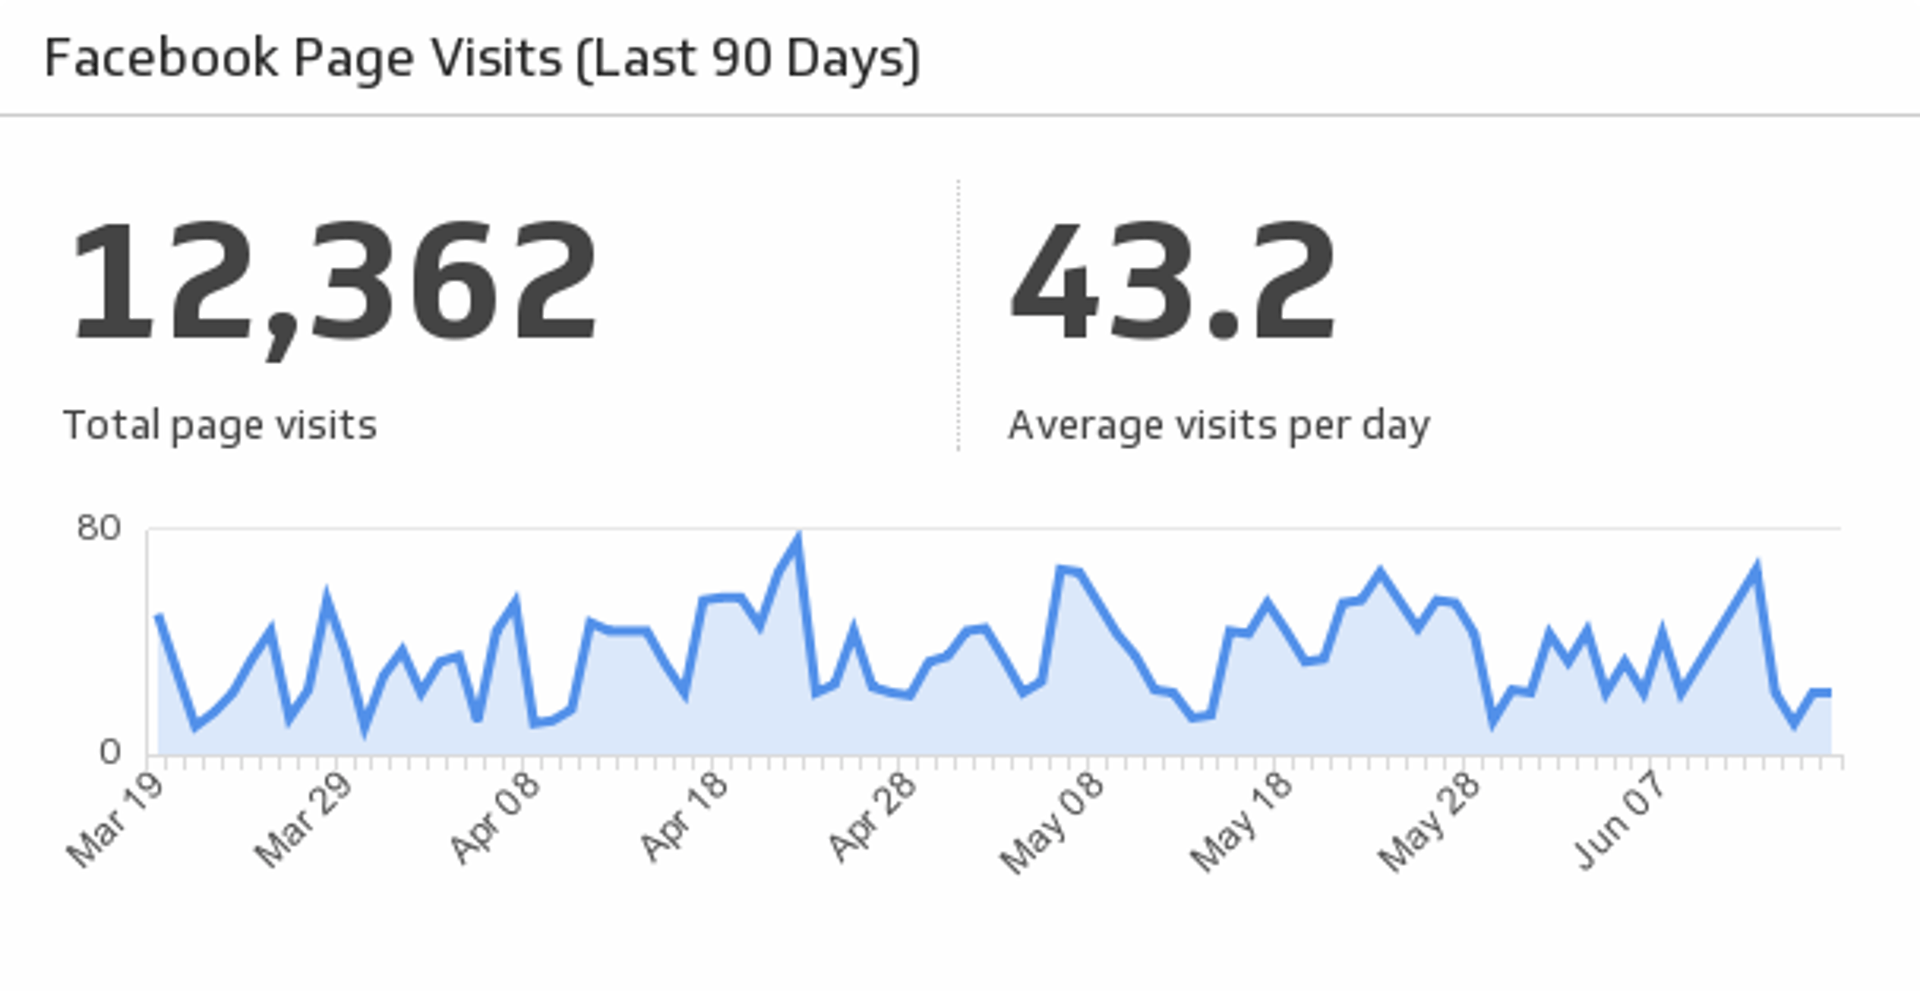
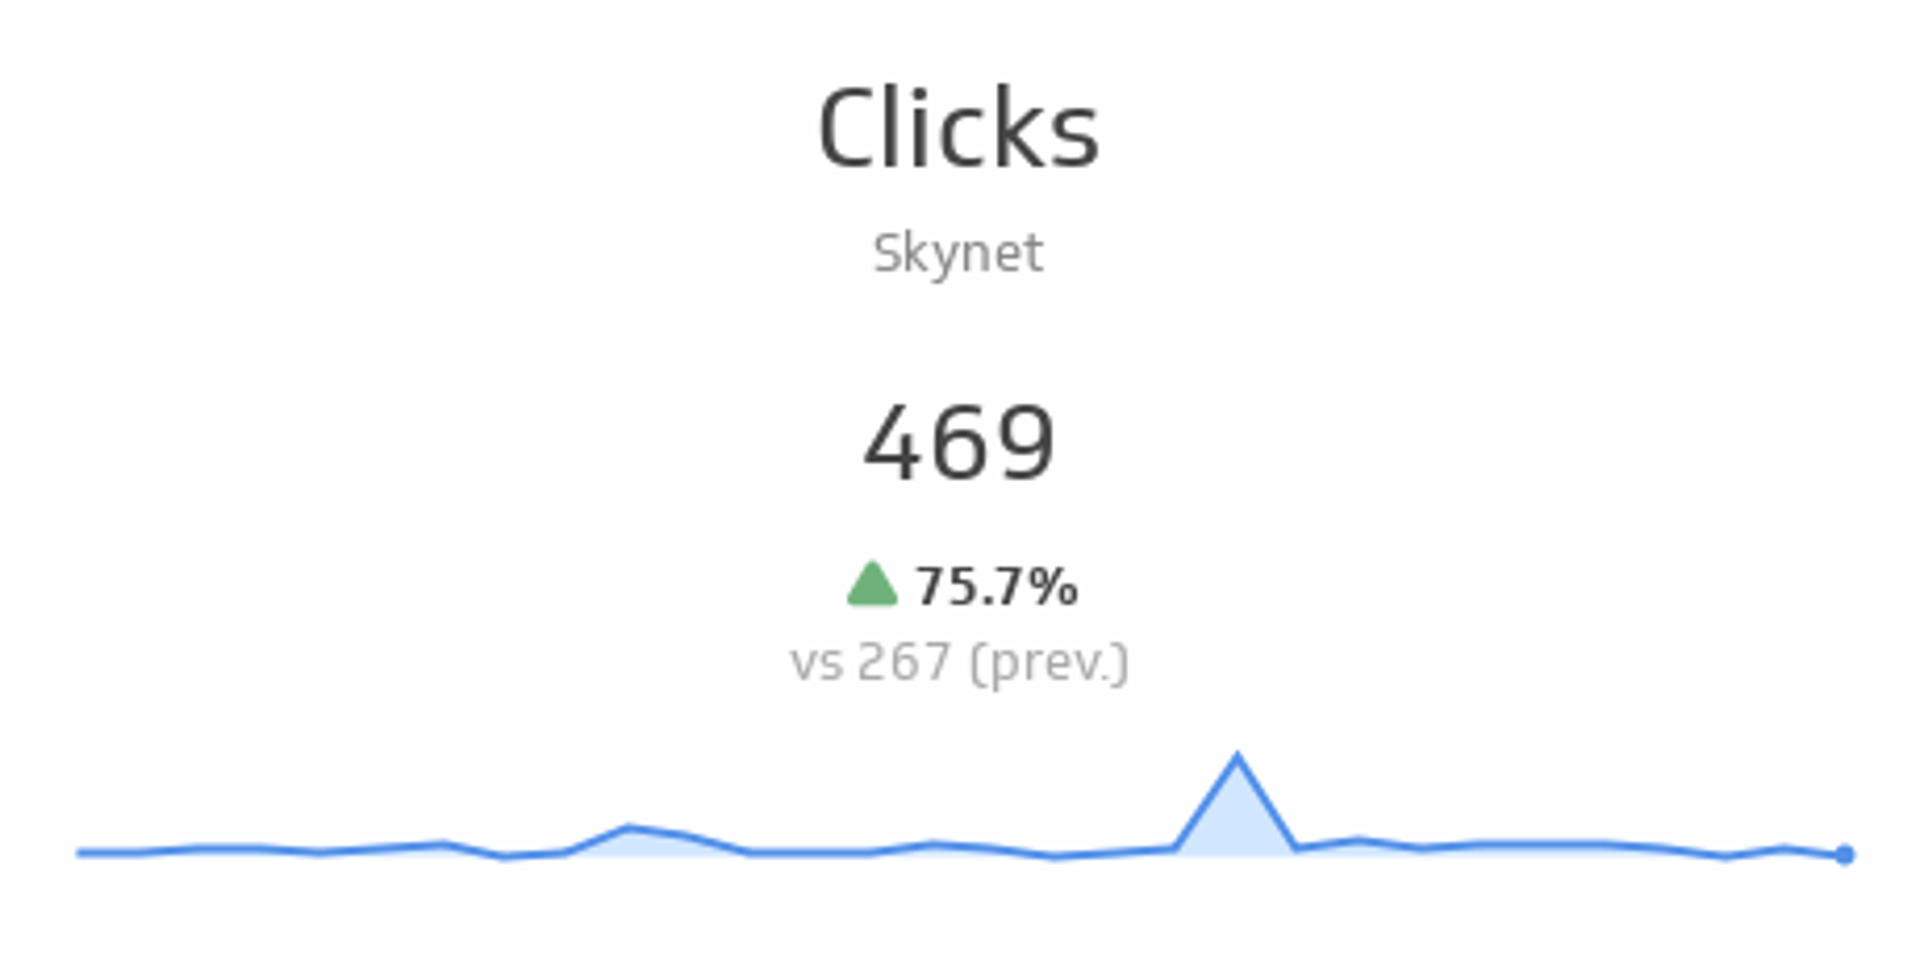
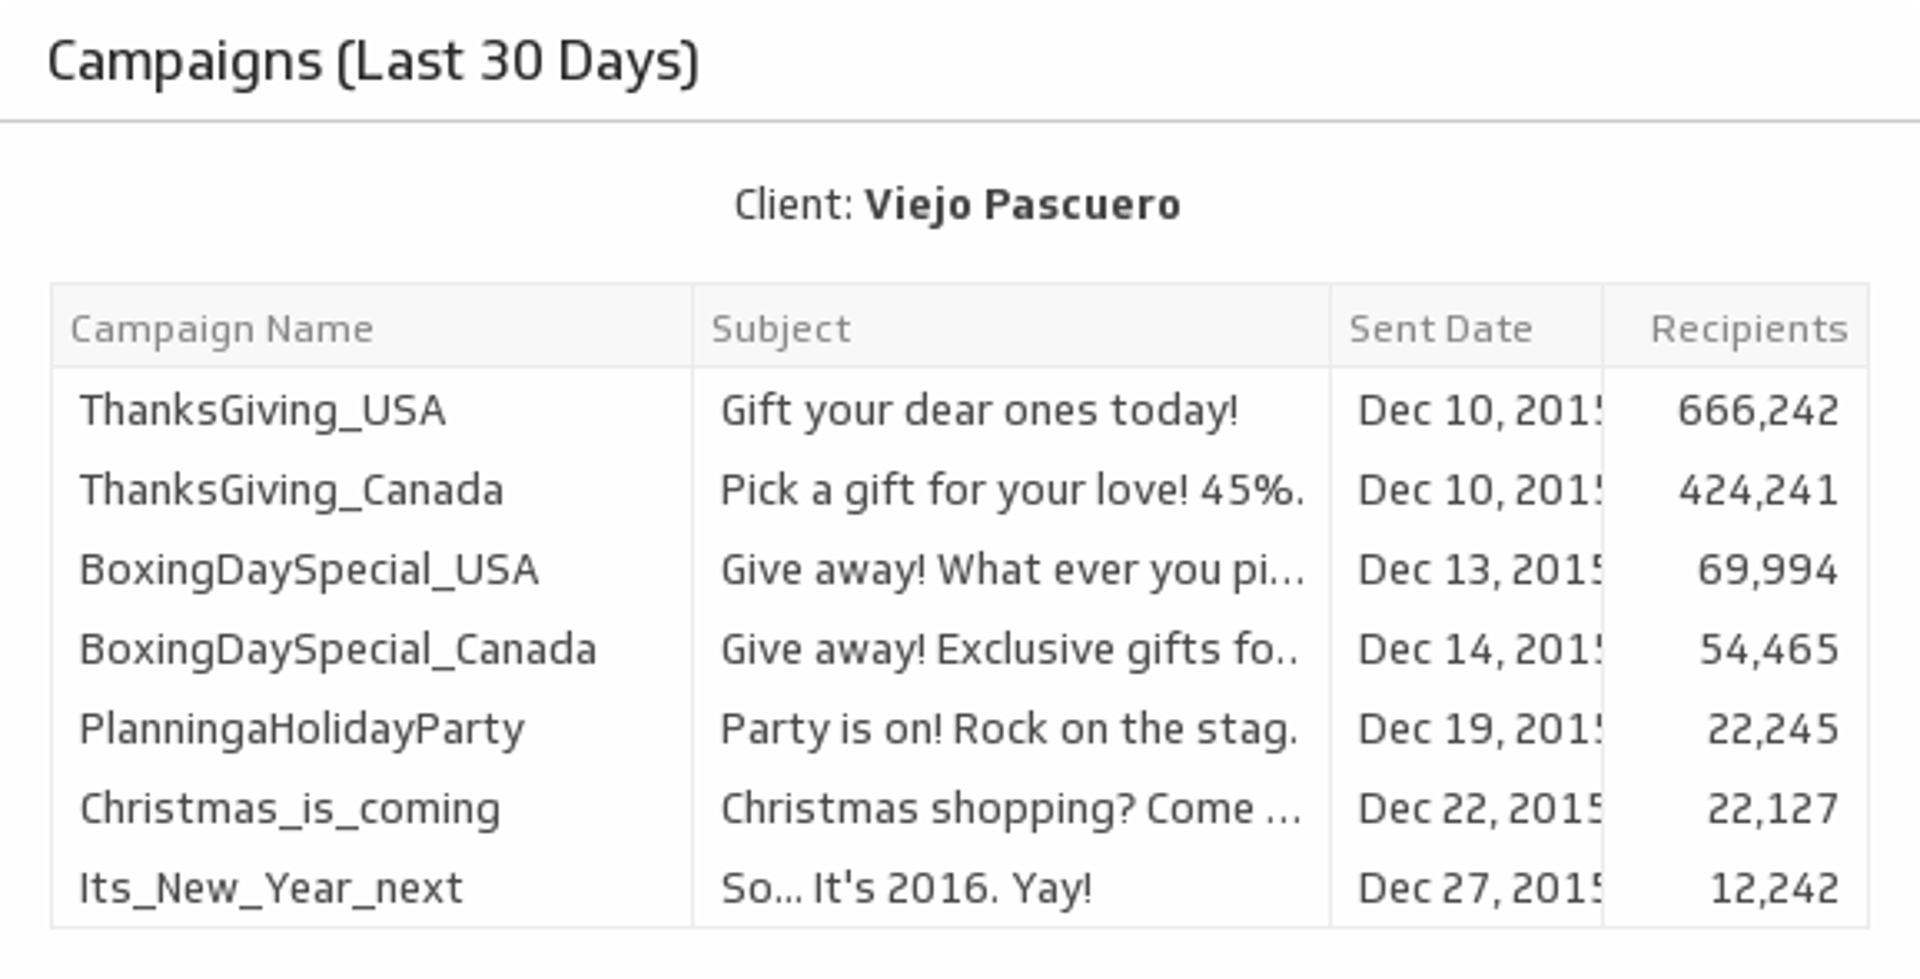
Google Sheets dashboard building tool
There's a story behind every Google Sheet. Be your data storyteller.
A Google Sheets dashboard is the perfect match.
Storing and playing with numbers in a static Google Sheet isn’t enough. Data needs to be visualized and then shared with ease. Without visual sharing, you’re stuck in your workbook with a confusing mess of numbers in rows, columns and tables. The beauty of an Google Sheet dashboard is that it presents your data in an open and clean format that makes sense to you and the people on your team.
How to build a Google Sheets dashboard?
- Connect your data
Upload your Google Sheet with our built-in Google Data integration. - Select your metrics
All you need to do is figure out what’s most important for you and your team to track. - Design your dashboard
Move your data around to create a dashboard that makes sense to you. Change colours, and add some vibrant graphs, charts, or indicators. - Share your data visualization masterpiece
Emails. PDFs. Web links. Presentations. TV dashboards. There’s no shortage of ways you can share and view your dashboard with your colleagues.
Top 4 Reasons why you should use Klipfolio for Google Sheets Dashboards!
At Klipfolio we understand how valuable your time is. Daily, weekly, monthly, quarterly and year-end reporting can be tedious, which is why we’ve made it easy for you. With Klipfolio, you can export your data insights to be included in your reports instantly. You'll save your time and money.
#1: Connecting your Google Sheets data is super easy
Connect your Google Sheets data using our pre-built connector to get started on building your custom dashboard right away.
#2: Create beautiful custom visualizations
Use the Klip Editor to design and build custom visualizations using your Google Sheets data. Power and total flexibility at your fingertips.
#3: Easily share your data visualizations
From scheduled PDF snapshots to beautiful TV dashboards, share your Google Sheets dashboard anyway you want. Share them via email, slack, on the web and much more.
#4: Bring ALL your favourite data to complete your data story
Your data may be scattered in different places, so how do those puzzle pieces fit together? Use out-of-the-box, hassle-free connectors for hundreds of data sources, including spreadsheets, files, databases, and web service applications.
Use what you know from Google Sheets already
Functions
You’ve probably spent a lot of time memorizing the functions process in Google Sheets. We have good news, your time has not gone to waste.
Cells
The cells you’re familiar with using to organize your data in an Google Sheets are virtually the same as the ones you’ll be using in Klipfolio’s Editor.
Tabs
Navigating through your data isn’t always easy, especially when you have multiple spreadsheets in one file.
Why create a Google Sheet dashboard?
Accurate data for you and your team, anywhere.
A Google Sheet dashboard gives everyone access to the same information. Your team will know where they stand and can make decisions in seconds, backed by data. From TVs, to email reports, to mobile phones and tablets, look up numbers on-the-go.
Understand your spreadsheets with colourful visualizations.
Google Sheets has a function that allows you to creates charts and tables. But it’s limited. With a dashboard, the power to customize and design is yours. Bring your data to life with a variety of visual bar charts, tables and infographics.
Automatic updates to stay on top of your game.
A Google Sheet dashboard updates automatically: With your Google spreadsheet data stored in the Cloud, your results come to you with real-time reports whenever you need.
Ready to start building your custom dashboard using Google Sheets?
Before you get started, take the time to read our best practices blog on How to Build a Dashboard using Google Sheets. You'll learn all the important basics to get started more quickly including:
- Database layout
- Data format
- Automating the data transfer
- Infinite and automatic formulas
- Infinite ranges
- Rolling periods of time
Use the Connector Gallery to create a custom Google Sheets dashboard
With our Connector Gallery, you can create custom API queries to pull in data from your Google Sheets account. Building custom queries allows you to specify the metrics and time periods that you want to track.
You can use custom queries to build out visualizations in Klipfolio. You can also combine your Google Sheets data with other relevant data to create your custom dashboard.
Learn more about working with the Google Sheets API and how you can start building your own Google Sheets queries in Klipfolio.
