HubSpot
Connect HubSpot to Klipfolio to build automated marketing and sales dashboards. Combine HubSpot data with 100+ other sources and share live reports with your whole team.
Track all your HubSpot KPIs in one place
Sign up for free and start making decisions for your business with confidence.


Stop manually exporting HubSpot data to build reports. Connect HubSpot to Klipfolio and get live dashboards that update automatically — so you and your team always know where you stand.
How to connect HubSpot to Klipfolio
Connecting HubSpot to Klipfolio is straightforward. Follow these steps to get your first dashboard running:
- Log in to Klipfolio and navigate to the Add Data section.
- Search for HubSpot in the connector library and select it.
- Authenticate your account using OAuth — you'll be redirected to HubSpot to authorize the connection.
- Select the metrics you want to pull in (contacts, deals, email performance, and more).
- Build your dashboard using pre-built templates or a custom layout.
View the step-by-step setup guide
Top reasons to use HubSpot dashboards in Klipfolio
There's a lot you can do once your HubSpot data flows into Klipfolio:
Centralize your marketing and sales data. Combine HubSpot metrics with data from Google Analytics, Facebook Ads, and 100+ other sources in a single dashboard.
Share performance with your whole team. Distribute dashboards via TV mode, public links, scheduled PDF emails, or embedded views — no HubSpot login required for viewers.
Monitor what matters in real time. Track contacts, deals, email open rates, and pipeline value with refresh rates as fast as one minute.
Build dashboards that match your workflow. Use Excel-like formulas and flexible layouts to create reports tailored to your team's goals — not just the defaults HubSpot provides.
Keep everyone aligned. One live dashboard replaces scattered screenshots, manual exports, and out-of-date slide decks.
What Klipfolio adds to HubSpot
You already use HubSpot to manage your marketing, sales, and customer success. Klipfolio extends what you can do with that data.
| What you do in HubSpot | What Klipfolio adds |
|---|---|
| View reports inside the HubSpot interface | Share live dashboards with anyone — no HubSpot seat required |
| Export data manually for team updates | Automated dashboards that refresh and distribute on a schedule |
| Build reports limited to HubSpot data | Combine HubSpot with Google Analytics, ad platforms, and more |
| Use HubSpot's default chart types | Choose from 30+ visualization types with custom themes and branding |
Stop the manual exports. Connect HubSpot to Klipfolio and start automating your reporting today.
Use pre-built HubSpot metrics
Assemble a HubSpot dashboard by selecting pre-built metrics from the Klip Gallery.
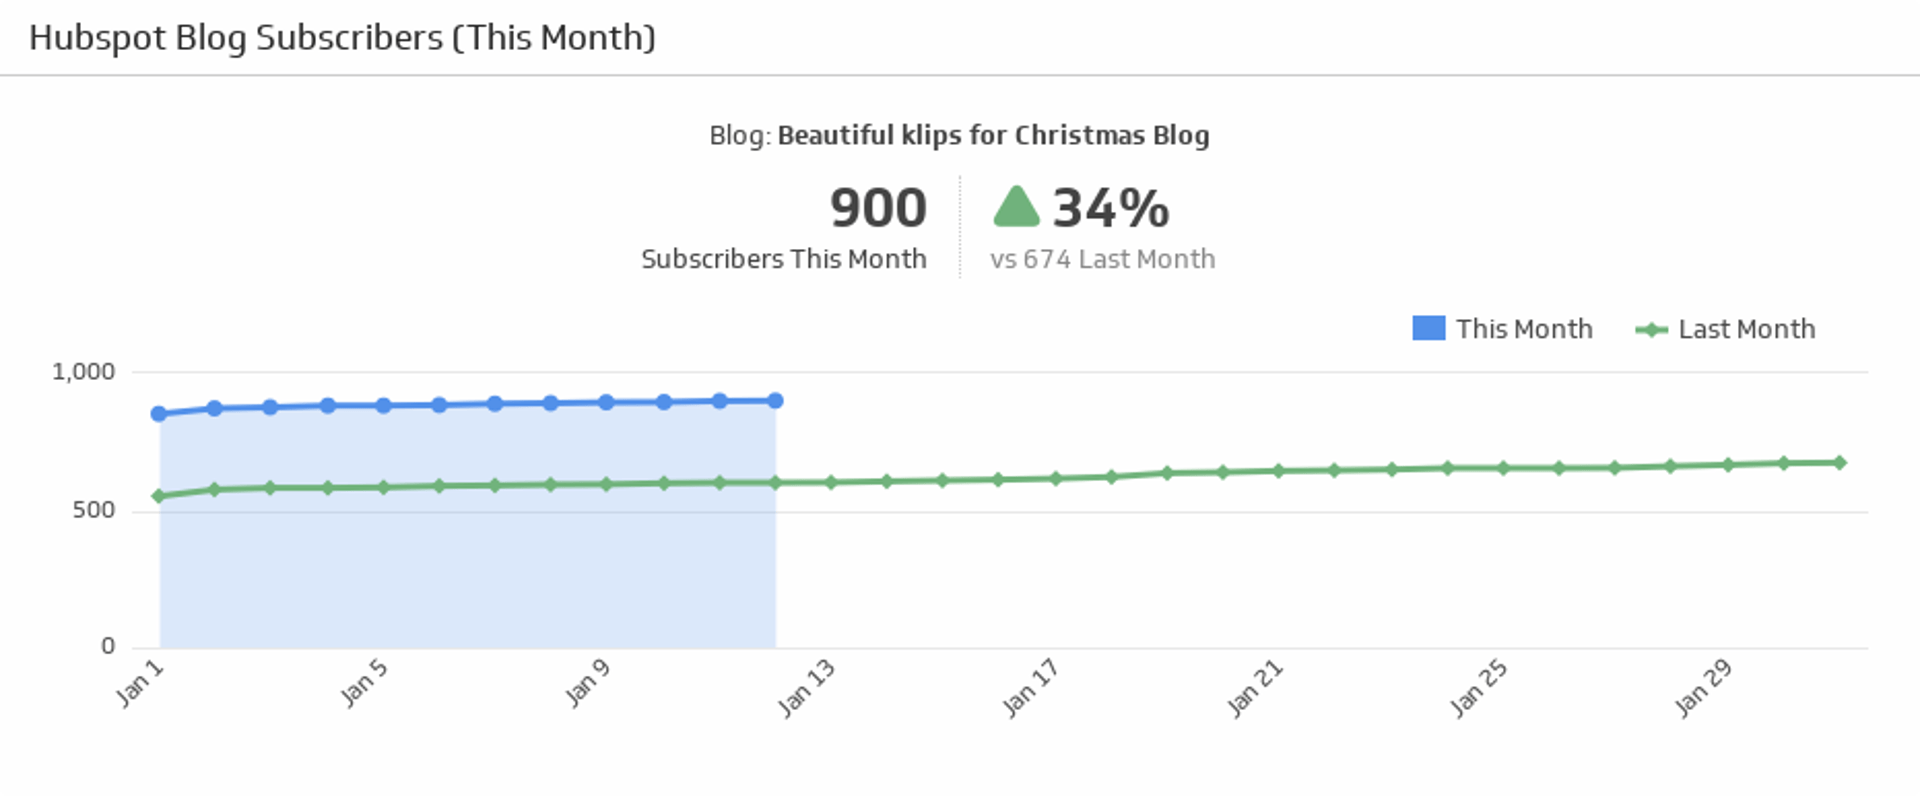
Blog Subscribers (This Month)
Track the number of subscribers for this month and compare it against the last month subscribers count.
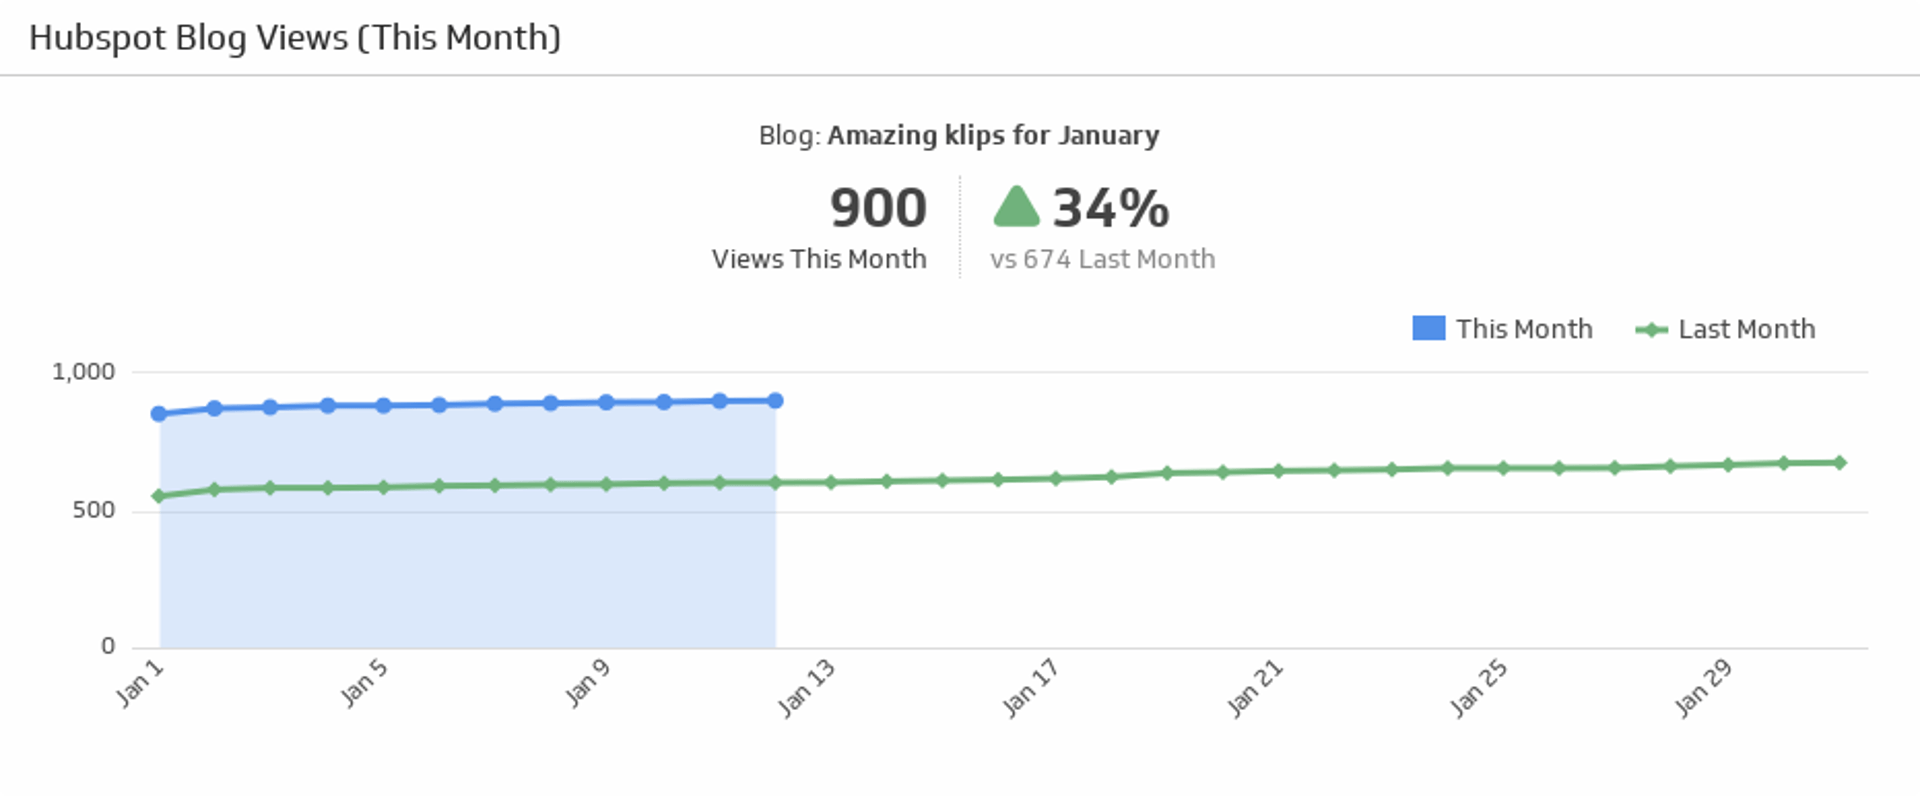
Blog Views (This Month)
Compare how many people looked at your blog this month and last month, and use the handy indicator to quickly see if the percentage of views is up or down.
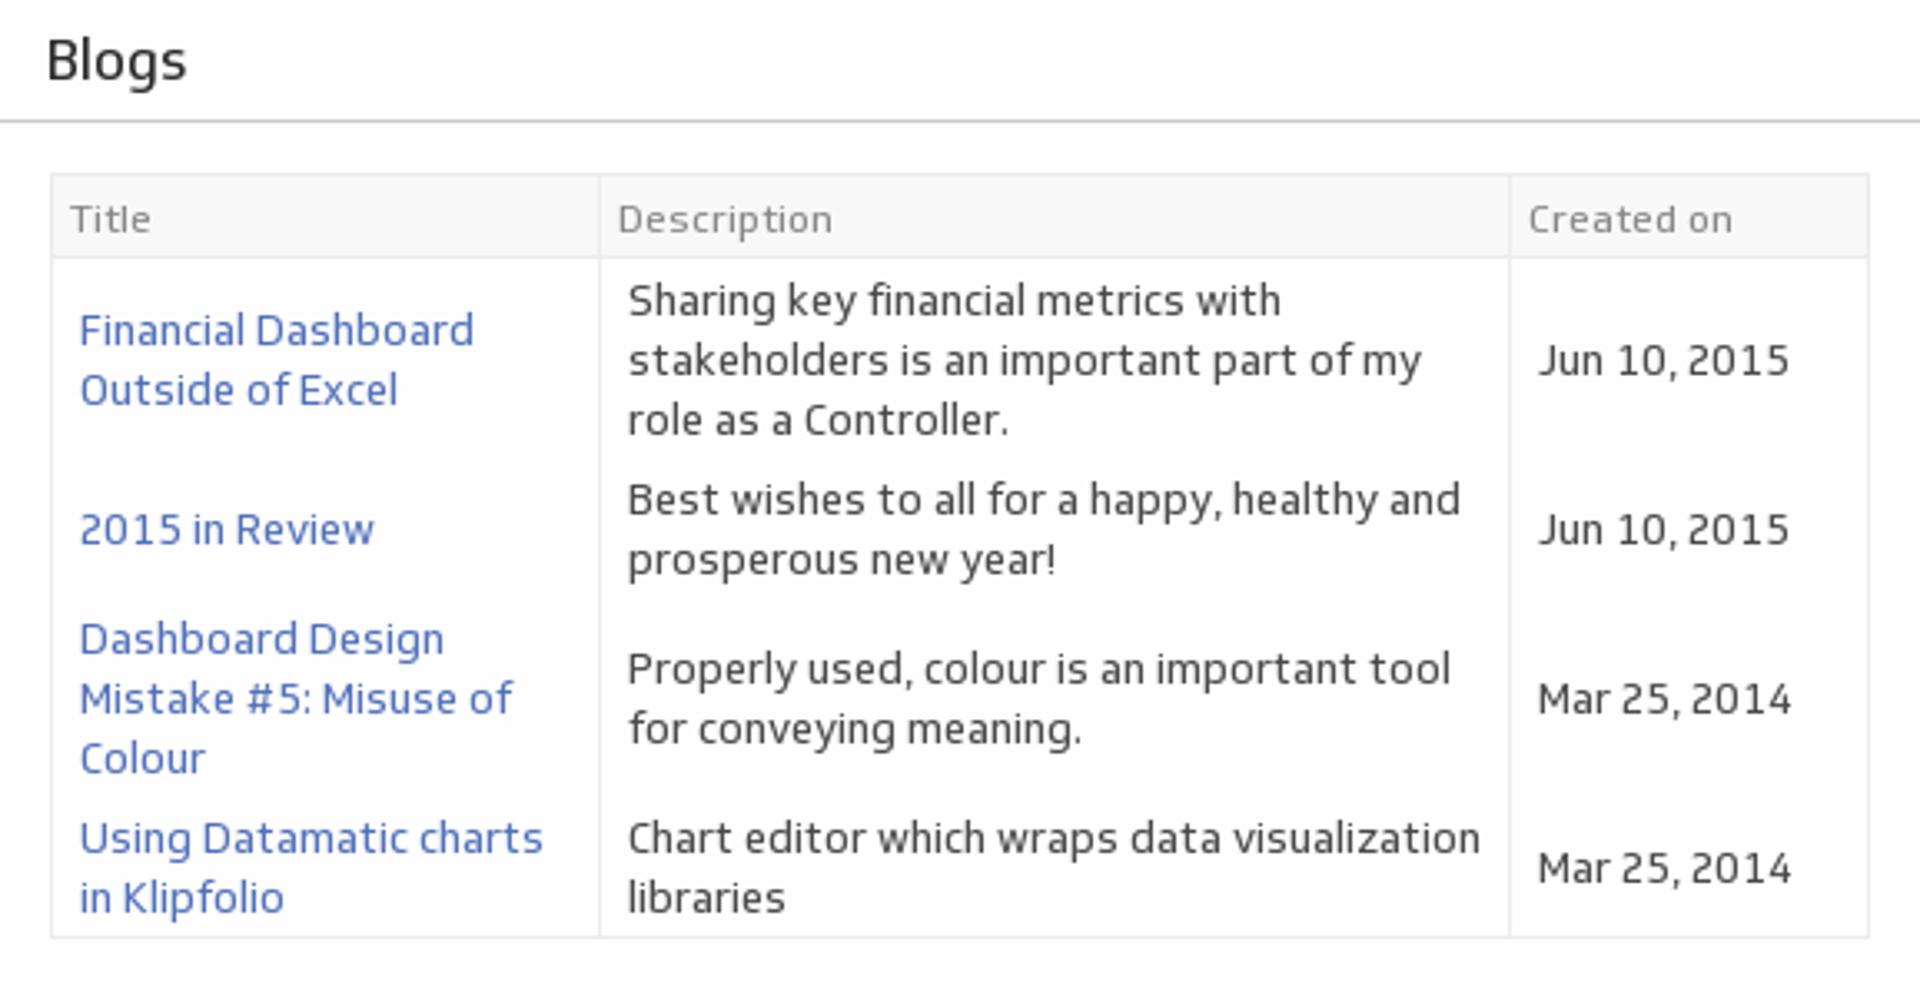
Blogs
Use this at-a-glance chart to track when your latest blog posts came out, and what their topic was.
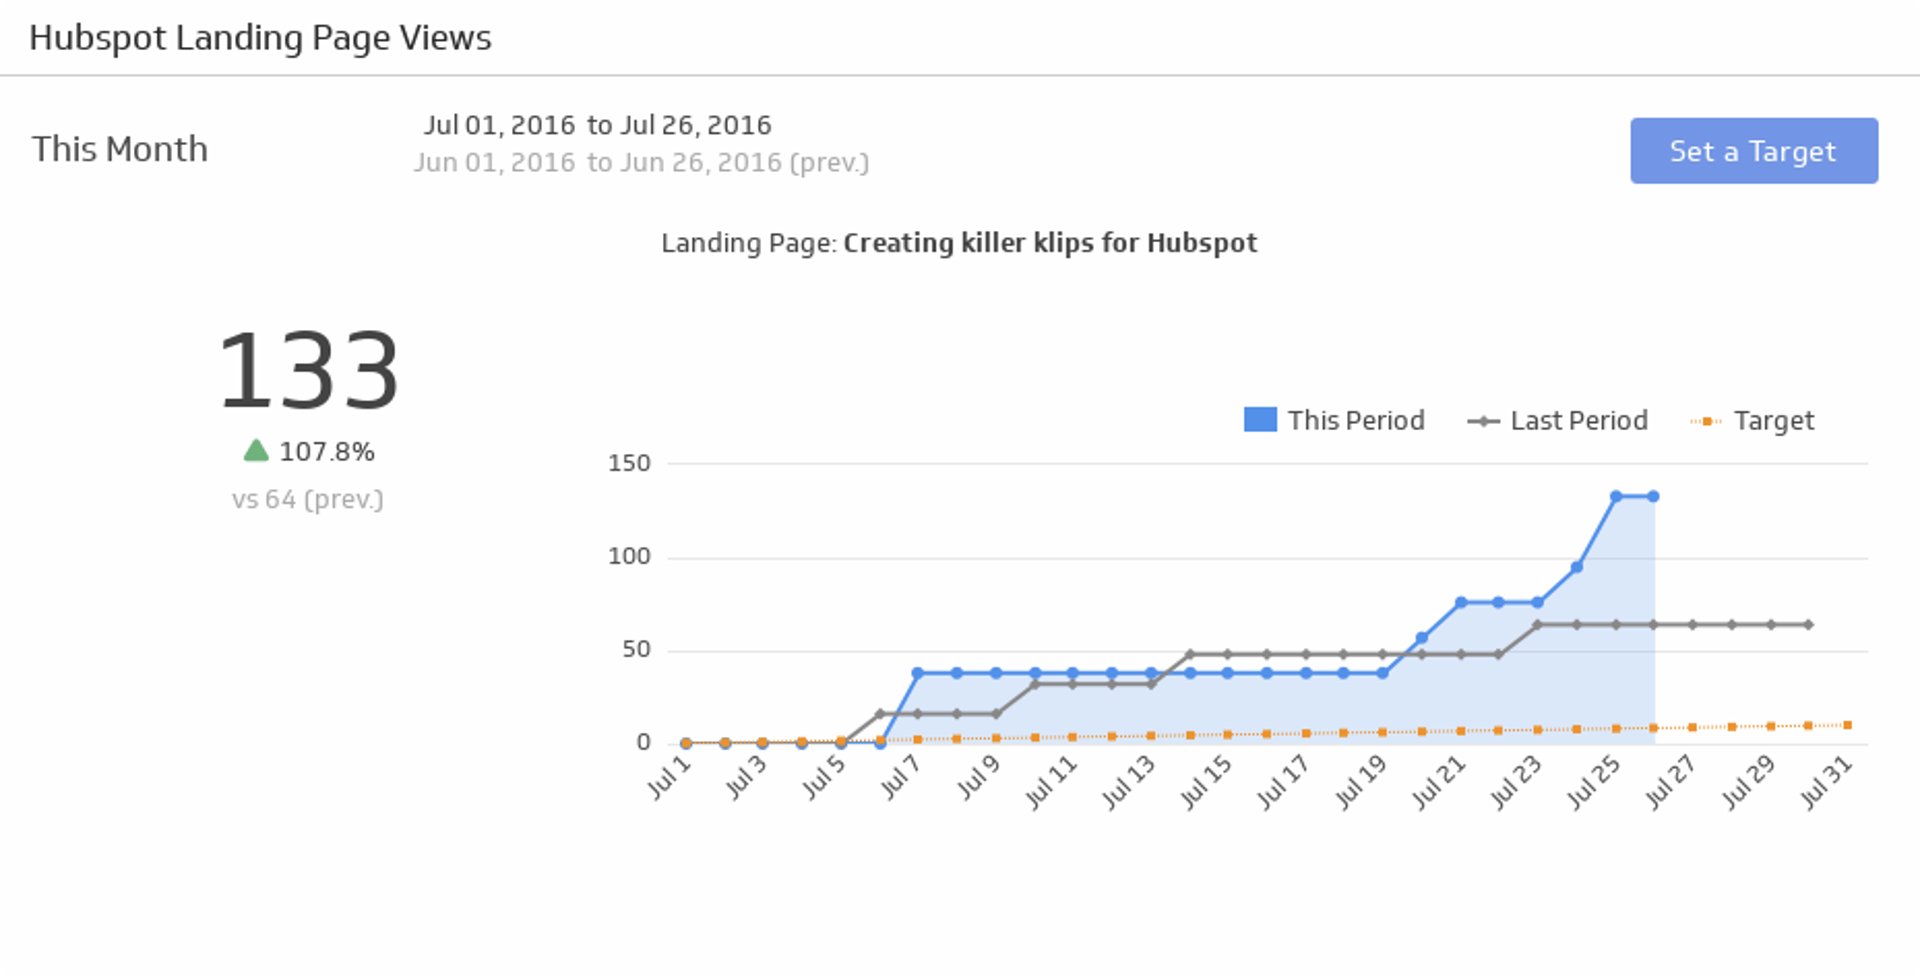
HubSpot Landing Page Views
Make sure your website is generating interest by tracking the number of views over the time period of your choice.
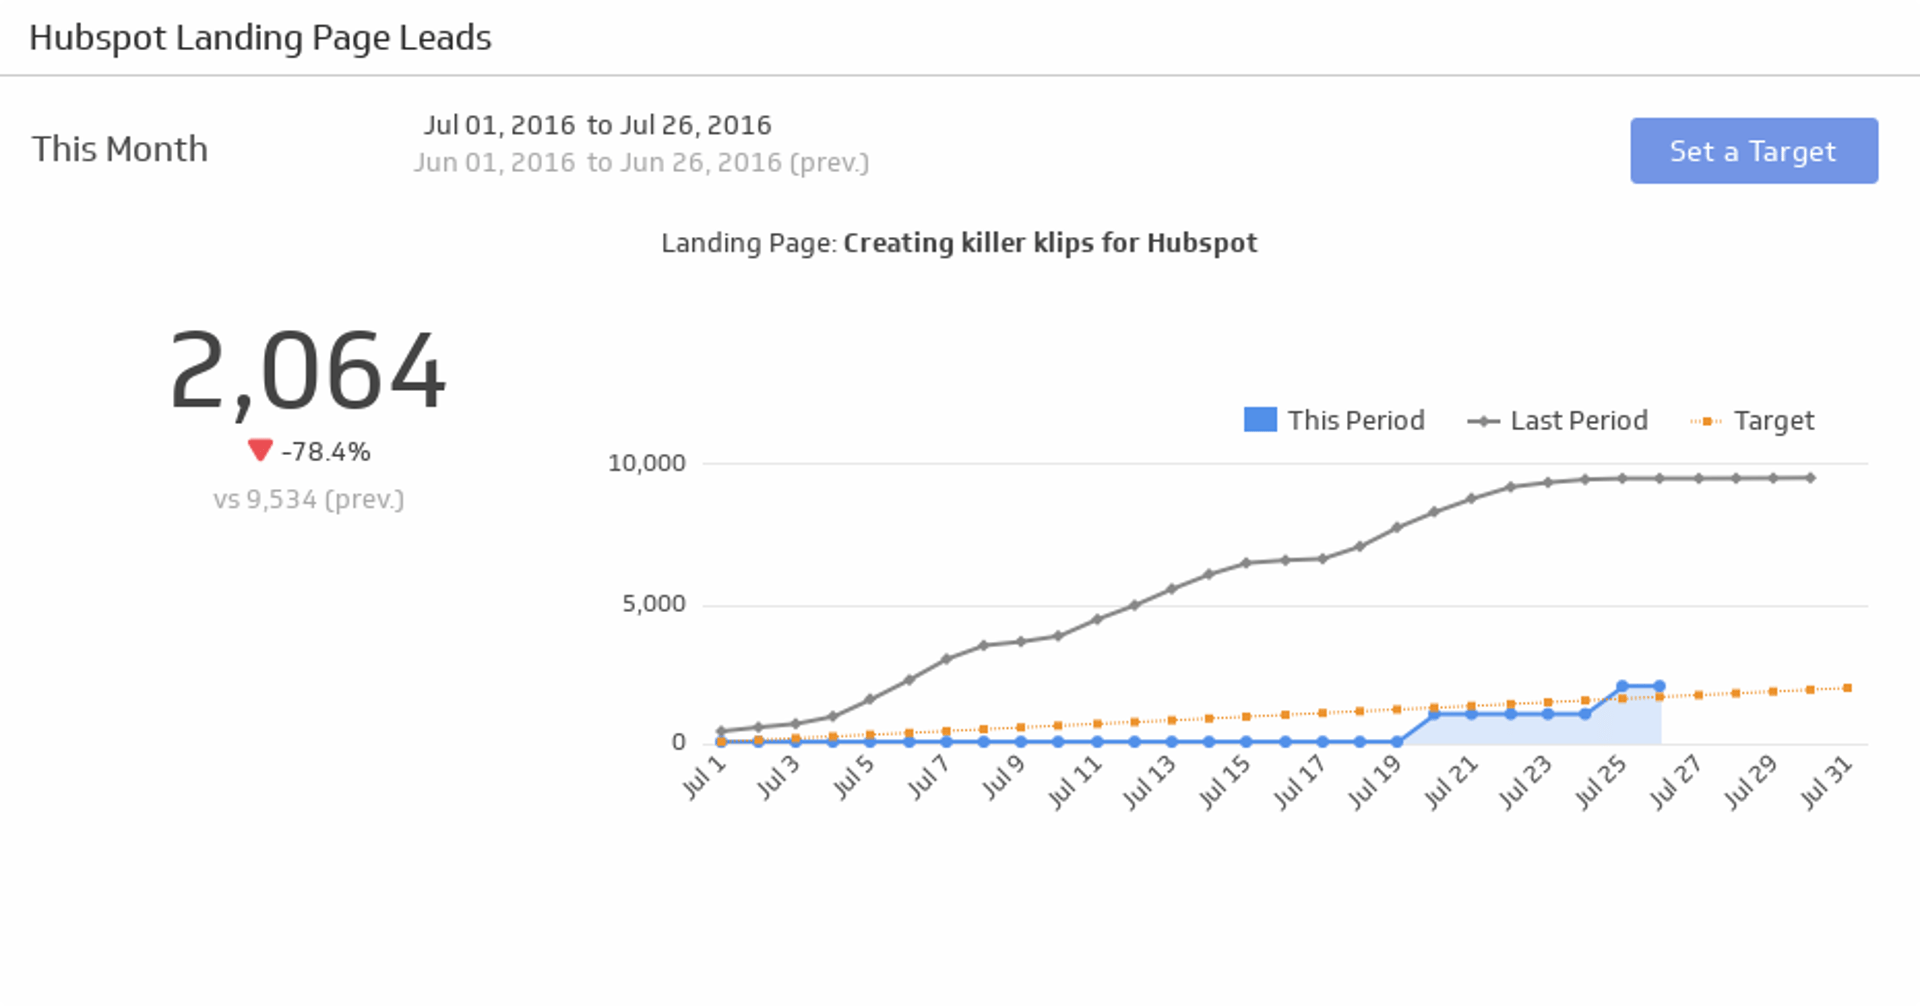
Landing Page Leads
With data as your secret weapon, turn your landing page in to a lead-generation powerhouse.
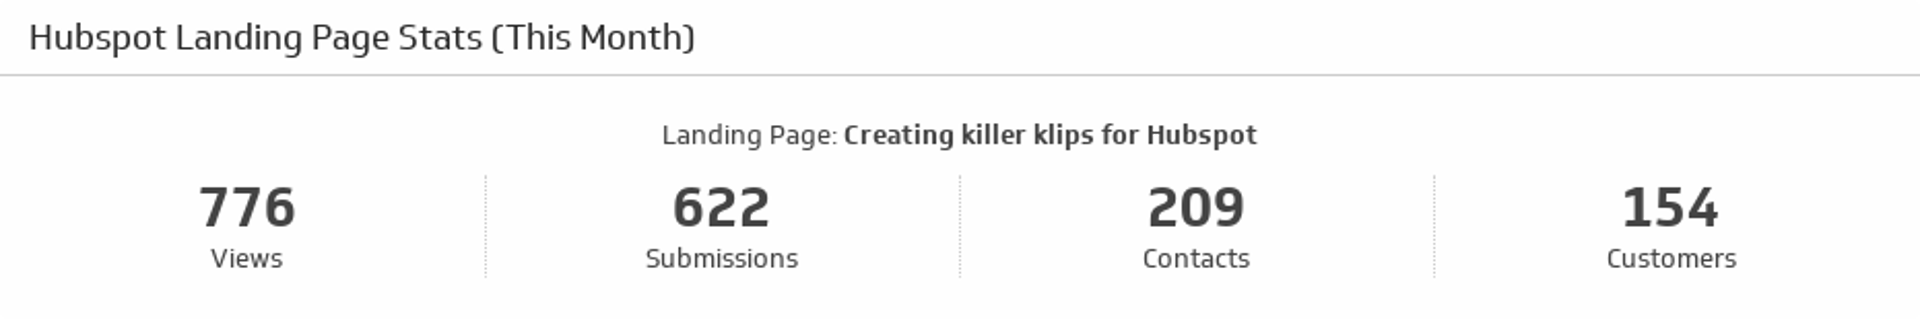
Landing Page Stats (This Month)
A quick and easy report on the status of a landing page, featuring a list of key landing page metrics for this month.
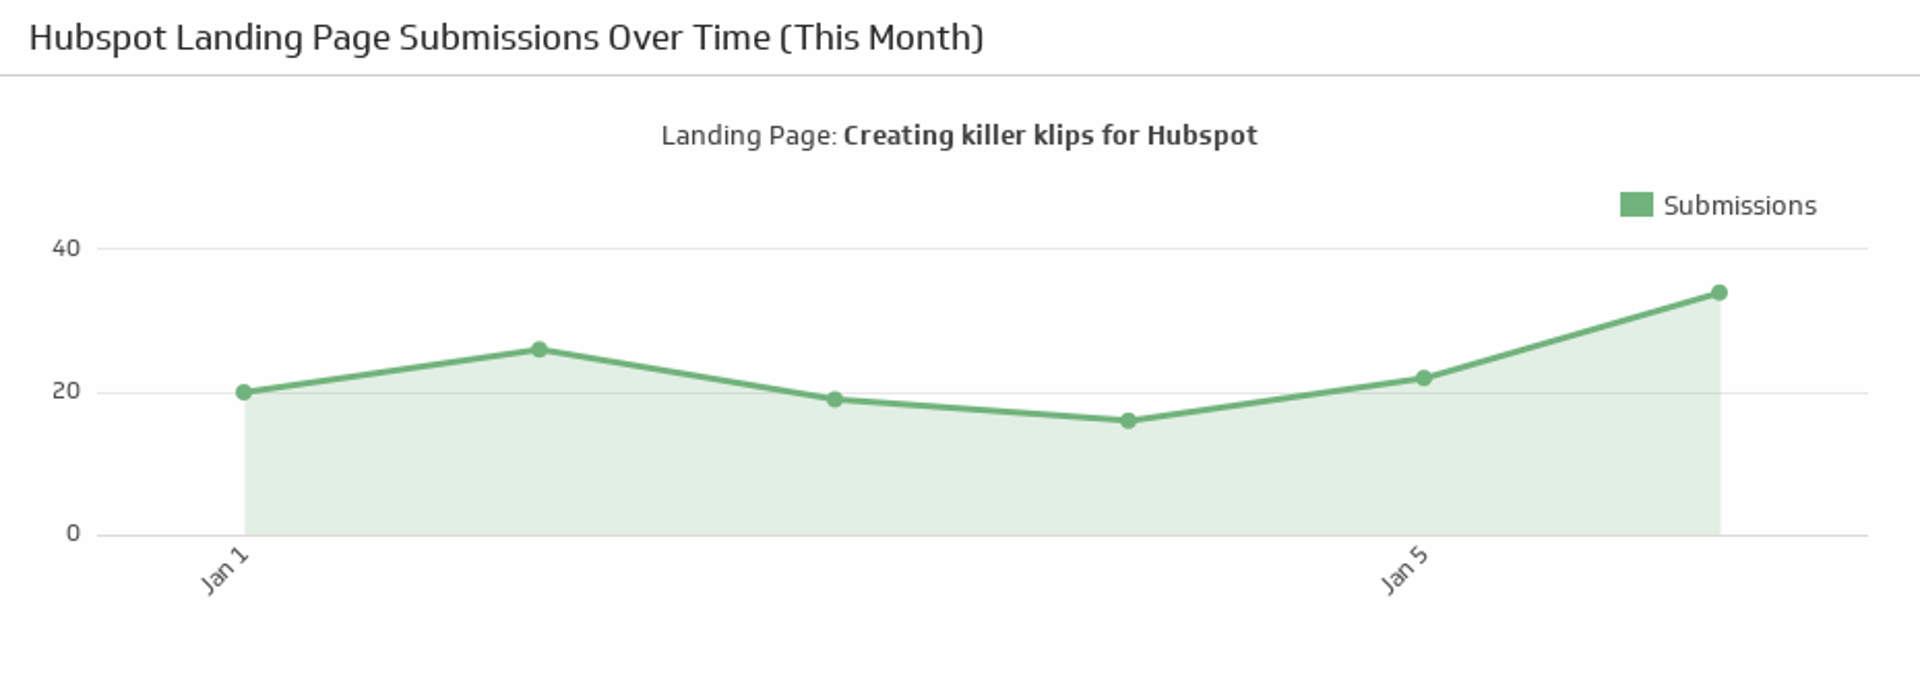
Landing Page Submissions Over Time (This Month)
Track submissions on your chosen landing page this month.
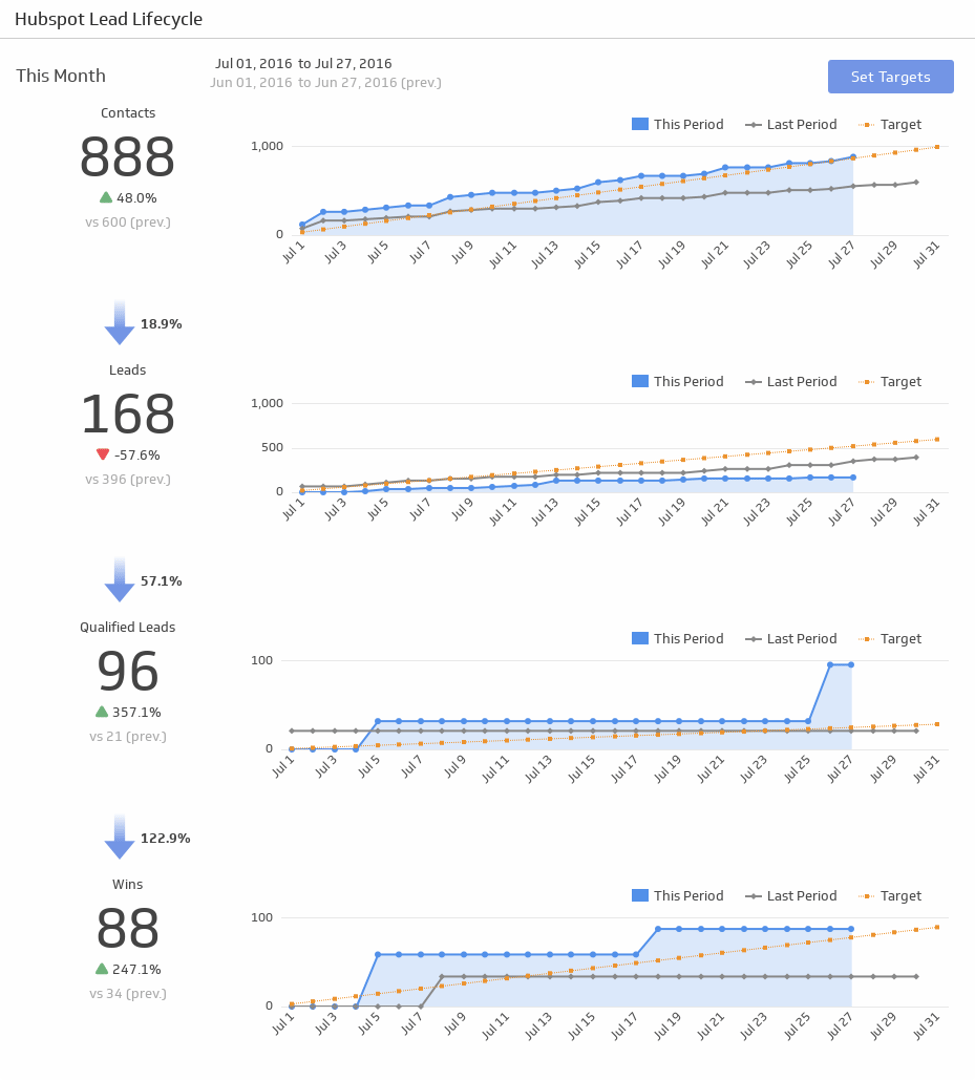
Lead Lifecycle
Take your marketing funnel to the next level! This is a complete lead lifecycle funnel with total numbers at each stage, with visualizations of your progress.
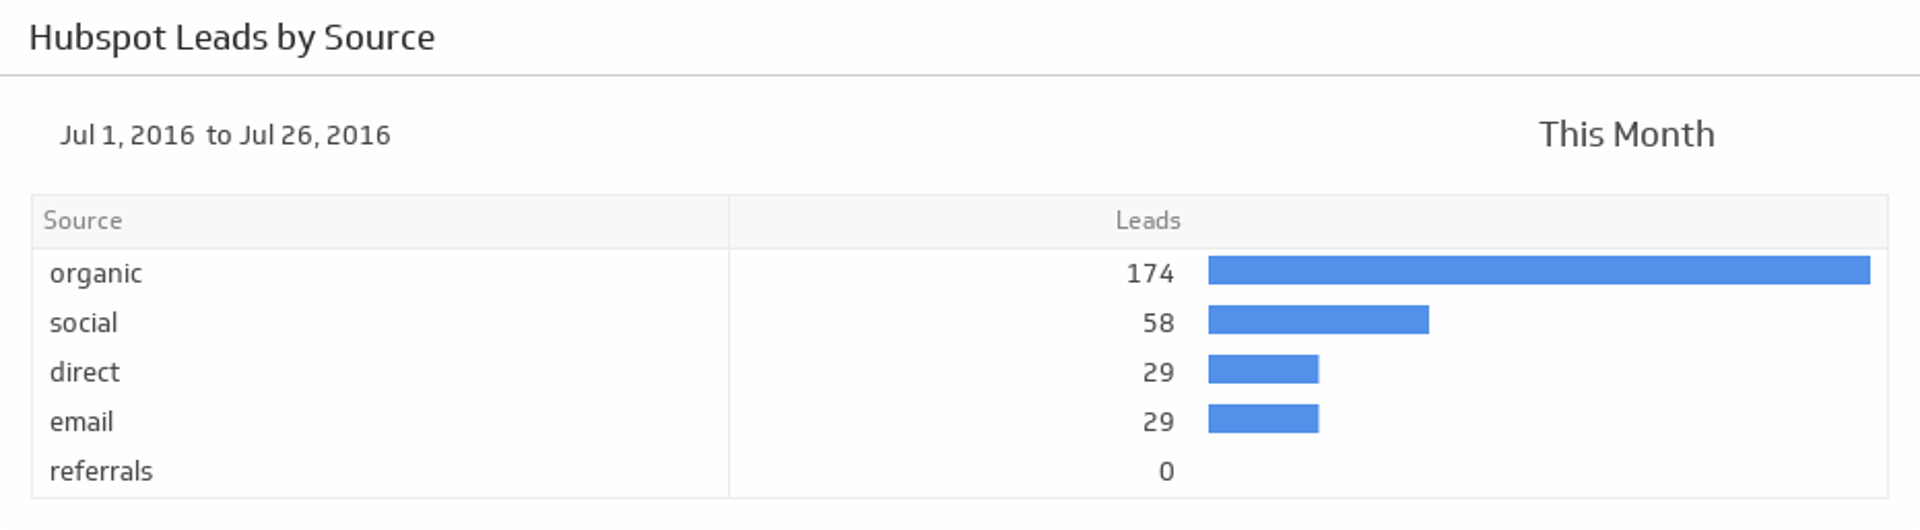
Leads by Source
Segment your leads by source and discover which sources are bringing in the most and the least leads during the time period of your choice.
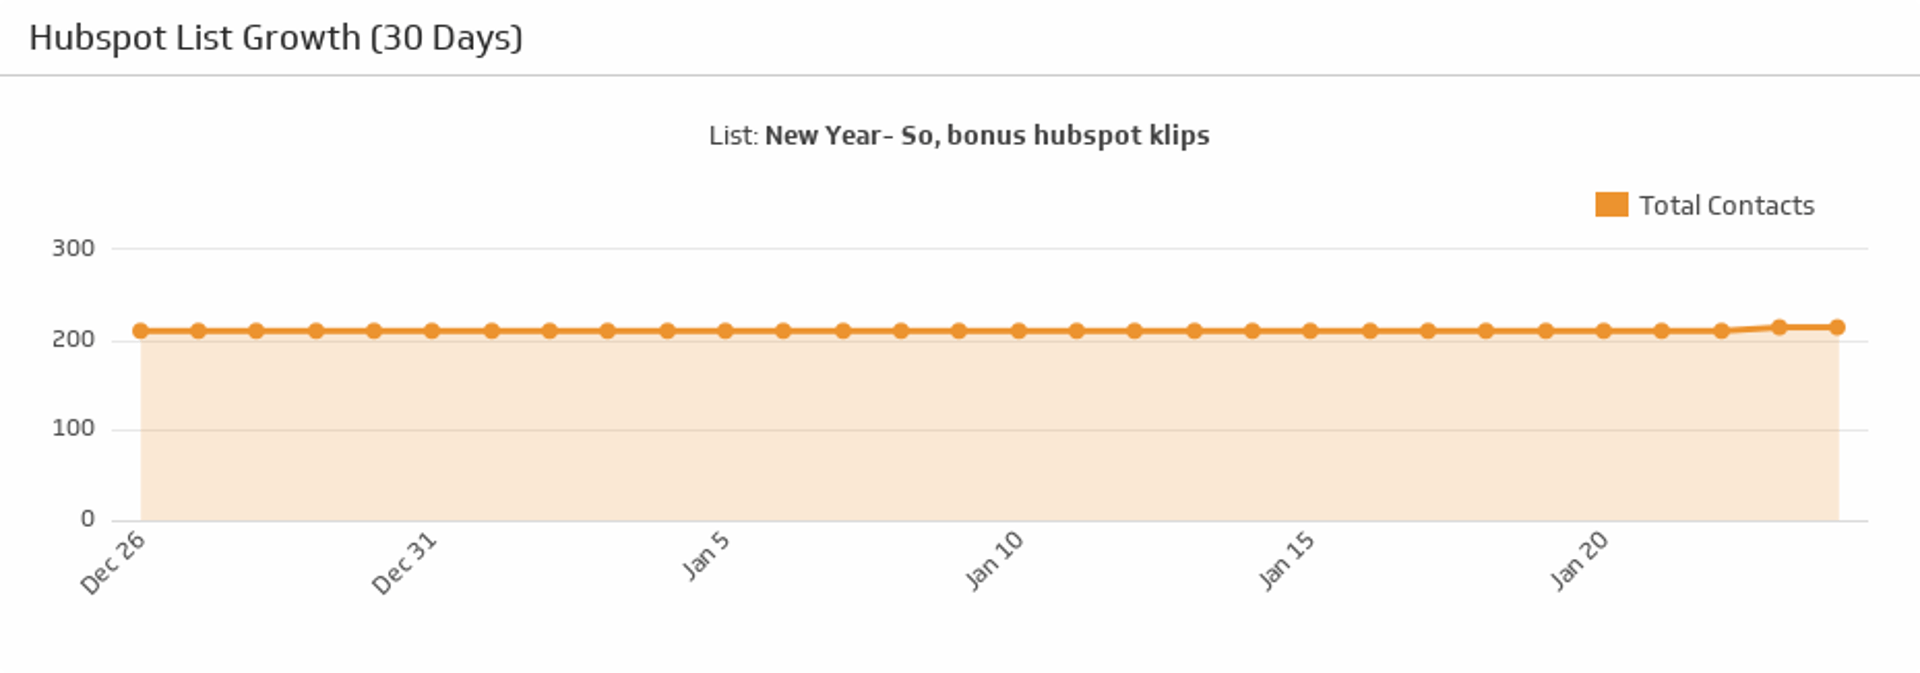
List Growth
Select one of your HubSpot lists and see how it has grown over the past 30 days.
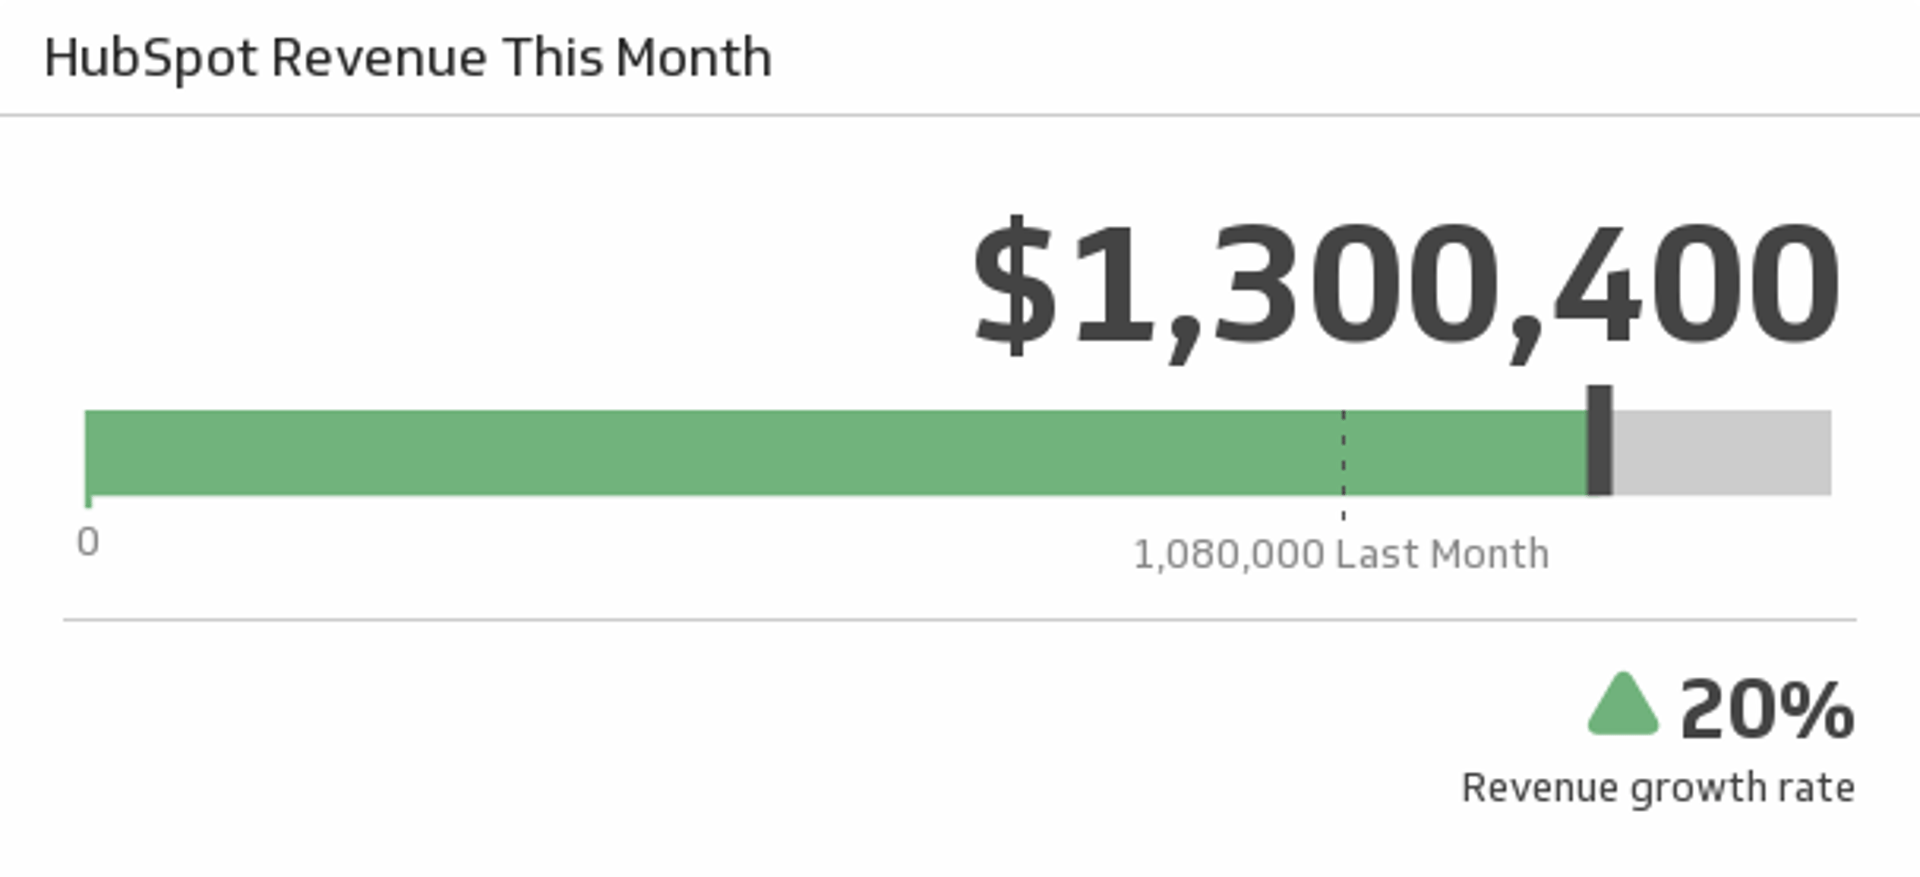
Revenue This Month
Track your total revenue this month, and compare it to last month and your revenue growth rate.
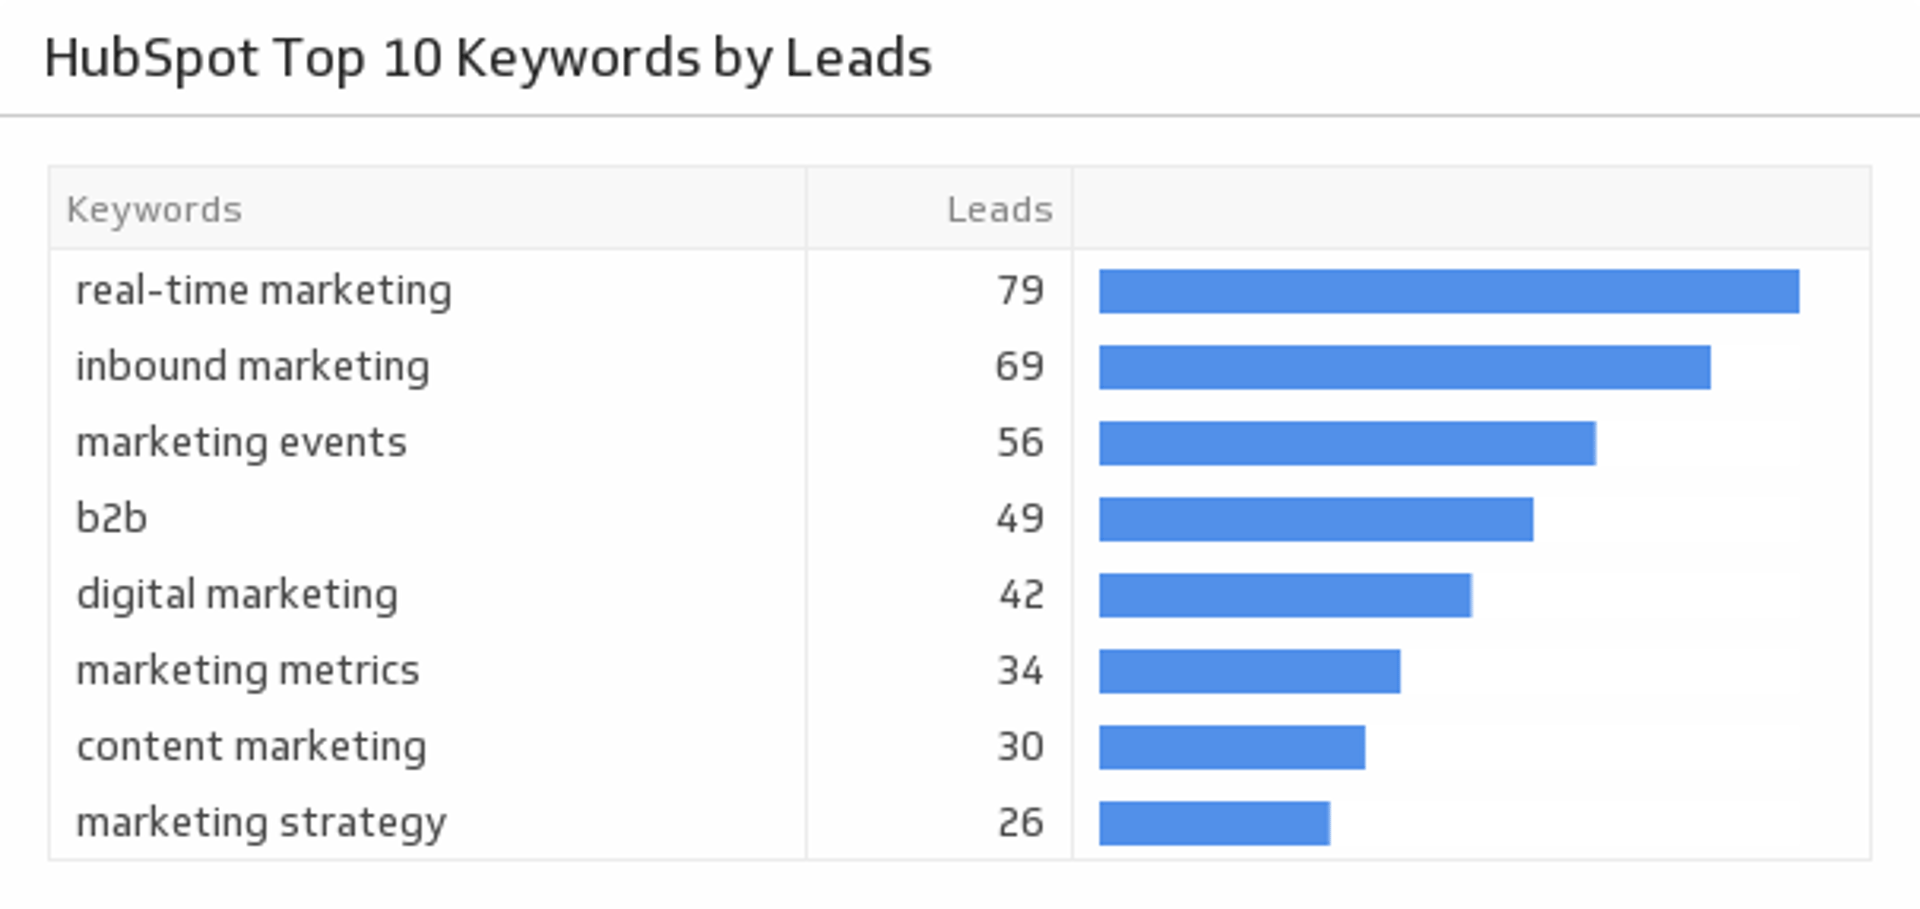
Top 10 Keywords by Leads
Compare your top 10 keywords with the number of leads they generate.
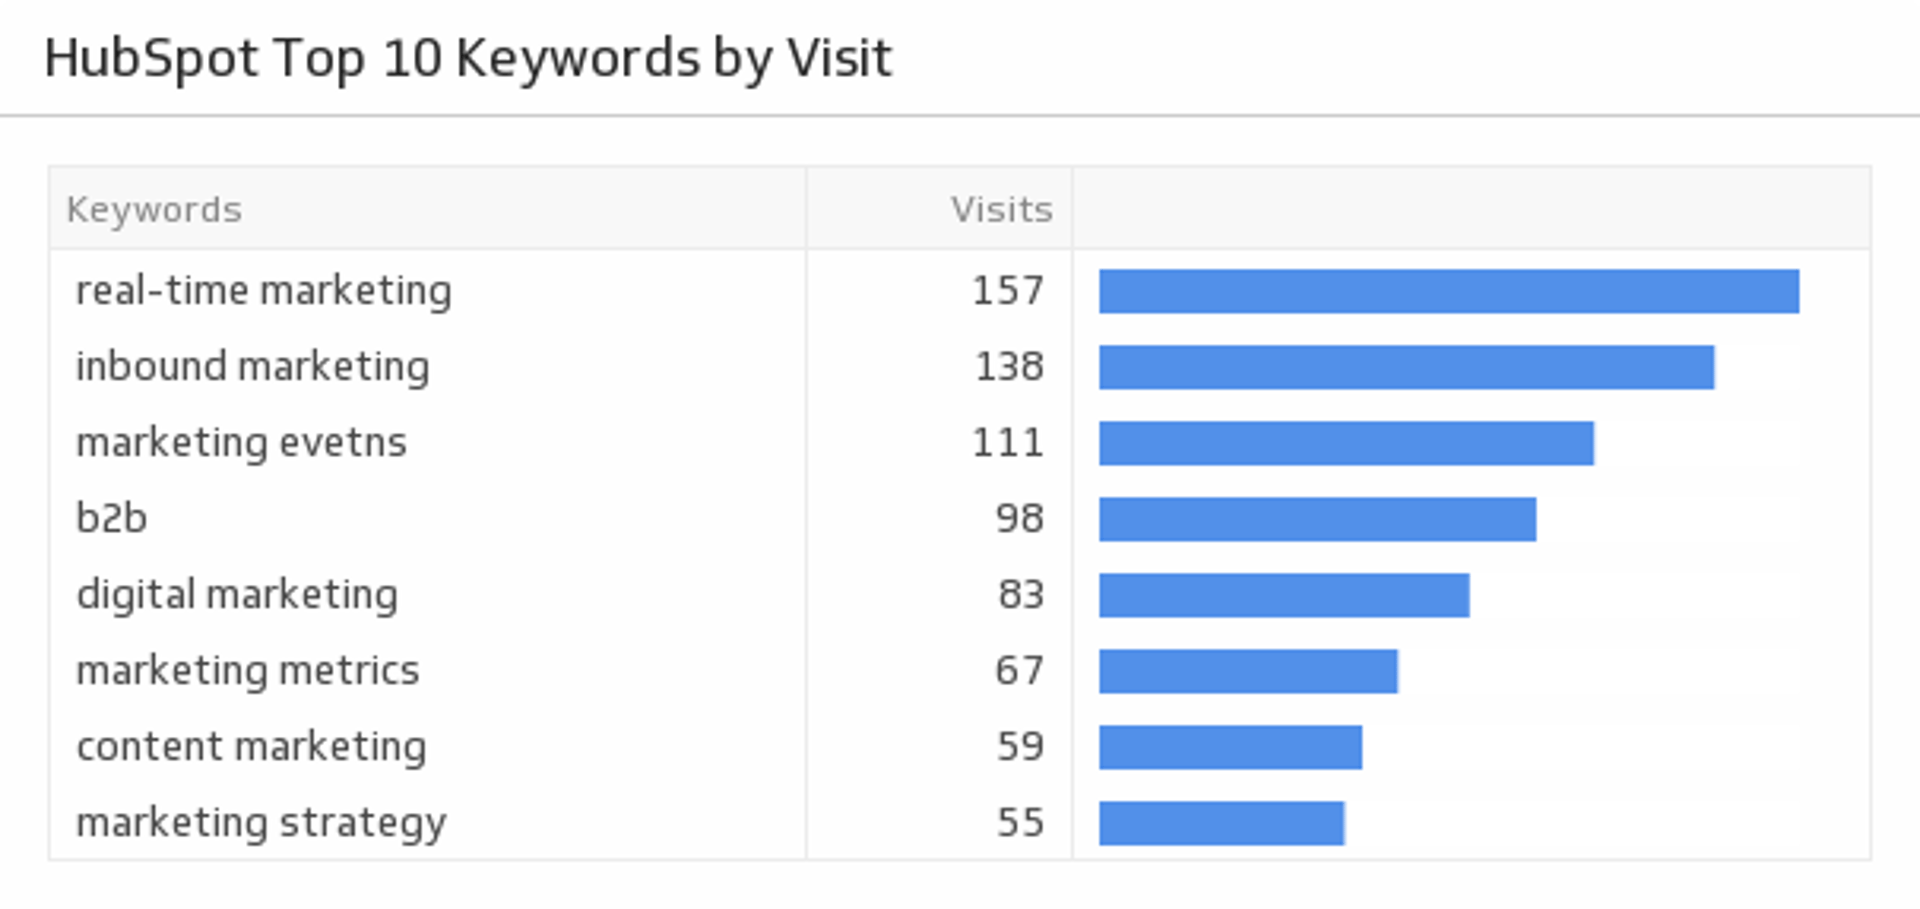
Top 10 Keywords by Visits
Compare your top 10 keywords with the number of visits they generate.
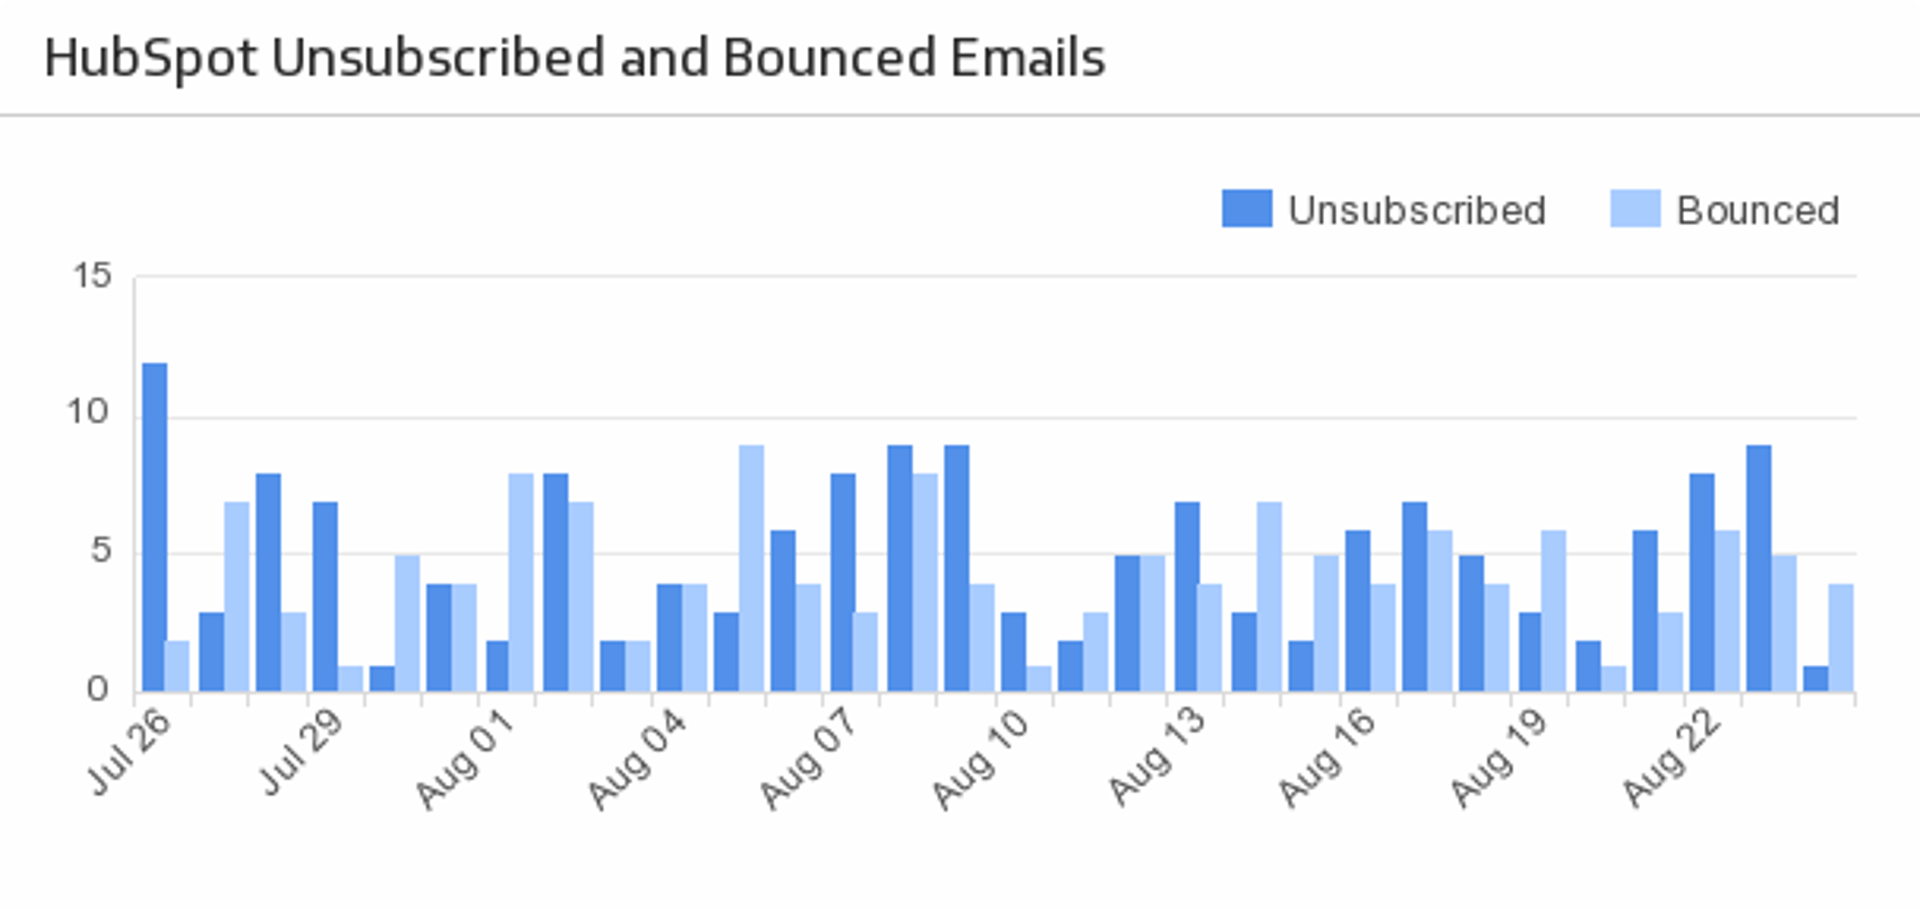
Unsubscribed and Bounced Emails (Last 30 Days)
Plot the number of the email recipients that either unsubscribed or bounced within the past 30 Days.
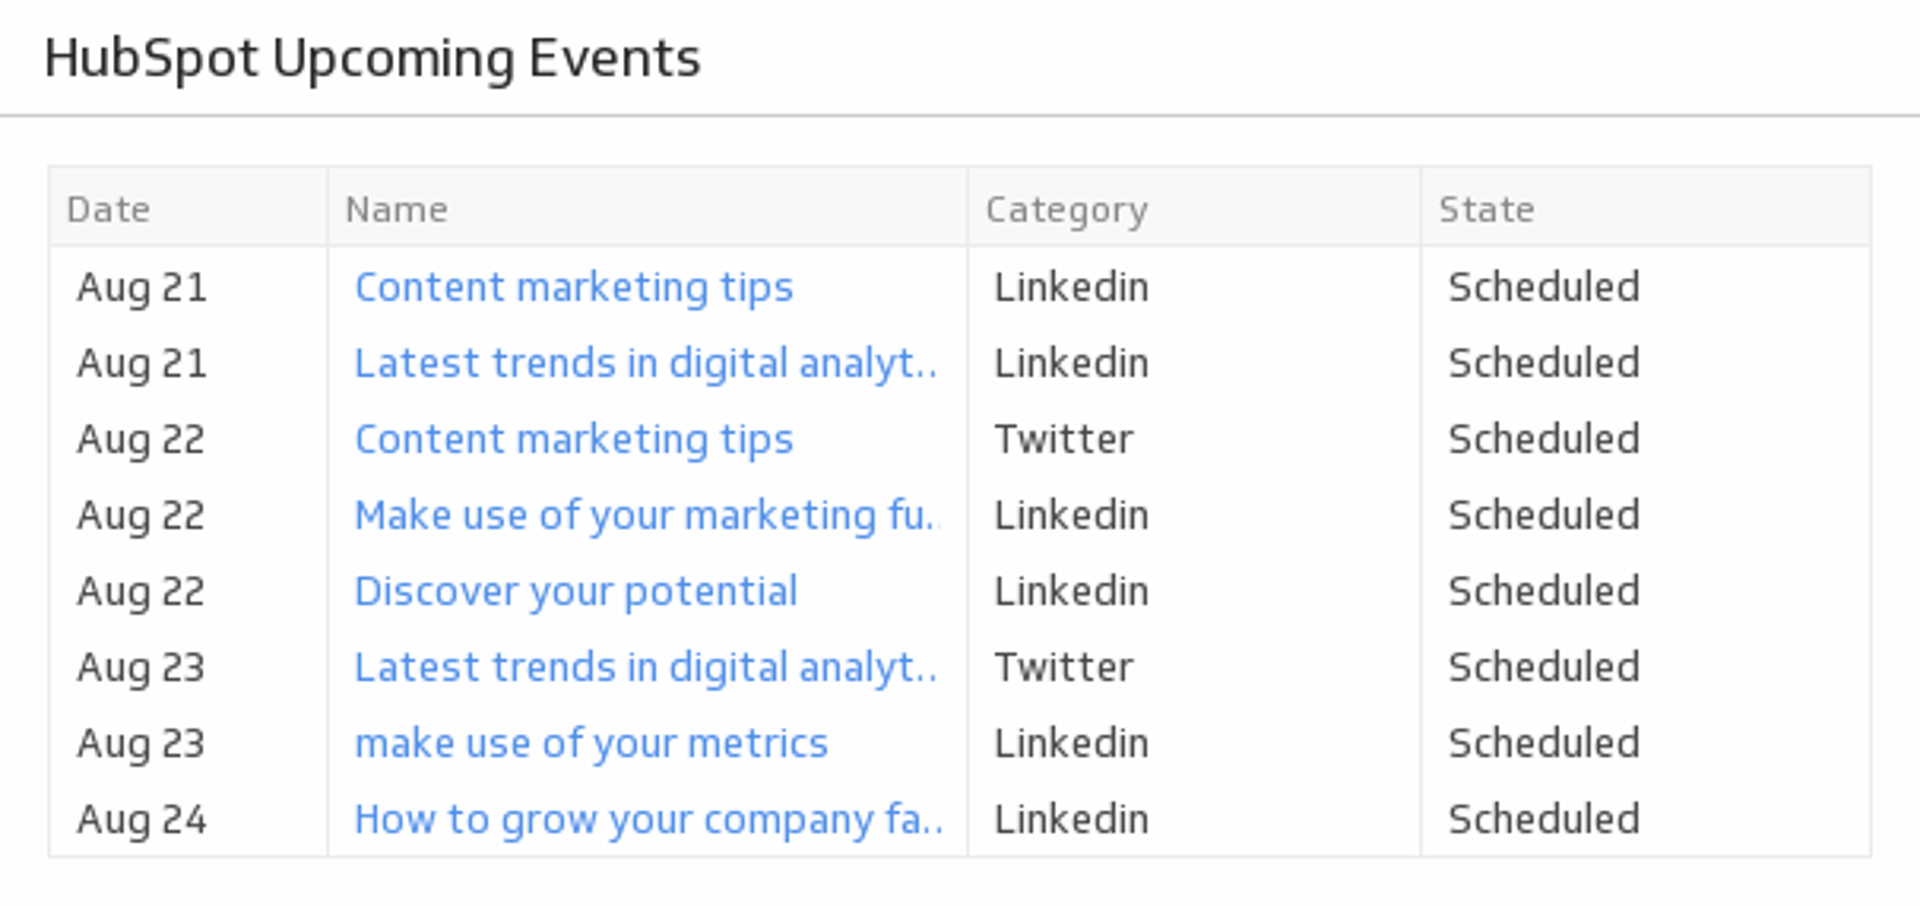
Upcoming Events
Track your HubSpot calendar events for the next 7 days.
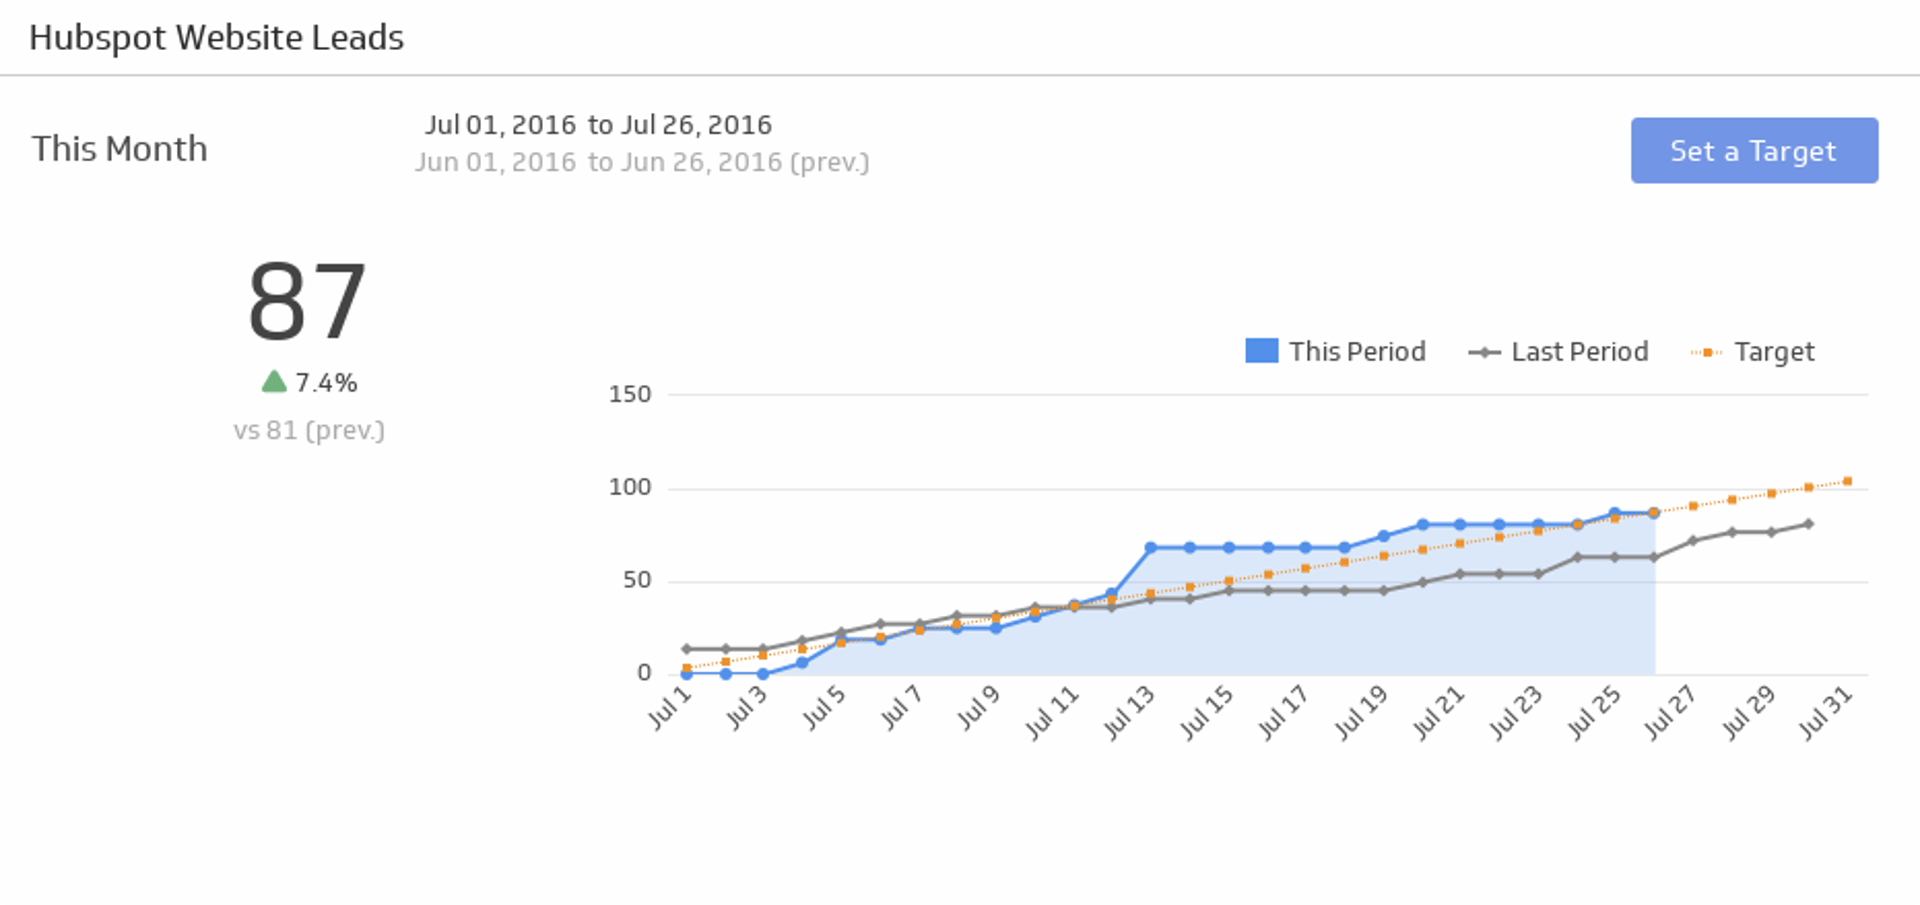
Website Leads
Make sure you are getting a steady stream of leads to your website.
.svg)
Use the Connector Gallery to create a custom HubSpot dashboard
With our Connector Gallery, you can create custom API queries to pull in data from your HubSpot account. Building custom queries allows you to specify the metrics and time periods that you want to track.
You can use custom queries to build out visualizations in Klipfolio. You can also combine your HubSpot data with other relevant data to create your custom dashboard.
Learn more about working with the HubSpot API and how you can start building your own HubSpot queries in Klipfolio.
