EBITDA Margin
EBITDA Margin shows what percentage of revenue a company keeps as operating earnings before interest, taxes, depreciation, and amortization.
Track all your Financial KPIs in one place
Sign up for free and start making decisions for your business with confidence.
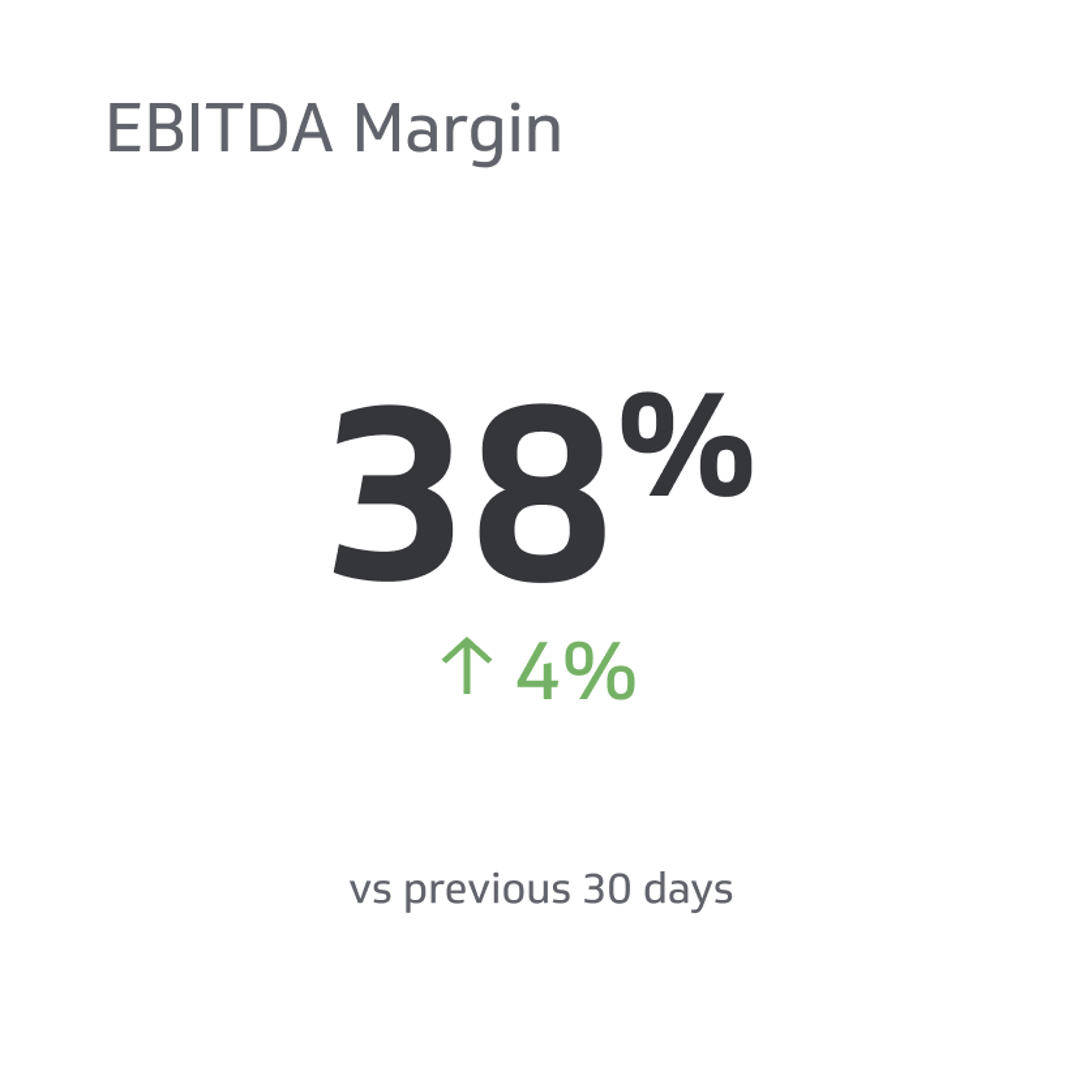
EBITDA Margin is the ratio of EBITDA to total revenue, showing how efficiently a company generates earnings from its core operations before interest, taxes, depreciation, and amortization.
Unlike net income, EBITDA Margin strips out financing decisions, tax strategies, and non-cash charges — giving you a cleaner read on operational performance. That makes it easier to compare companies across industries or sizes without those variables muddying the picture.
A few key facts to anchor the concept:
- EBITDA stands for earnings before interest, taxes, depreciation, and amortization
- EBITDA builds on net income by adding back interest, taxes, depreciation, and amortization
- It's not a GAAP metric, and the SEC prohibits reporting EBITDA per share for public companies
- It excludes capital expenditures, which can make a company look more profitable than it is
- It works best alongside other ratios — leverage, liquidity, and profitability metrics included
The origin of EBITDA Margin
John Malone, known as the "Cable Cowboy," developed EBITDA in the 1970s to support his leveraged growth strategy. He needed a metric that could show investors whether a company generated enough earnings to service acquisition debt — even when depreciation and financing costs made the bottom line look weak.
By the 1980s, EBITDA had spread widely across investment and lending circles. But it also attracted misuse. During the dot-com bubble, some companies leaned on EBITDA to inflate the appearance of financial performance and attract equity investors. In 2018, WeWork drew sharp criticism for reporting "Community Adjusted EBITDA," a version that excluded marketing costs and other real expenses.
Despite that history, EBITDA remains a critical metric across industries — particularly when you need a quick, comparable view of operating efficiency. Explore financial metrics & KPIs for visual examples of how these measures are tracked in practice.
How EBITDA Margin works
EBITDA Margin expresses EBITDA as a percentage of revenue. By removing non-operating expenses — interest, taxes, depreciation, and amortization — the metric shows how much cash a company's core operations generate per dollar of revenue.
The underlying assumption is that companies can influence factors like depreciation schedules, tax strategies, and capital costs. Stripping those out lets you focus on what the business actually controls day-to-day: its operating efficiency.
For decision-makers, EBITDA Margin answers a practical question: is this business running efficiently, independent of how it's financed or structured? A rising margin signals tighter cost control. A declining margin over time can indicate operational pressure, increased competition, or eroding pricing power — all worth investigating before drawing conclusions.
It also levels the playing field between companies with different financing structures or tax positions. Two businesses can show similar revenues and net profits, but a significantly higher EBITDA Margin in one suggests better control over operating costs — a real competitive advantage.
That said, EBITDA Margin works best as one input among several. Because it excludes interest, taxes, and capital expenditures, it doesn't capture the full financial picture — especially for businesses carrying significant debt or investing heavily in infrastructure.
Where to find EBITDA data
Not every company reports EBITDA explicitly. When it isn't listed, you can calculate it from the financial statements:
- Find net income on the income statement
- Add back interest and taxes — both appear on the income statement
- Add depreciation and amortization — these appear in the notes to operating profit or on the cash flow statement
- Divide by total revenue to get the margin
Once you have the EBITDA figure, the margin calculation is straightforward.
EBITDA Margin formula and calculation
Start by calculating EBIT (earnings before interest and taxes), then add back depreciation and amortization:
EBITDA = EBIT + Depreciation + Amortization
To get the margin, divide by net revenue:
EBITDA Margin = EBITDA / Net Revenue
Example calculation
Suppose your company reports:
- A net profit of $2,000,000 (before interest and taxes)
- Net sales of $10,000,000
- Depreciation and amortization of $150,000
EBITDA = $2,000,000 + $150,000 = $2,150,000
EBITDA Margin = $2,150,000 / $10,000,000 = 21.5%
That means 21.5% of revenue flows through from core operations. The remaining 78.5% covers operating expenses, capital expenditures, taxes, and financing costs.
Interpreting EBITDA Margin
A high EBITDA Margin signals that a company keeps operating costs low relative to revenue — an indicator of financial stability and operational discipline that tends to attract investors.
Consider a second example: a company with EBITDA of $1,200,000 and total revenue of $4,500,000.
EBITDA Margin = $1,200,000 / $4,500,000 = 26.67%
A 26.67% margin indicates strong earnings generation from operations. But what counts as "high" varies by industry — capital-light businesses typically run higher margins than asset-intensive ones. Always compare within the same sector.
Which industries benefit most from EBITDA Margin
Most companies use EBITDA to assess operating profitability, but it's most useful in specific contexts.
Asset-intensive industries with high depreciation
Utilities, telecommunications, and manufacturing companies carry heavy non-cash depreciation charges that can obscure underlying profitability. EBITDA Margin removes that distortion, making it easier to compare operating efficiency across companies of different sizes in the same sector.
Early-stage technology and research companies
Young tech firms and research companies often amortize large intangible assets — intellectual property, patents, and capitalized R&D — over time. That amortization can make profitability appear worse than it is. EBITDA gives a more precise picture of the earning potential of their core operations, helping leaders focus on growth rather than accounting noise.
Cross-company operating comparisons
When comparing two companies with different financing structures or tax positions, EBITDA Margin isolates what they actually control: their operating costs relative to revenue. That makes it a useful starting point for investors and analysts assessing core financial performance.
Cost management and operational efficiency
A consistently high EBITDA Margin suggests effective cost control. Companies that maintain or grow their margin over time are generally managing resources well — a signal that tends to matter to both investors and acquirers.
How your business benefits from tracking EBITDA Margin
EBITDA Margin gives leadership a reliable read on core operating performance — separate from financing decisions, tax exposure, and capital investment. That's useful when benchmarking against competitors, evaluating acquisition targets, or identifying where cost pressure is building.
A high margin signals the potential for stable earnings and efficient operations. A declining margin is worth examining: it may point to rising input costs, pricing pressure, or operational inefficiencies that need attention before they compound.
Tracking EBITDA Margin on a dashboard alongside complementary metrics — like free cash flow, net income, and gross margin — gives you the context to act on what you're seeing, not just report it.
The disadvantages of EBITDA Margin
EBITDA Margin is widely used, but it comes with real drawbacks worth understanding before relying on it.
It can paint a misleading picture
By excluding non-operational expenses, EBITDA Margin can overstate how healthy a company is. It doesn't reflect the eventual cash impact of interest payments, taxes, or capital investment. Relying on it alone can obscure financial fragility hiding beneath a strong-looking number.
It can mask poor decisions
Companies with impressive EBITDA figures can still be in serious trouble. Vivendi, Cablevision, and Crown Castle all showed strong EBITDA in the early 2000s while carrying mounting debt and deteriorating cash positions. A high EBITDA Margin doesn't mean a company is well-managed — it means operating costs are low relative to revenue, full stop.
It ignores the cost of debt
Interest costs directly affect profitability. Stripping them out makes a heavily leveraged company look stronger than it is. Before any merger, acquisition, or investment decision, the cost of borrowing deserves its own line of analysis.
It ignores taxes
Tax obligations can run into the millions and, when accounted for, can turn apparent profitability into a loss. A company that looks efficient on an EBITDA basis may look very different after taxes are applied.
It assumes no capital expenditure
Every business needs to invest in maintaining and upgrading equipment, facilities, and infrastructure. EBITDA ignores those outlays entirely. For capital-intensive businesses, that omission can make the metric significantly misleading.
It's not a GAAP measure
EBITDA Margin has no standardized definition under generally accepted accounting principles. Companies can calculate it differently, making comparisons less reliable than they appear. Warren Buffett has consistently criticized EBITDA as an unreliable valuation tool — a view worth keeping in mind.
EBITDA Margin alternatives
When you need a fuller picture of financial health, these metrics complement or replace EBITDA Margin depending on the question you're trying to answer:
Operating income
Operating income (EBIT) measures earnings from core business operations after operating expenses but before interest and taxes. Calculate it by subtracting operating expenses from revenue. It's a GAAP measure, which makes it more comparable across companies.
Free cash flow
Free cash flow shows what a company actually has left after capital expenditures — the cash available to pay debt, return to shareholders, or reinvest. Calculate it by subtracting capital expenditures from operating cash flow. It's one of the clearest signals of financial sustainability.
Net income
Net income is the bottom line — total profit after all expenses, including interest, taxes, and depreciation. It's the most complete measure of profitability and the one EBITDA is often used to avoid.
Gross Profit Margin
Gross Profit Margin measures profit after the cost of goods sold, before operating expenses. It tells you how efficiently a company produces its product or delivers its service — useful for spotting pricing or production issues early.
Return on Investment
Return on Investment (ROI) measures how much profit an investment generates relative to its cost. It's useful for evaluating specific capital decisions rather than overall business performance.
Used together, these metrics give a more complete view of where a company stands — and where EBITDA Margin is telling only part of the story.
Tracking EBITDA Margin over time
A single EBITDA Margin figure is a snapshot. The real value comes from tracking it consistently — across quarters, against competitors, and alongside the metrics that fill in what EBITDA leaves out.
Klips makes it straightforward to pull financial data from your sources, calculate EBITDA Margin automatically, and display it alongside complementary KPIs in a single dashboard. When the number changes, you'll know immediately — and you'll have the context to understand why.
Related Metrics & KPIs