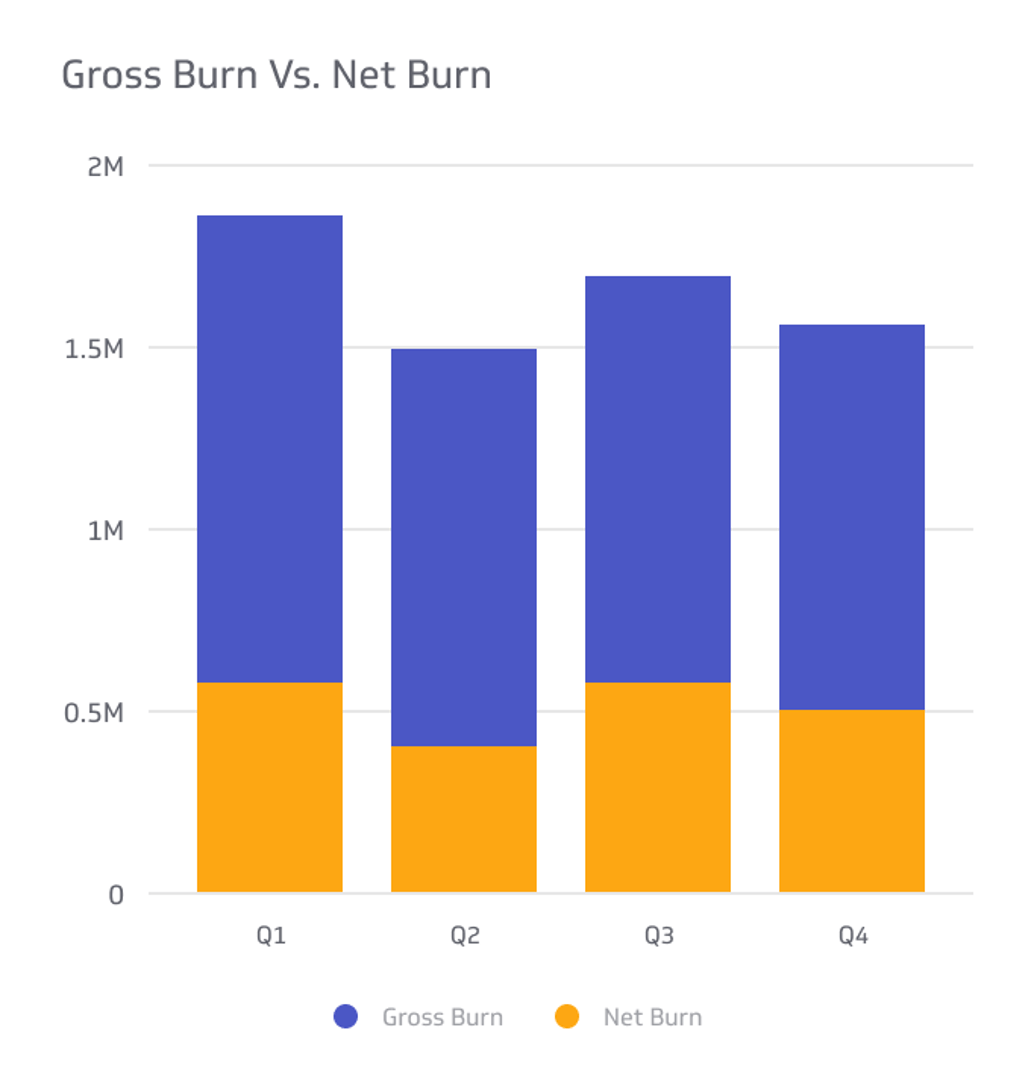
Gross Burn Vs. Net Burn
A company’s burn rate is the rate at which it spends money.
Track all your Financial KPIs in one place
Sign up for free and start making decisions for your business with confidence.
In the world of startups and business growth, understanding your burn rate is crucial to financial stability and long-term success. But do you know the difference between gross burn and net burn?
Our comprehensive guide will walk you through the ins and outs of these essential metrics, helping you optimize your financial strategy and keep your business thriving. So, buckle up, and let's dive into the world of burn rates, cash runway, and expert tips for managing your company's expenses.
What Is A Burn Rate?
As the name might imply, a company’s burn rate is the rate at which it spends money. This statistic is often used for startups, as they are much more susceptible to overspending than established businesses.
While you can use any time increment to measure burn rate, most organizations measure their spending by the month. This monthly rate can further be divided into gross and net burn rates.
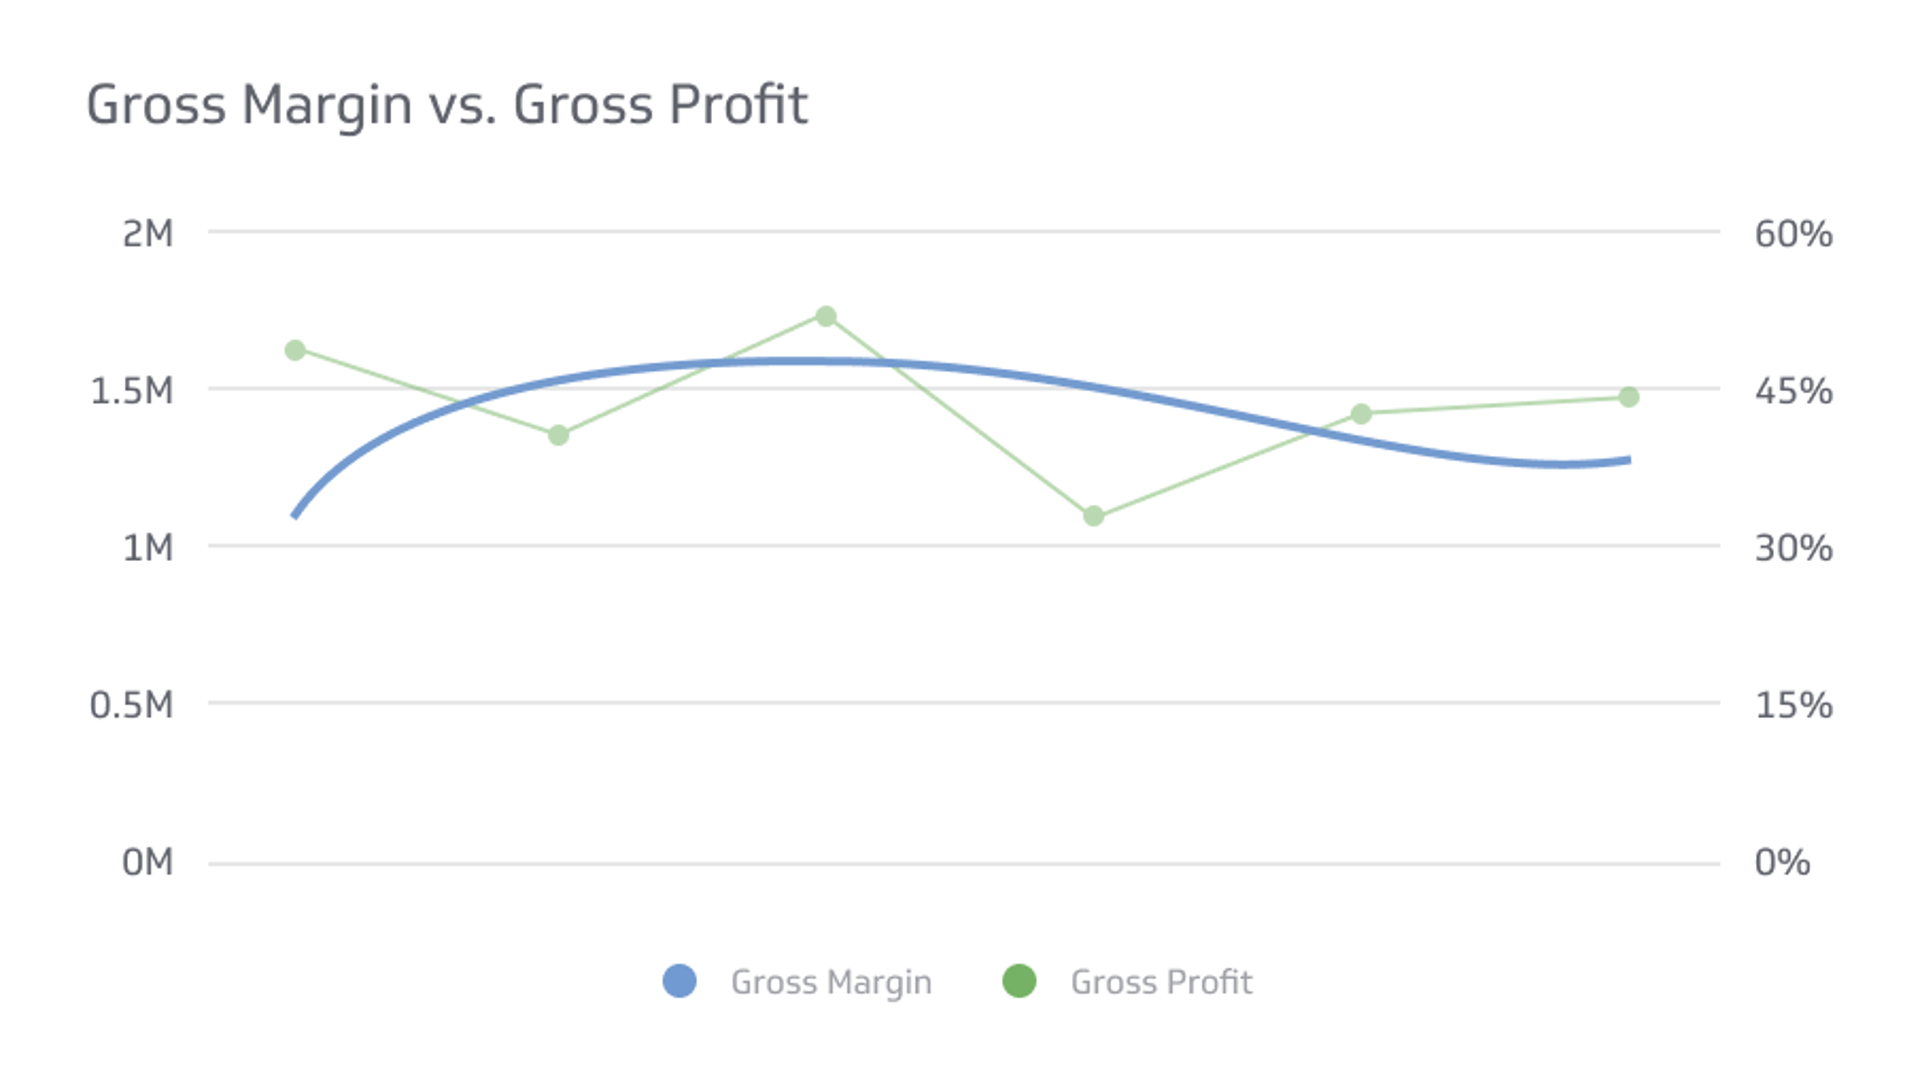
Your company’s gross burn rate is the total amount spent over that period, while the net burn rate only measures monthly cash losses.
Calculating Your Burn Rate
Now that you understand the purpose of a burn rate, we can dive right into calculating it. While similar in concept, the difference between gross burn vs. net burn is apparent in these formulas.
Gross Burn
Gross burn is relatively easy to calculate. Add up all your monthly operating costs, and you will be given a monthly gross burn rate.
Net Burn
Net burn is a little more complicated than its gross counterpart. Net burn takes the monthly gross burn and adjusts to account for any revenue.
To calculate net burn, you add up all your monthly revenue to see how much money you have made and subtract monthly operating costs (the gross burn rate).
Alternatively, you can calculate net burn by looking at your cash balance at the beginning and end of a month. Subtract your end-of-month balance from the beginning of the month, leaving you with your net burn rate.
Startups And Net Burn
Like all companies, startup companies use net burn to measure their month-to-month operating efficiency.
If your company is consistently hemorrhaging money, you may need to reconsider the way you are spending your cash supply. Conversely, if you have a negative net burn rate and can make money every month, your business is likely in a good place.
While large amounts of net burn can be alarming, it does not immediately indicate a problem. Many startups prioritize growth and capturing new market share, especially in their earliest stages. This can often involve some short-term net burn.
It is essential to find the right balance between growth and net burn. Suppose the venture funding market is good, and investors are prioritizing development. In that case, net burn is not seen as a huge priority. But suppose the market is in a downturn. In that case, the emphasis on growth will shift to include more opportunity costs and account for more losses.
Ultimately, net burn is used as a statistic to measure your runway and compare your company to other similar ones. If similar startup companies show significantly lower net burn each month, it may indicate poor efficiency.
Cash Runway
A cash runway is a term used for startup companies. The runway is the time you have, usually measured in months, before your company runs out of money.
To figure out your cash runway, divide your total starting cash by your average monthly net burn to determine the number of months your startup can survive at the rate of your losses.
If the remaining portion of your runway is low, your startup will either need to seek out new investors or begin turning enough profit to keep things afloat.
Historically speaking, startup companies have a life cycle of about 12-18 months before they need to secure new cash. This means that ideally, your monthly net burn rate should be between a twelfth and an eighteenth of your total initial funding.
Pros of Using Net Burn
Many startup companies find that using net burn is helpful in creating a timeline. The calculation is easy to make, and it provides a valuable financial metric to measure the efficiency of your monthly costs.
Another advantage of using such an easy-to-understand concept is that it is easy to explain to investors. This gross metric tells investors exactly how much profit you need to make in order to break even, and the closer you get to that metric, the better off your company looks.
By setting benchmarks for your net burn, you can adequately keep track of your company’s lifespan in relation to its cash runway. After all, if you don’t have any revenue, your company is only able to operate off of your investor’s money.
Cons of Using Net Burn
While the simplicity of net burn makes it an easy concept to understand, it also leads to its most significant limitations. Net burn only provides a straightforward number rather than a thorough explanation for that number.
A high net burn is not immediately indicative of poor efficiency. A company may see a higher burn rate when it sees a lot of growth and needs to back itself to operate for a bigger audience.
When your net burn is high for a month, it can be difficult to justify it to investors with such little information. A more in-depth look at a company’s cash flow may better explain why the number fluctuates.
How To Manage Burn Rate
As stated earlier, most startup companies need a new investment avenue every 1-1.5 years. On top of that, studies have shown that most startup businesses don’t make any profit for three or more years.
As such, managing your burn rate throughout these early stages can be essential to keeping your business afloat during its infancy.
Growth Objectives
While it is impossible to grow without spending some of your capital, outlining which objectives you’d like to expand on and leaning into them can help to reduce needless spending.
Talk to potential customers and determine milestones you’d like to reach by specific points in time. Focus your limited resources on expanding these values rather than trying to grow all avenues simultaneously.
Lowering Fixed Expenses
Keeping expenses variable rather than introducing high fixed costs can help to keep your business maneuverable. If you have high fixed costs, you can be locked into spending more than you might need monthly.
Utilize renting and other variable expenses so that if your runway is almost out, you are not stuck covering fixed expenses you can’t afford.
Categorizing Costs
While knowing your total cash burn is helpful, knowing where your cash is going and why is even more practical. Sort out your expenses into categories and track how much goes into each.
This way, you can examine your spending habits more thoroughly to make educated adjustments. Categorizing your costs will help you to understand where your time is best spent. If you find you are putting a lot of extra cash into marketing but aren’t seeing proportional results, you may consider a smaller marketing budget.
Prioritizing Customers
While attracting new customers is a great way to enact growth, don’t forget about the customers you already have. Retaining an existing customer is more profitable than attracting a new one, as it takes more resources for each new customer.
Keeping track of statistics such as retention rate and recurring revenue will help to see where your money is coming from and if you can keep the new customers you attract.
Concluding Thoughts
In the end, comparing gross burn vs. net burn is valuable when looking at your monthly finances. While your monthly burn rate may not be the end all be all of your company’s future, it can be a great frame of reference for measuring the value of losses during growth.
Related Metrics & KPIs