Net Revenue Retention
NRR is a percentage indicating how much revenue you’re getting from customers at the start of a specific period after accounting for any of your expansion revenue.
Track all your Financial KPIs in one place
Sign up for free and start making decisions for your business with confidence.

Are you a business owner with trouble measuring growth and finding improvement areas? You are not alone, as many businesses worldwide have been through the same problem. Failing to handle these issues can cause decision-making difficulties, leading to poor performance. Luckily, NRR has got you covered with a simple yet powerful metric.
So, what is this indicator, and why does it matter? Here’s everything you need to know about NRR.
What Is NRR?
NRR is a percentage indicating how much revenue you’re getting from customers at the start of a specific period after accounting for any of your expansion revenue.
This financial metric is more accurate than annual recurring revenue (ARR) and monthly recurring revenue (MRR) because it also accounts for revenue fluctuations like upselling or customers downgrading to other plans.
The formula for calculating NRR is your starting monthly recurring revenue plus any expansion revenue (such as from price increases), minus any churn (cancellations, downgrades, etc.), all divided by your starting monthly recurring revenue again.
Let’s see this formula in practice.
Generic SaaS Corporation has a starting MRR of $2 million. In the last period, it added $200,000 in expansion but lost $75,000 to churn. Adding these numbers together, we get $2,125,000. Dividing that by our starting MRR, we get an NRR of 106.25%. Since it’s over 100%, we can see that the company is growing and improving.
Why Use NRR?
NRR is valuable for SaaS firms because it focuses on predictable revenue from ongoing sources, as opposed to new customers or one-time sales. Income from new customers can fluctuate wildly, but a company with a steady NRR over time is much more attractive to investors.
Companies with a high NRR tend to have high customer satisfaction and a good value proposition.
NRR is also more reliable than counting recurring subscriber numbers because it focuses on the revenue, not the number of people.
If you have fifty thousand customers and they all downgrade to a lower plan, your subscriber numbers are the same even though you have much less income now. Saying that the company is in a good spot because subscriber numbers are the same would be inaccurate because it’s not accounting for their real-world behavior.
Applying NRR to SaaS
NRR is a good key performance indicator for SaaS companies because it focuses on improving customer value and higher-value upsells.
Companies with poor customer service and low value for customers will see a lot of churn over time, which significantly diminishes NRR. If you set keeping this number high as a goal, that translates to establishing and maintaining trust with existing customers.
Similarly, using NRR focuses on quality upsells rather than trying to sell anything to anyone. If you try to sell customers something they don’t want or need, they may drop your company instead. If you provide real value, you can expect customers to stick around.
As if all of that wasn’t enough reason, new customers are usually the hardest sell. Focusing on a higher NRR means your company values its existing customers and doesn’t forget about them in pursuit of unrealistic growth in subscriber numbers.
What Is A Good NRR?
As a rule of thumb, any company with an NRR equal to or greater than 100% is in a good place. Performance in this range indicates that a company is growing and can expect more revenue.
An NRR of less than 100% indicates contraction and that the company is on a less-stable footing. Note that contraction, in this sense, does not necessarily mean loss. NRR is about recurring revenue, so a company may be profitable thanks to an influx of new customers who haven’t become recurring yet.
Successful SaaS companies can significantly exceed 100%, especially during major growth phases. At the same time, contraction here can indicate that it’s time for a business to change course and look for more ways to retain customers.
The sweet spot for many companies is around 125%. This suggests low concern and frequent purchases of additional products or services. An NRR that’s much higher than this will probably drop soon because it’s not sustainable.
Smaller SaaS companies should try to stay above 90%. Remember, being below 100% doesn’t necessarily mean the company is taking a loss, only that it has higher churn. Churn is more common with small businesses and tends to flatten out as a company grows, and its software becomes more mature.
As with all KPIs, having some context when looking at numbers is important. If you push for unrealistic results, that just hurts your company in the long run.
How To Improve NRR
There are many ways to improve your company’s NRR, but which makes sense depends on the customers you work with.
Income Demographics
As a rule of thumb, enterprise-level companies can spend far more than small businesses, individual company owners, or regular consumers. There’s a reason that so many SaaS companies have a custom price tier for larger customers.
Improving NRR when working with lower-income clients requires an emphasis on customer satisfaction to keep them around. Once invested in your company, most people are unlikely to change without a compelling reason.
Higher-income clients like large corporations tend to be more amenable to upselling, especially if you can convince them of your software’s value at that level.
Customer Satisfaction
Customers don’t always understand the value of your products or services at different levels. In some cases, changing your messaging can help them understand your value propositions and convince them to upgrade.
You can also look at information and records on your end to determine which candidates are a good choice for upselling. As a general guideline, customers who use your software almost constantly are more likely to be interested in upselling than someone who only uses it sporadically.
For sufficiently valuable clients, you can also look at this as an opportunity to provide personalized training or encourage further use of your software. If they’re not using it because they don’t understand it, helping them work it into their daily operations can give you a chance to upsell them later.
Company Expansion
One of the most effective ways of improving NRR is by expanding a company into new areas. The premise here is simple: You can’t upsell a product you don’t have.
To put it another way, the goal here is to identify another product or service that customers would find valuable. Depending on its nature, you can place this service in a higher price tier or offer it as a separate product.
Expanding the business can take time, but it also offers many opportunities to increase your NRR by attracting customers through multiple channels.
Churn Potential
Churn potential is the sum of factors that may cause a recurring customer to drop you. This can be anything from going out of business to finding a competitor offering similar services at a lower price.
Having teams looking for signs of potential churn allows you to intervene and prevent it. Remember, most customers are reluctant to churn as long as they’re satisfied with your services.
If you don’t have ways to measure customer accounts or detect the warning signs of churn, you may need to program and implement those as part of your software updates.
Free Trials
Most companies focus on offering free trials to new (or potentially new) customers. Give them a taste of the product, and once they like it, ask them to start paying.
However, offering free trials of higher-tier services to existing customers can be a great way to demonstrate potential value and allow you to upsell. This can be a great, low-pressure way to interest your clients.
The best way to use free trials is to look for customers who would see a lot of value from a specific service at a higher tier, then give them access to that service for long enough to see a real difference.
If you want to go further, you can ask companies if they’re interested in a free trial of upcoming products. Doing this requires careful analysis of their company culture and whether they will be interested.
It’s also a great way to get feedback without jeopardizing your reputation. If you’re clear that the software is currently in testing and you want to get feedback to improve the final release version, most companies will be far more lenient with whatever happens.
It’s All About Value
The fundamental point about improving NRR is that it’s all about a customer’s perception of value. People are far more likely to buy a product or service if they think they’re getting a good deal - that whatever they’re paying is worth less than what they’re getting back out.
NRR and Company Valuation
A high NRR can lead to a company getting a much higher valuation from investors, especially if the NRR stays consistently above 100%.
Realistically, even well-run businesses see ups and downs here, especially if there are some seasonal aspects to the software. An NRR above 100% is like getting compound interest from customers. The higher the rate and the longer it lasts, the better off you will be.
Frequently Asked Questions
Here are some common questions people have about NRR.
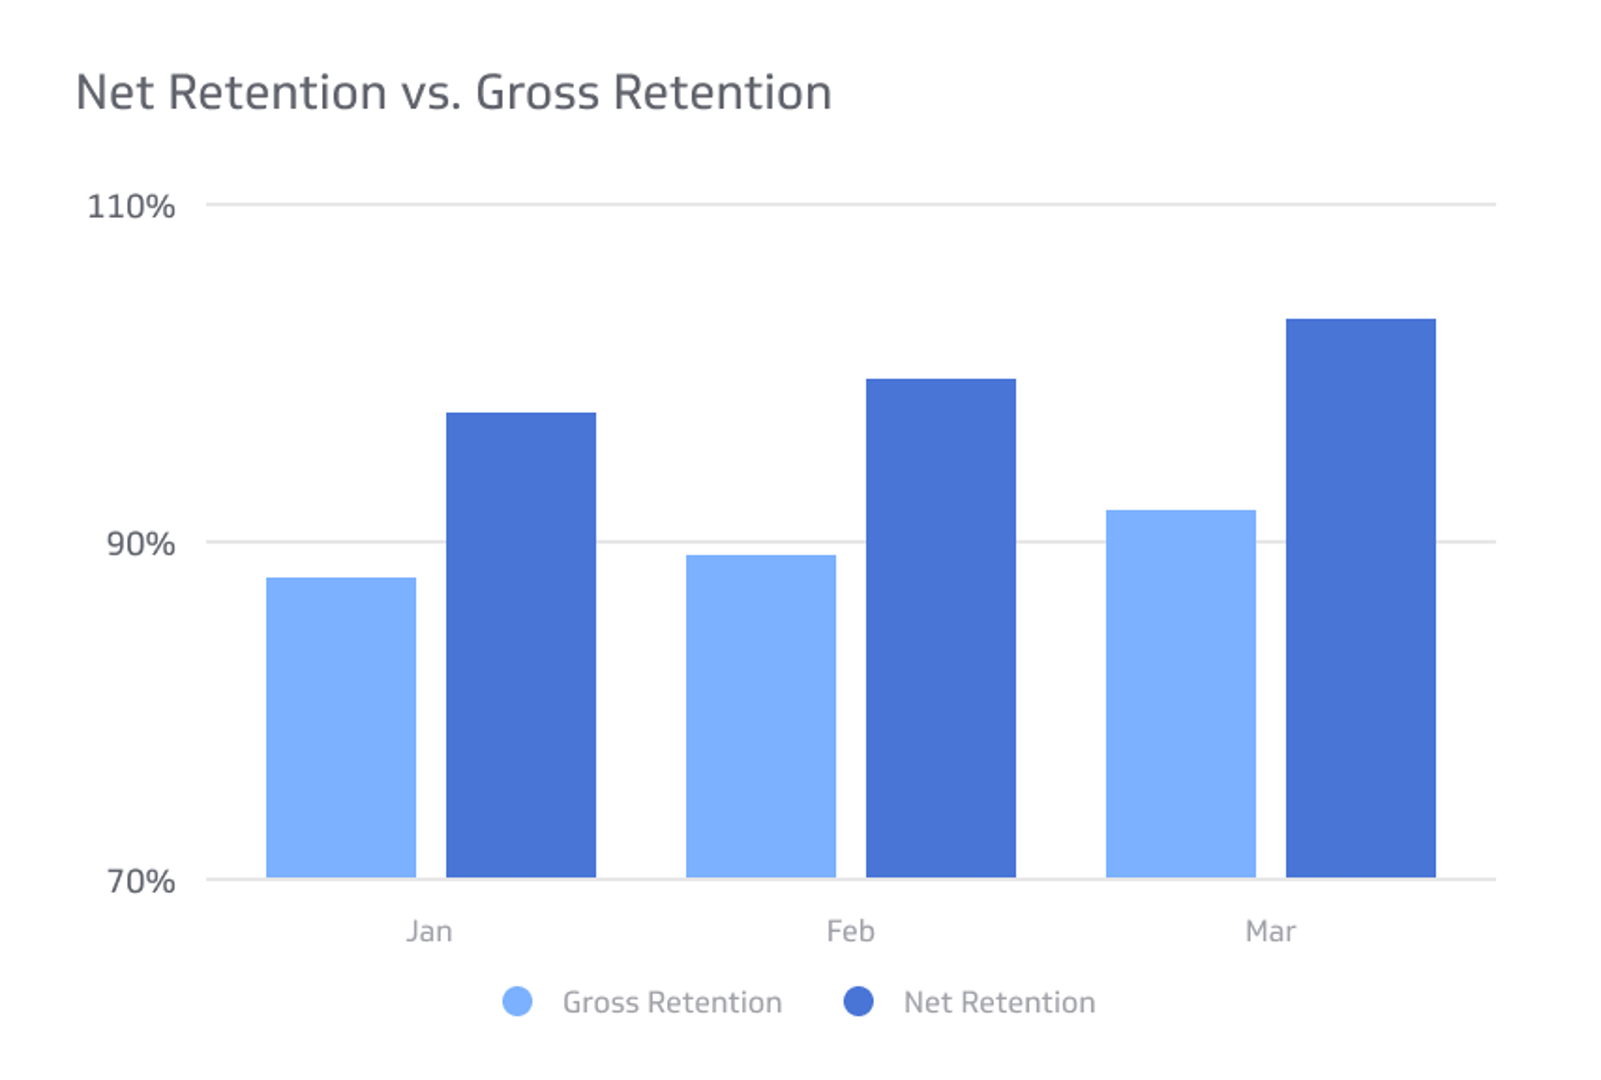
What is gross retention?
Gross retention is the amount of revenue you’re gaining from ongoing sources without considering the addition of upselling. It does maintain losses from churn, though. Measuring gross retention is good for examining your revenue levels without applying potentially unreliable upselling, but not as popular as NRR for company valuation.
Why is net revenue retention important?
Net revenue retention is a reliable metric for evaluating your company’s ability to keep and upsell customers. A company that cannot keep customers around for recurring revenue is far less stable than one with a reliable customer base.
Final Thoughts
NRR is a key performance indicator for SaaS companies because it offers a useful metric for evaluating their likely profits over time. Emphasizing this KPI can help ensure that a business focuses on long-term customer satisfaction rather than short-term profits.
Related Metrics & KPIs