Instagram Dashboard
Track reach, engagement, and growth in one clear Instagram dashboard.
What is an Instagram dashboard?
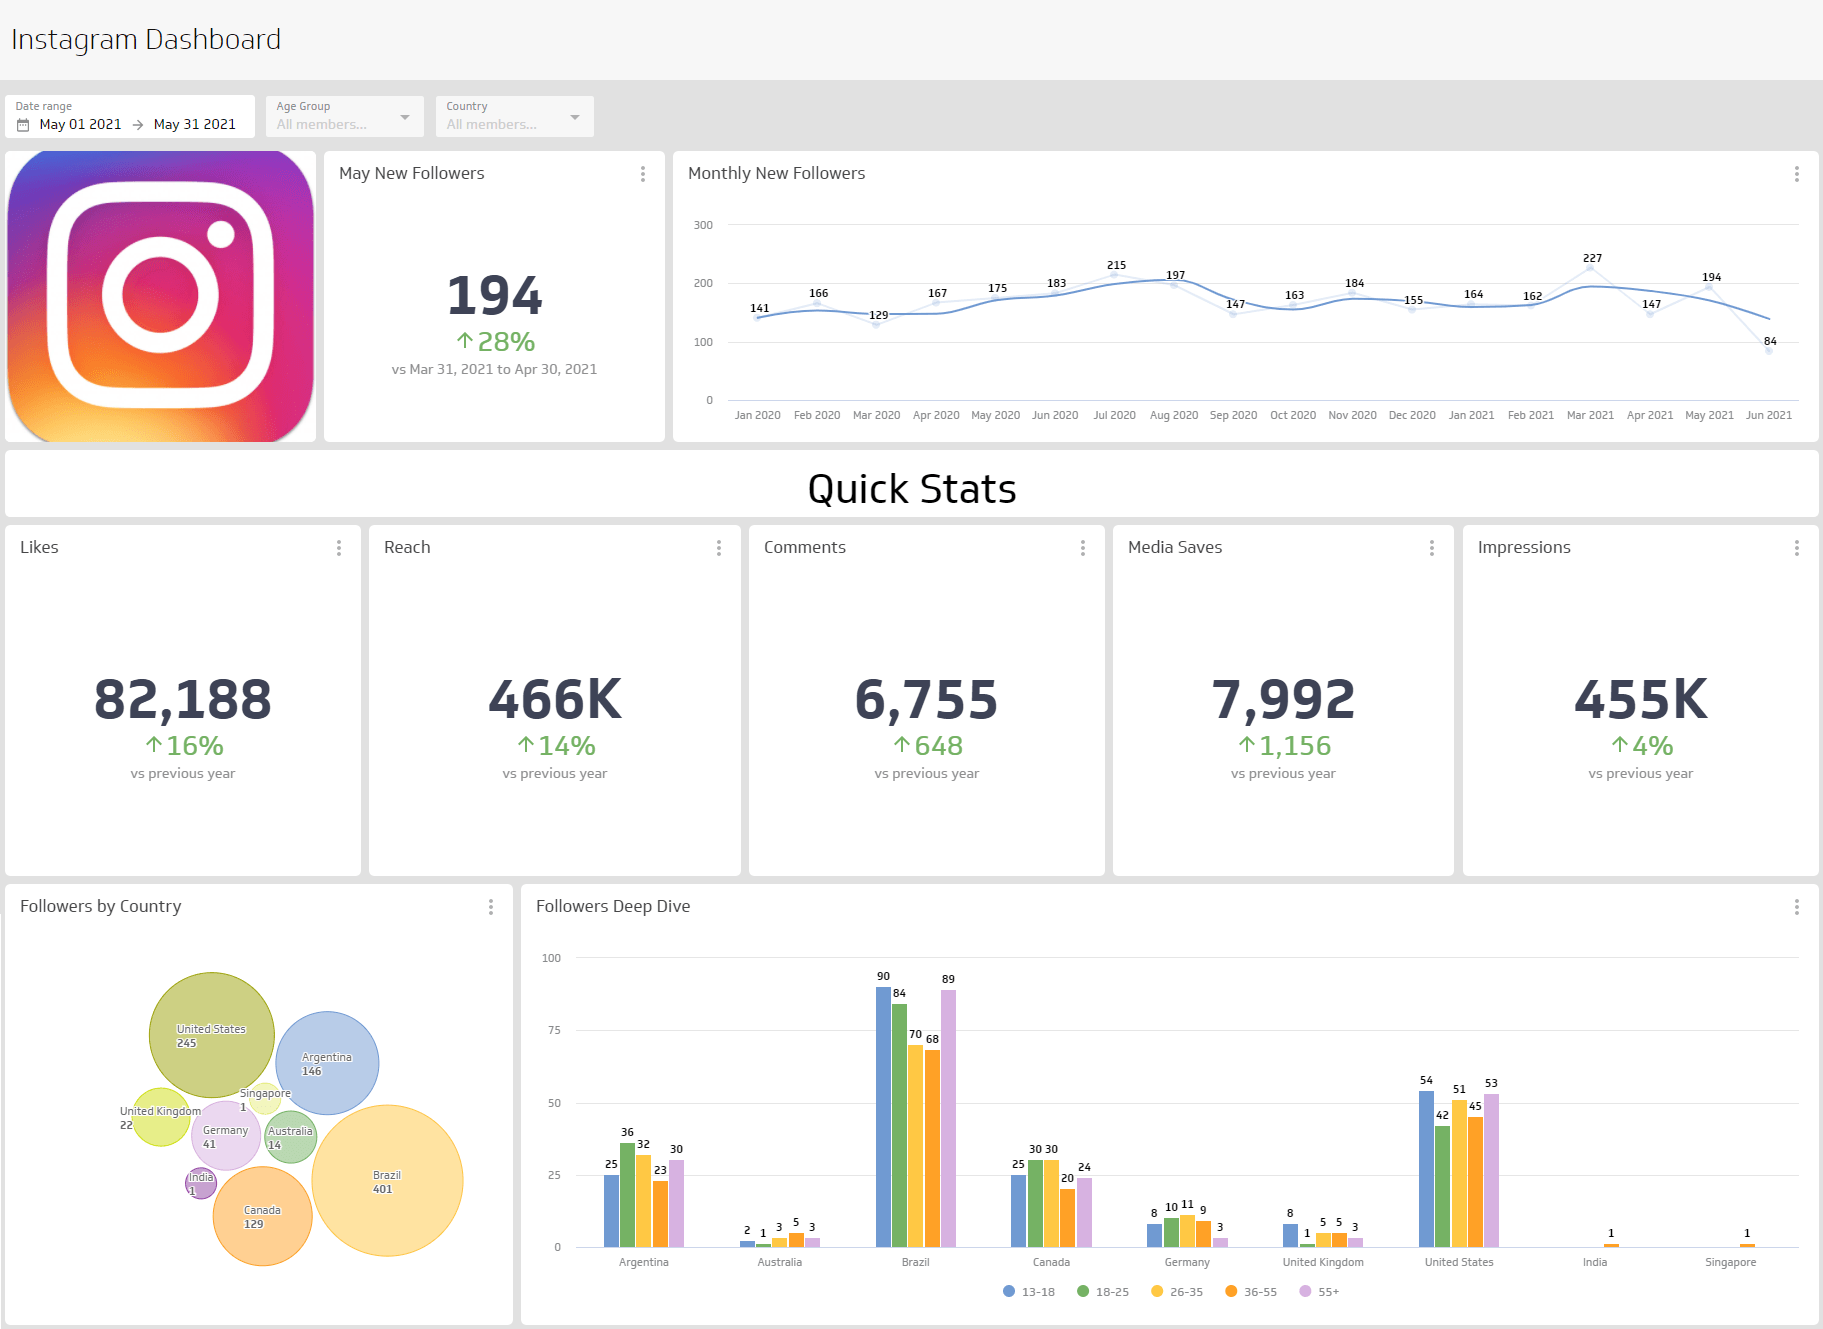
An Instagram dashboard is a visual report that brings your key Instagram metrics into one place so you can spot trends and act faster.
Use it to answer questions like:
- How many unique accounts viewed your content this week or month?
- How fast is your follower count growing?
- Which format — carousels, single images, or video — gets more engagement?
With a dashboard, you can segment data and see how your audience interacts with each content type and timeframe, without waiting for someone to pull the numbers.
What metrics should be on an Instagram dashboard?
The metrics below give you a reliable read on account health, content performance, and audience growth. Together, they answer the questions that matter most to anyone accountable for Instagram results.
Followers
Followers is the number of users who chose to follow your account. Track this over time — not just the total — so you can see whether growth is accelerating, plateauing, or declining. A sudden drop often signals a content or posting frequency issue worth investigating.
Media Reach
Media Reach measures how many unique accounts were exposed to your content in a given period. Reach tells you how far your content is actually travelling, separate from how often it was seen. A post can have high impressions but low reach if the same people are seeing it repeatedly.
Profile Views
Profile Views counts total views of your profile from unique accounts over a period of time. A spike in Profile Views after a post often signals strong interest — someone saw your content and wanted to know more. It's a useful leading indicator of follower growth.
Media Likes
Media Likes is the total count of likes across your posts. Likes are a quick signal of content resonance. Consistent like counts help you benchmark which content types your audience responds to most.
Account Impressions
Account Impressions counts the total number of times posts or ads from your account were viewed, including multiple views by the same account. Compare Account Impressions to reach to understand how often your content is being seen more than once — a higher ratio can indicate strong content recall or algorithm amplification.
Media Comments
Media Comments is the total count of comments on your content. Comments are a higher-effort form of engagement than likes or saves, which makes them a stronger signal of genuine audience interest. Tracking comment volume alongside sentiment helps you understand not just how many people responded, but how they felt.
Create custom dashboards for you and your team.
Get started with KlipsAdditional metrics worth tracking
Beyond the core six, these metrics round out a complete picture of Instagram performance:
- Saves: A strong signal of content value — users save posts they plan to return to. High save rates often indicate educational or reference-style content is landing well.
- Video views: Tracks how often video content is watched, useful for comparing format performance against static images or carousels.
- Story Reach: Measures how many unique accounts viewed your Stories in a given period. Stories tend to reach existing followers, making this a reliable gauge of how engaged your core audience actually is.
What chart types work best on an Instagram dashboard?
Start with the goal. Are you building a social media dashboard for quick monitoring, or do you need deeper segmentation? Your chart choices should match the decisions you plan to make.
Instagram segments metrics like comments, engagement, likes, reach, and saves by type. In Klips, you can segment by time and by media type (carousel, single image, or video) when your data source includes that breakdown.
To compare progression over time
Use a line or bar chart for time-based metrics such as Account Impressions, Media Reach, or Followers. View day over day, week over week, or month over month to spot patterns early. Line charts work well for continuous trends; bar charts make it easier to compare discrete periods side by side.
To show a single value
Use a summary chart for totals like Media Likes or Saves. It gives you a fast, confident read at a glance — no digging required. Summary charts are especially useful at the top of a dashboard where you want stakeholders to absorb key numbers quickly.
To see parts of a whole
Compare media types with a pie or stacked bar chart. For example, break out engagement by carousel, image, and video to see which format is actually driving results. If carousels consistently outperform single images, that's a signal worth acting on when planning your content calendar.
Why use an Instagram dashboard?
Pasting numbers into a spreadsheet or explaining your account performance to a generic AI tool from scratch every time costs you time and introduces errors. A dedicated Instagram dashboard keeps the numbers consistent, current, and ready to act on — without anyone having to go looking.
You can adjust date ranges, choose the right visualization for each metric, and share the view with your team by link, TV mode, PDF export, or scheduled email. Everyone sees the same numbers, which means fewer back-and-forth messages and faster decisions.
That reliability matters most when you're accountable for results. When you trust the numbers, you spend less time second-guessing and more time deciding what to do next.
How Klips connects to Instagram data
Klips connects to Instagram through its API, pulling metrics directly into your dashboard on a scheduled refresh. You choose the refresh rate — from one minute to 24 hours — so your team always has current data without manual exports or copy-pasting.
Once connected, you can combine Instagram data with other sources, such as Google Analytics or your CRM, to see how social performance ties to broader marketing outcomes. For example, pairing Media Reach data with website traffic lets you measure whether content exposure is actually driving visits.
Dashboard inspiration for Instagram
Getting started can be the hard part. Organize metrics so they make sense to you and anyone else who needs to reference the page.
Track overall account performance
Growth, engagement metrics, and reach: put your most important Instagram metrics in one place on an account overview dashboard. This view helps you answer:
- How many accounts is your content reaching?
- Does one media type perform better than another?
- How many Followers do you have, and is that number growing?
- How are people engaging with content (likes, comments, saves)?

Create custom dashboards for you and your team.
Get started with KlipsBuild a dashboard your team can trust
A strong Instagram Dashboard gives you and your team a clear, consistent read on performance. It replaces scattered checks and pasted numbers with a steady rhythm — one source of truth everyone can rely on without being asked to pull a report.
When everyone sees the same data, you spend less time figuring out what happened and more time planning what to do next. Build the view once, share it your way, and let the numbers surface what matters.
More dashboard examples
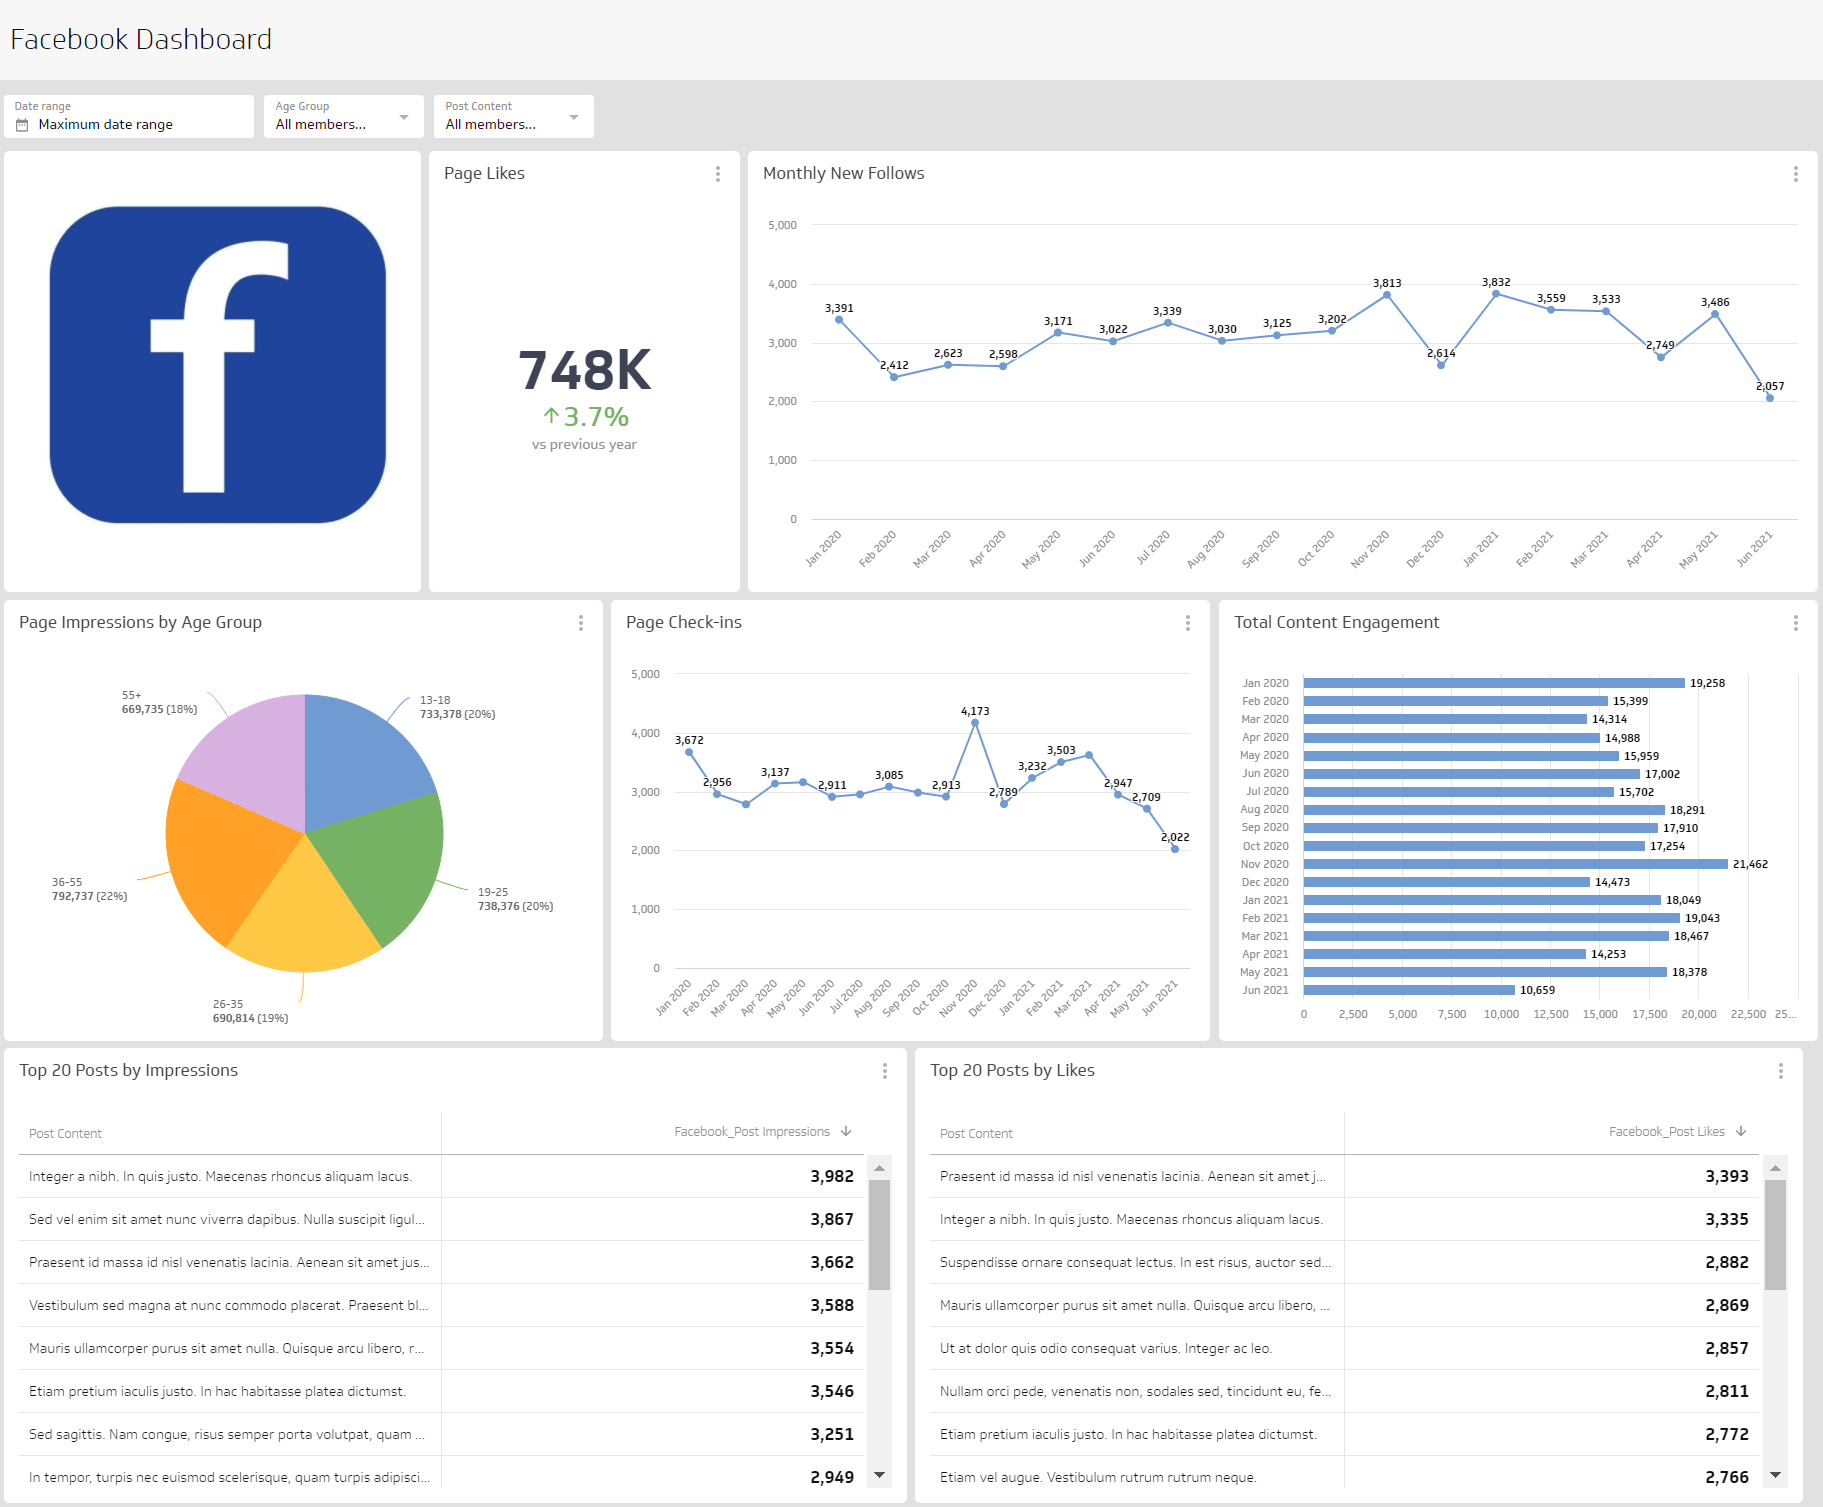
Facebook Analytics Dashboard
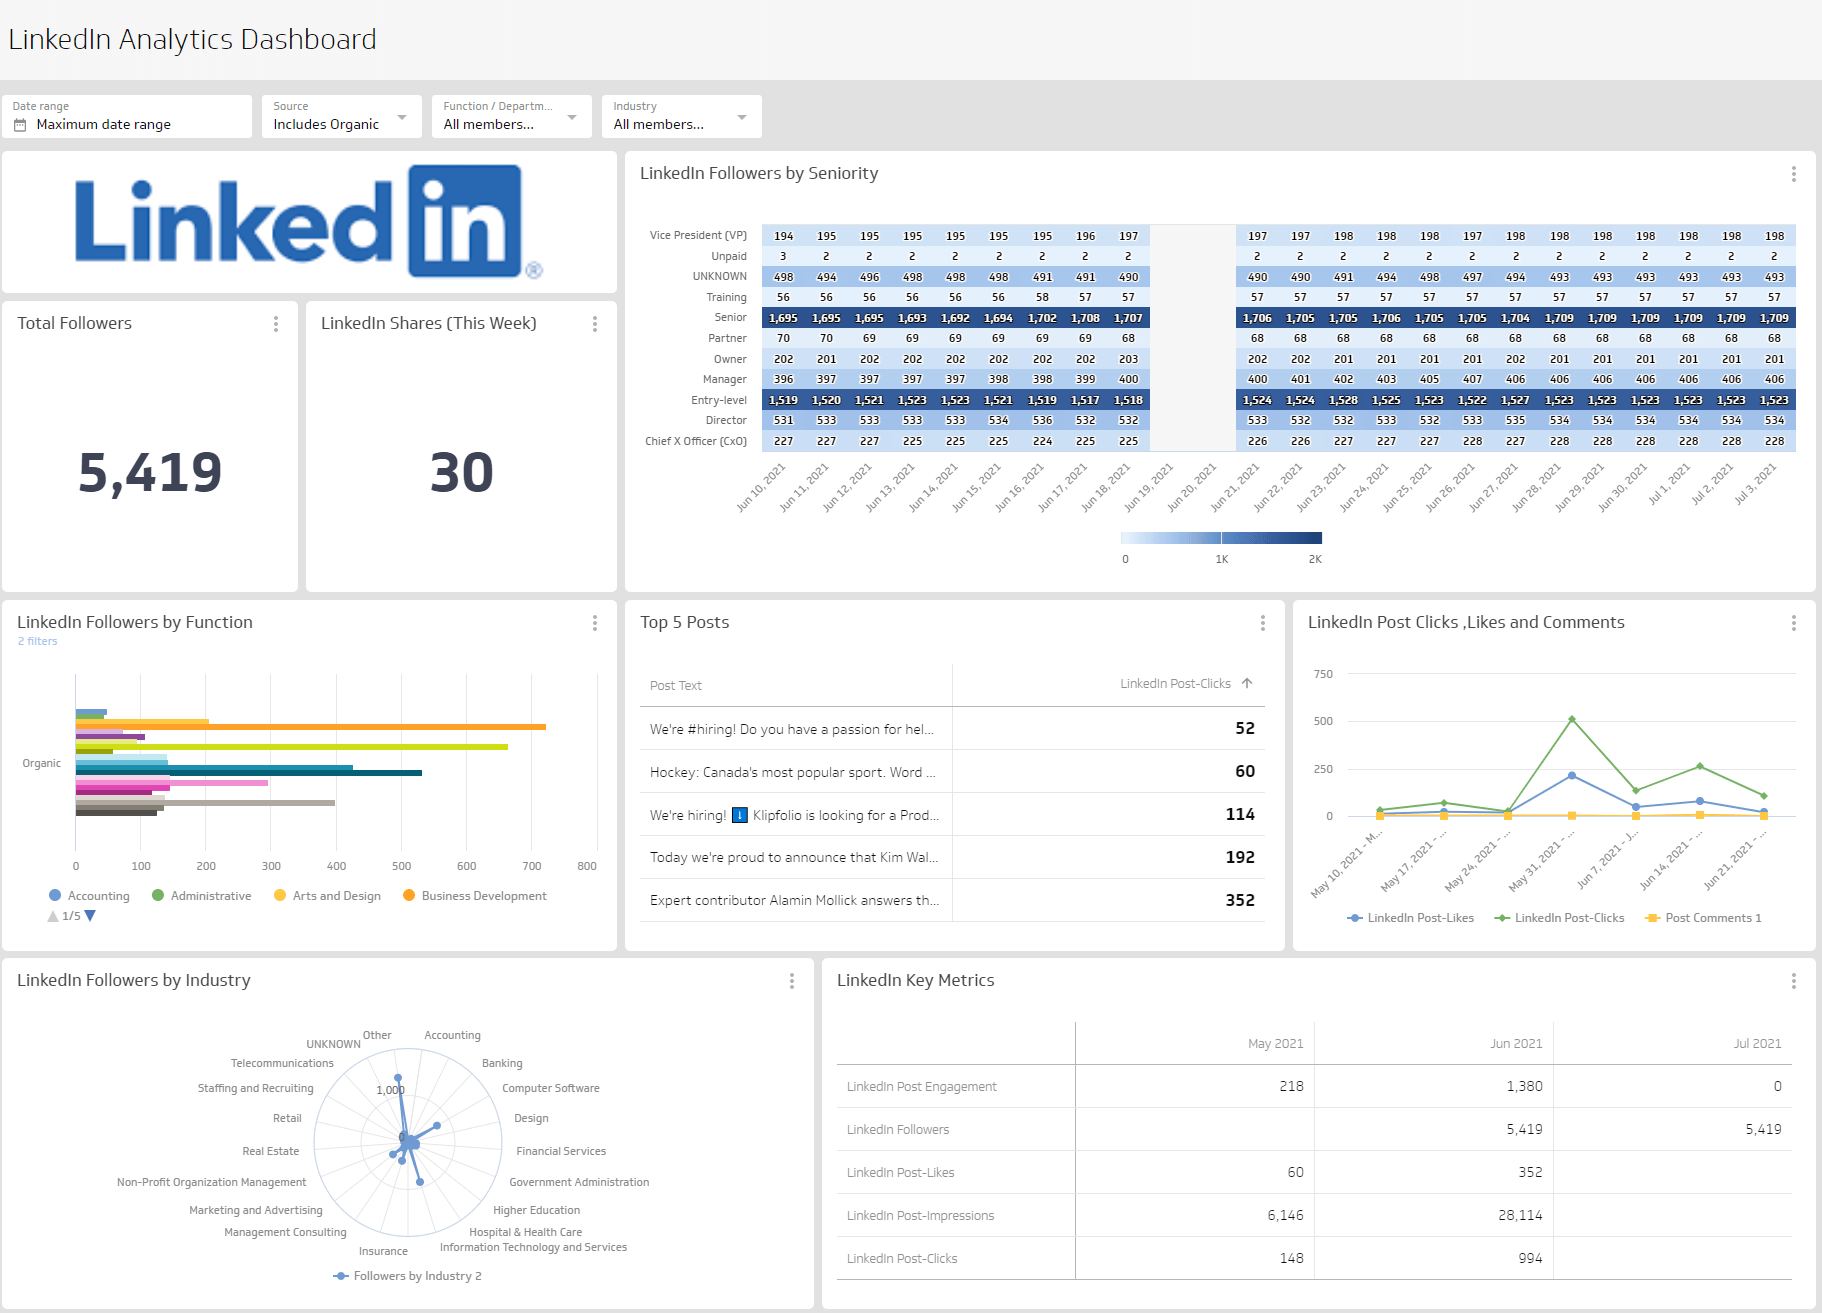
LinkedIn Analytics Dashboard
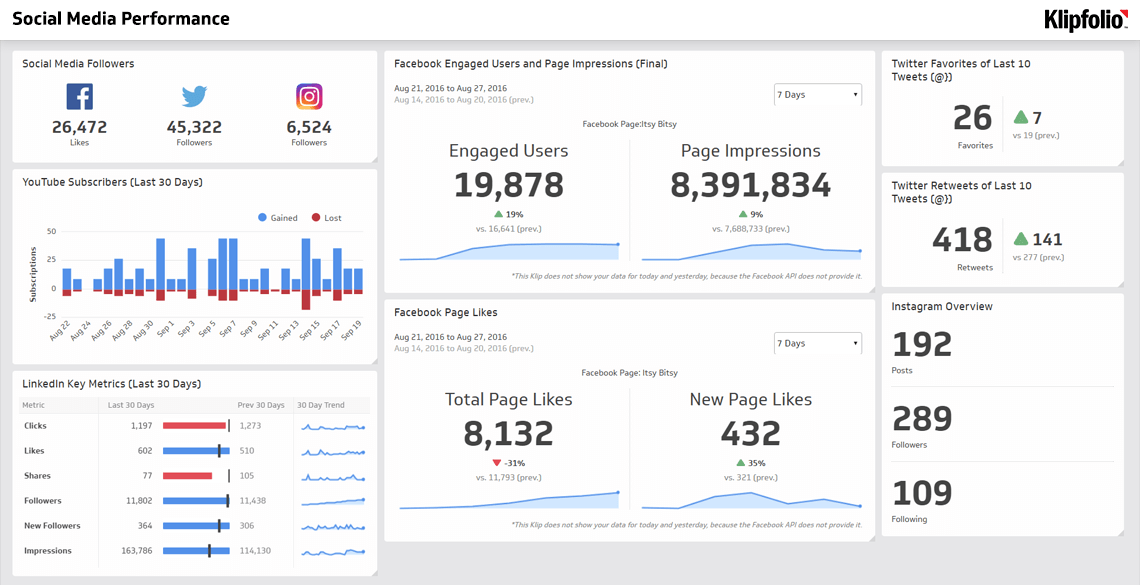
Social Media Performance Dashboard
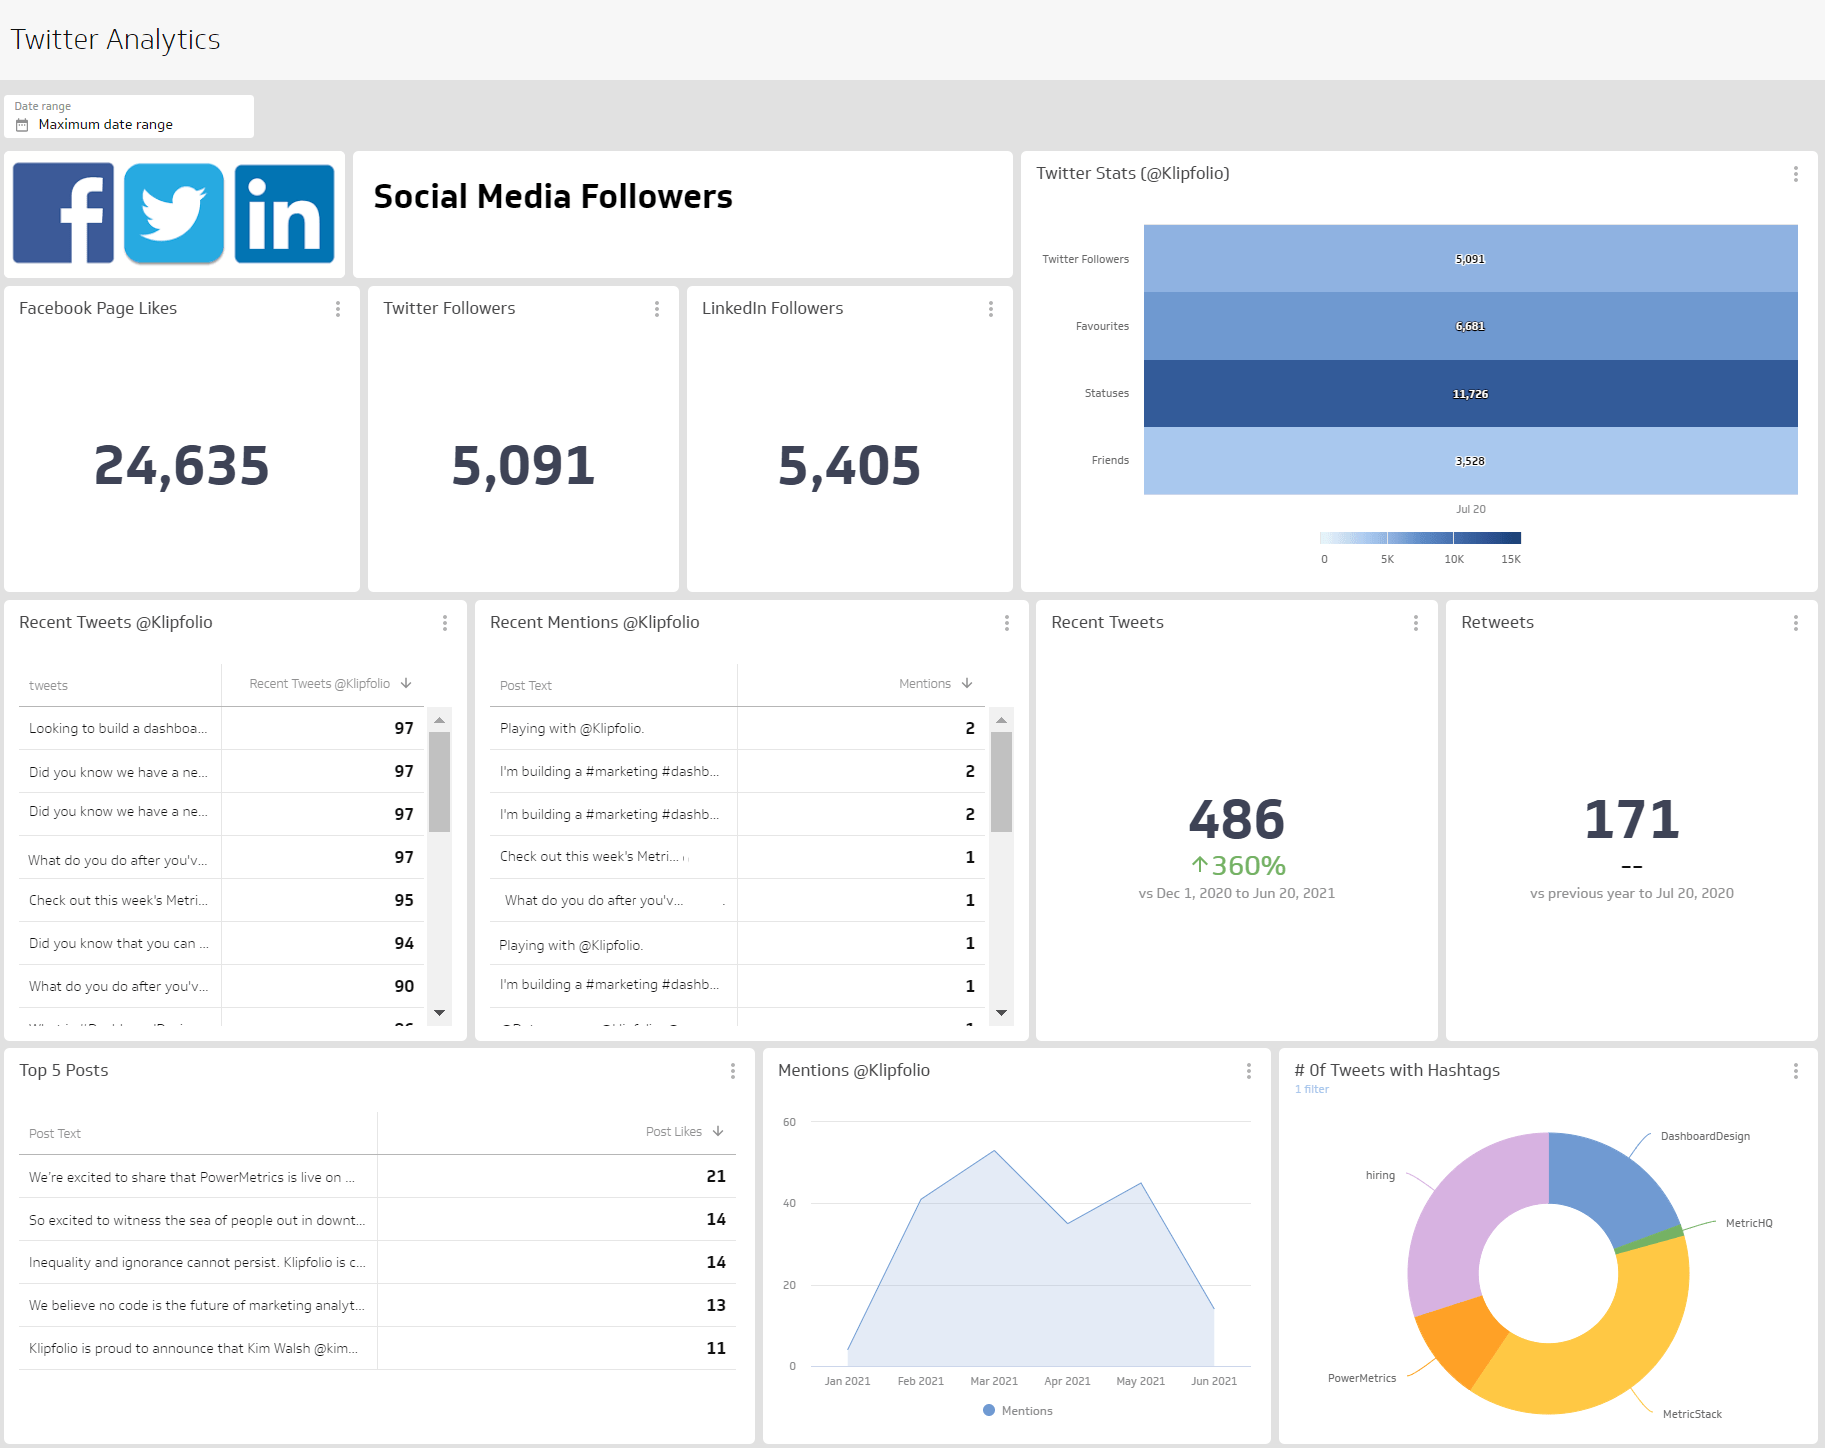
X analytics dashboard
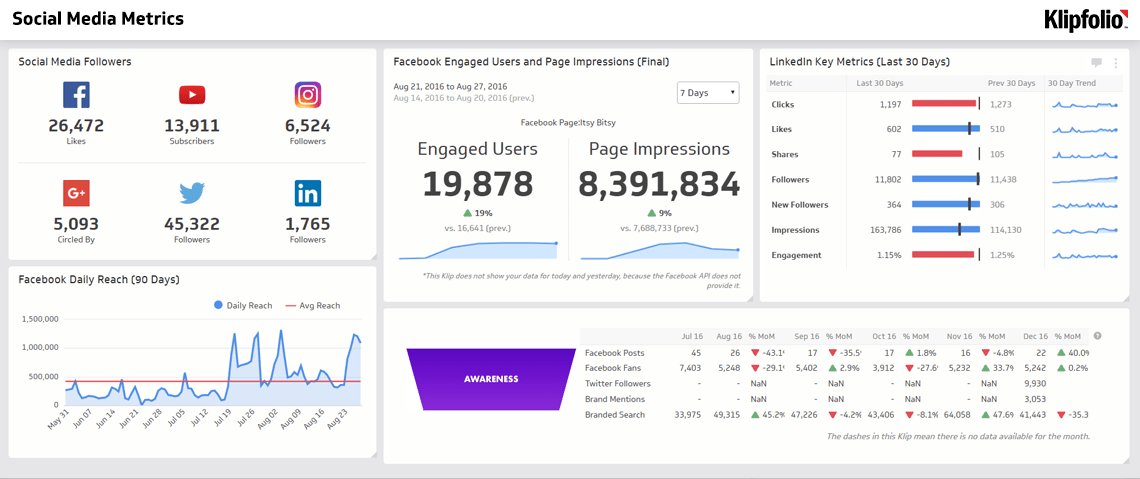
Social Media Metrics Dashboard