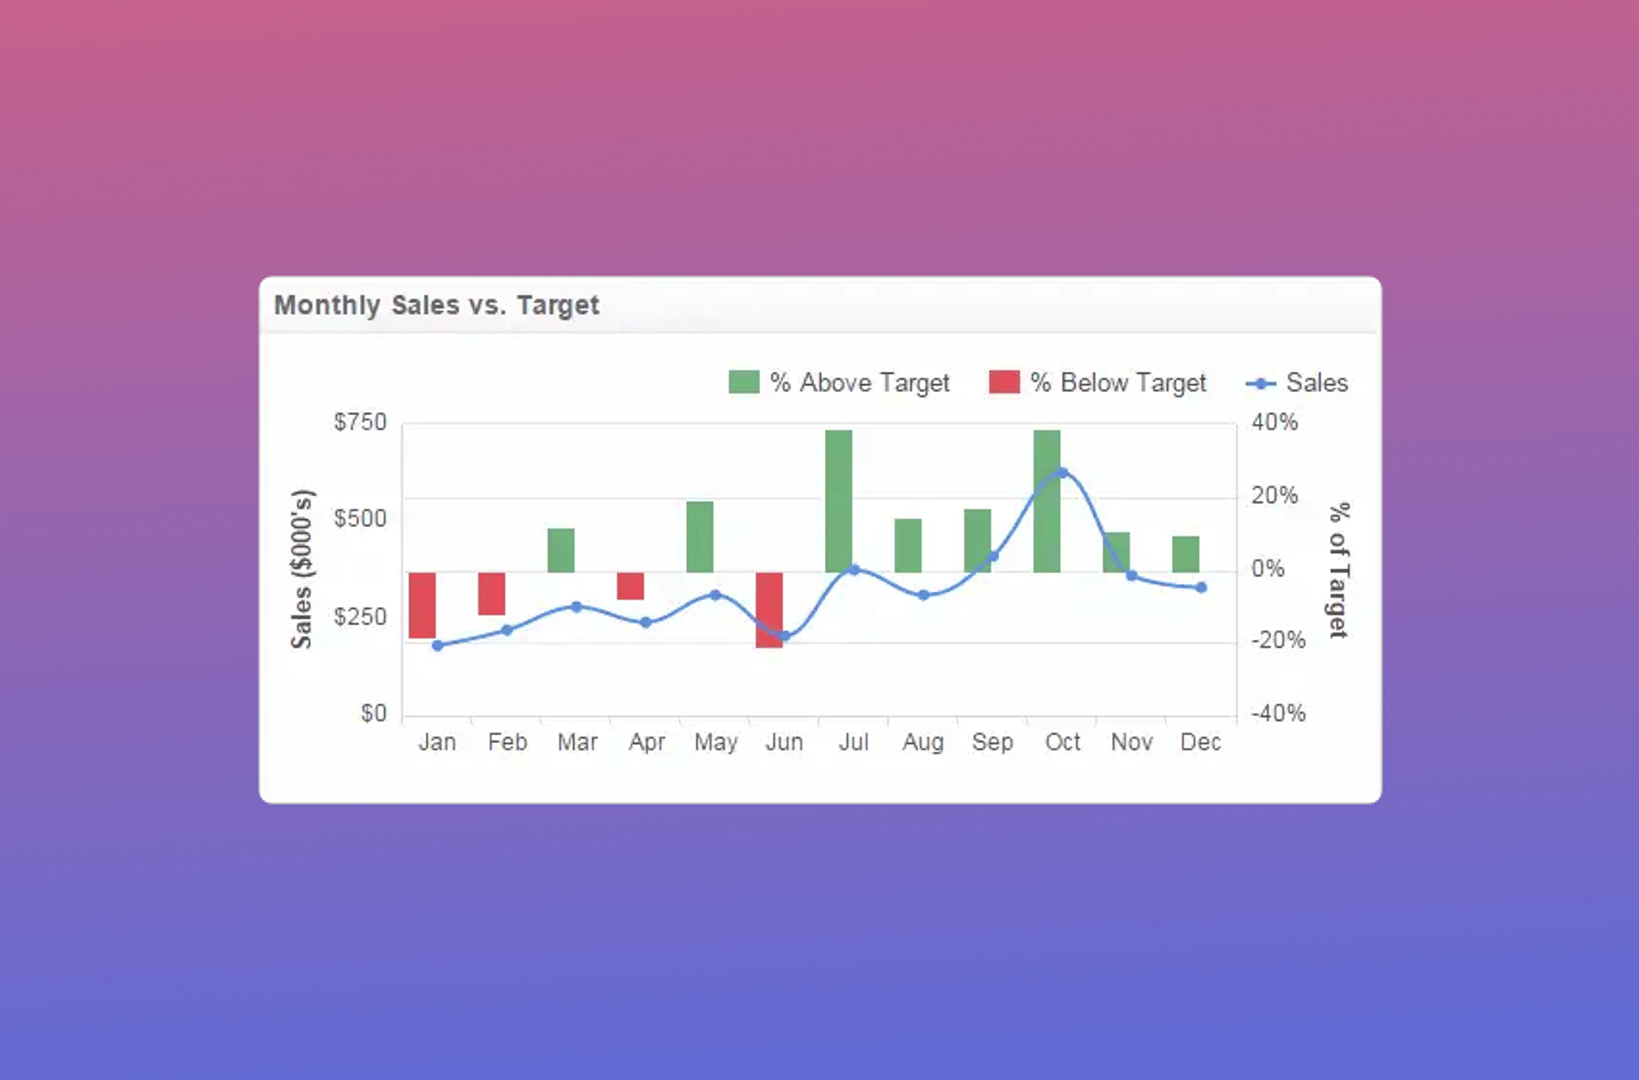
KPIs and business intelligence dashboards
Reporting should be actionable, meaningful, understandable, and accurate. Each business and department will have different key performance indicators, so time must be taken to develop unique KPIs that reflect the goals of the business.
Dashboards by industry
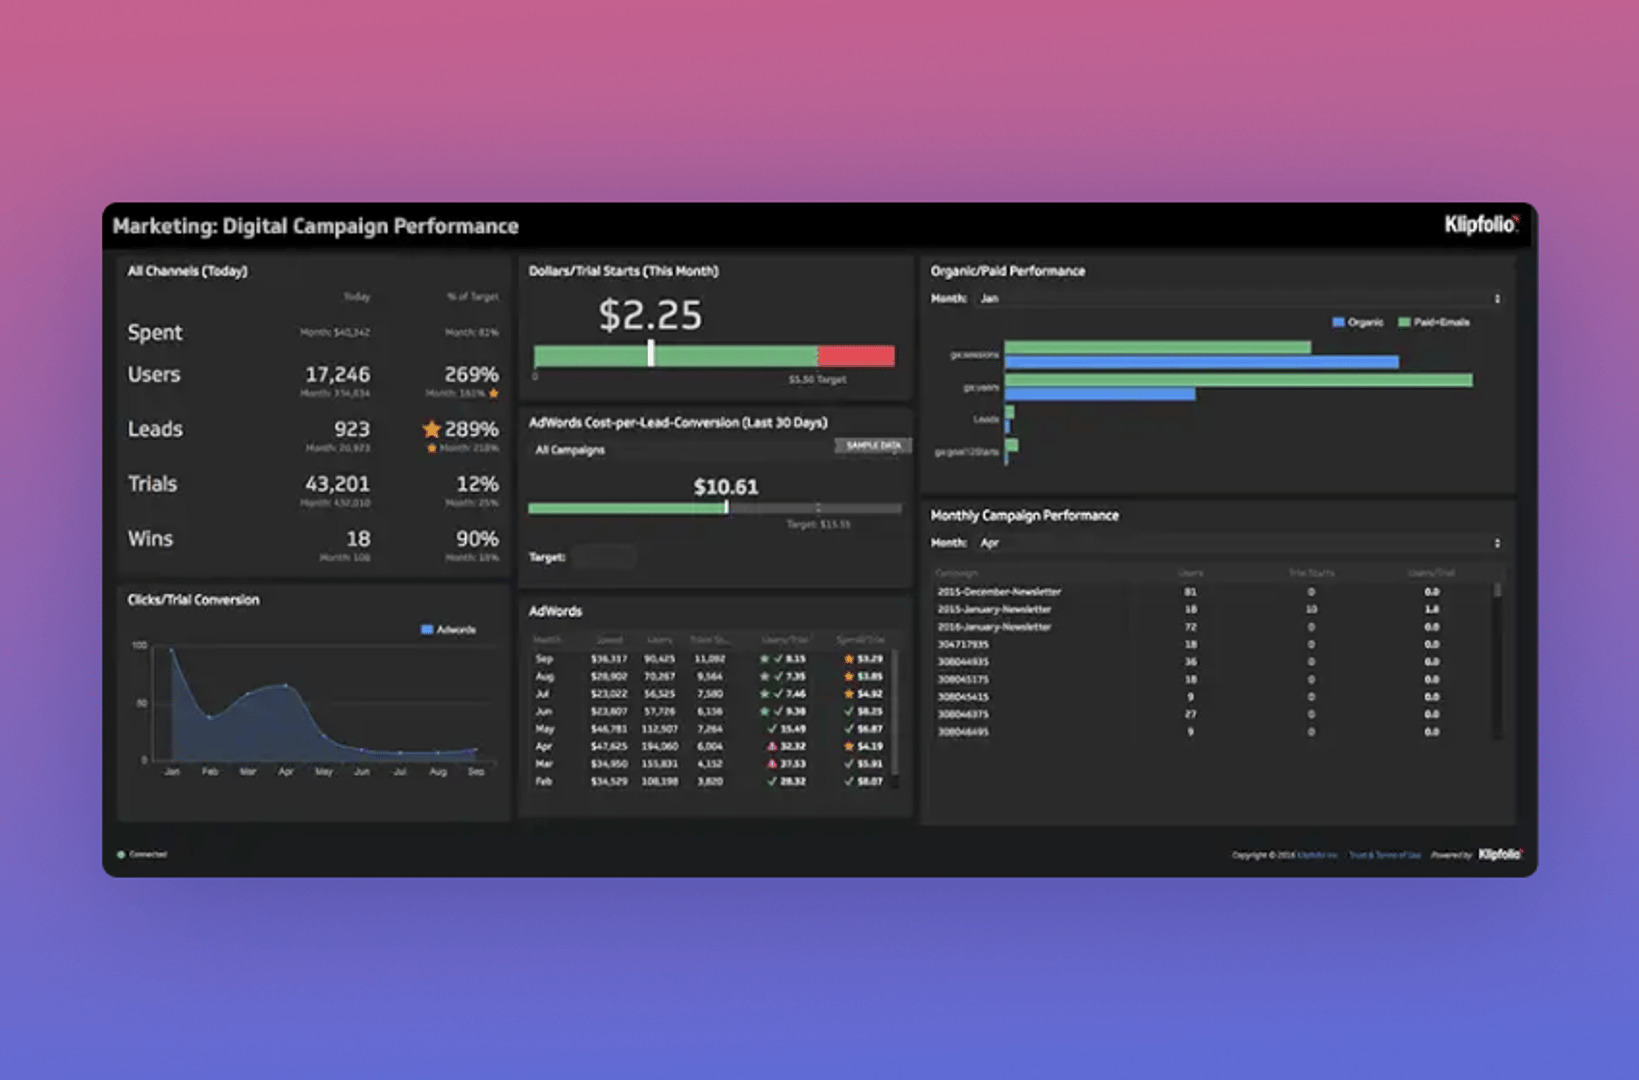
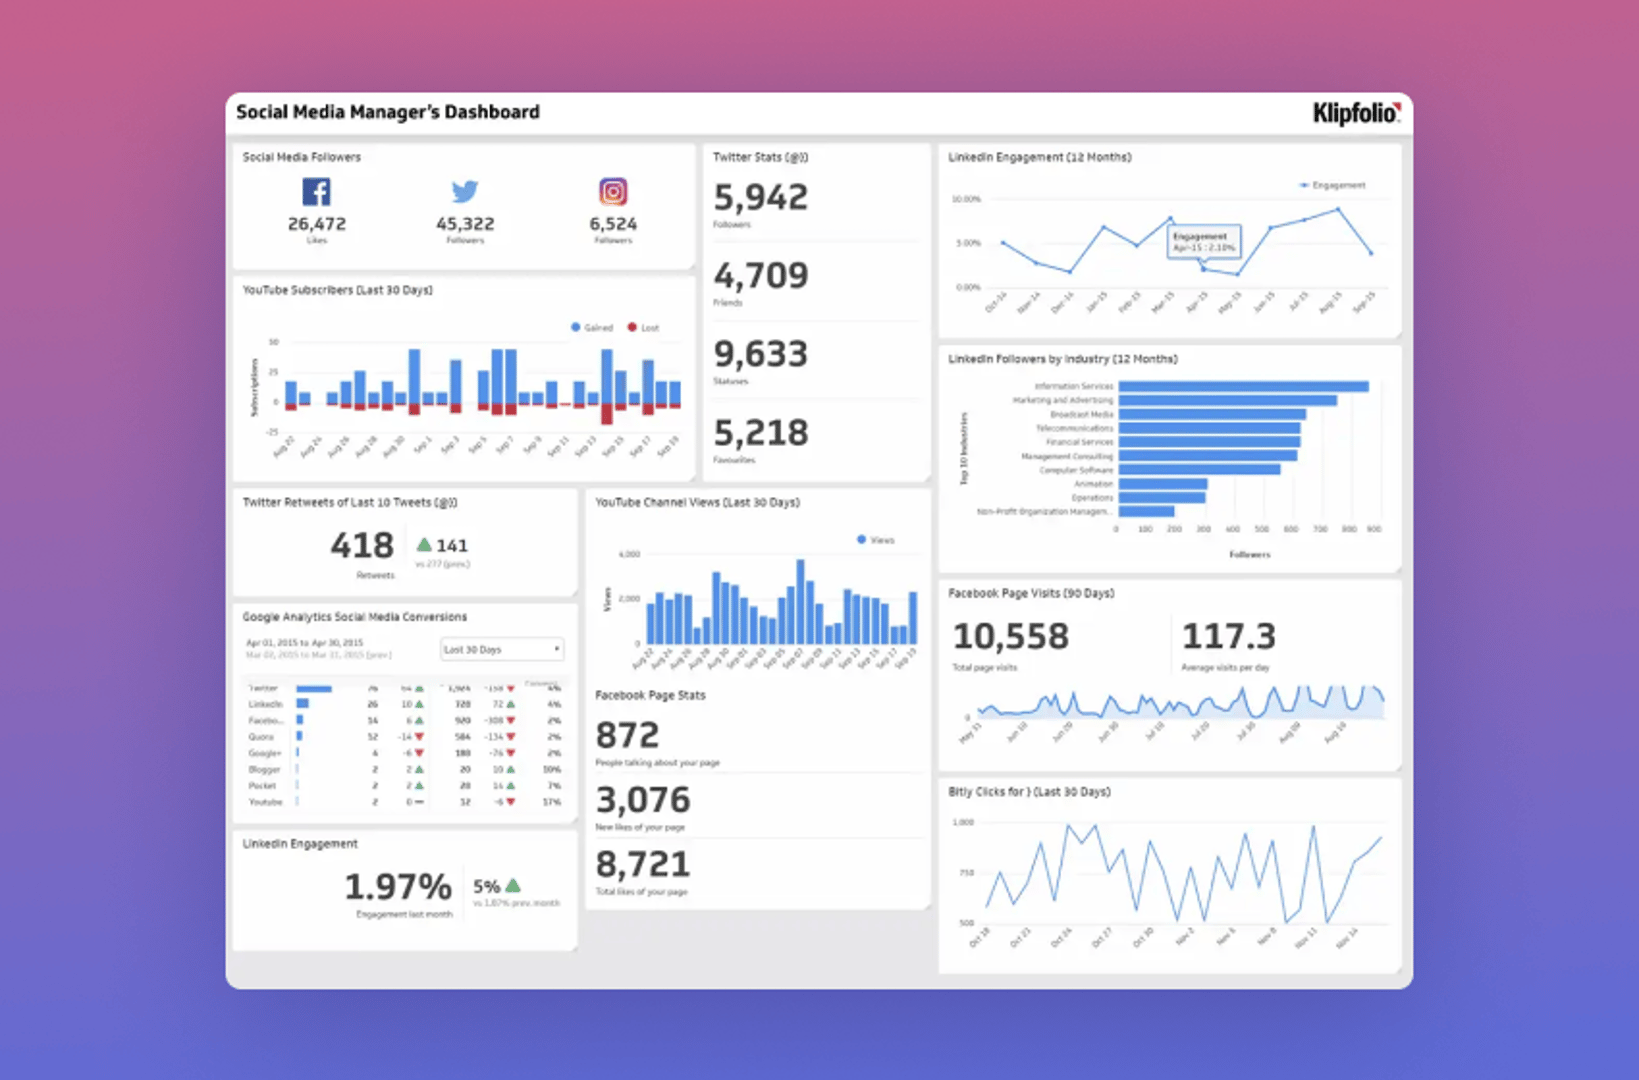
Marketing and business intelligence dashboards
The marketing department needs a dashboard that displays campaign performance, return on marketing investment, and web traffic. Learn more about the best digital marketing KPIs for your business.
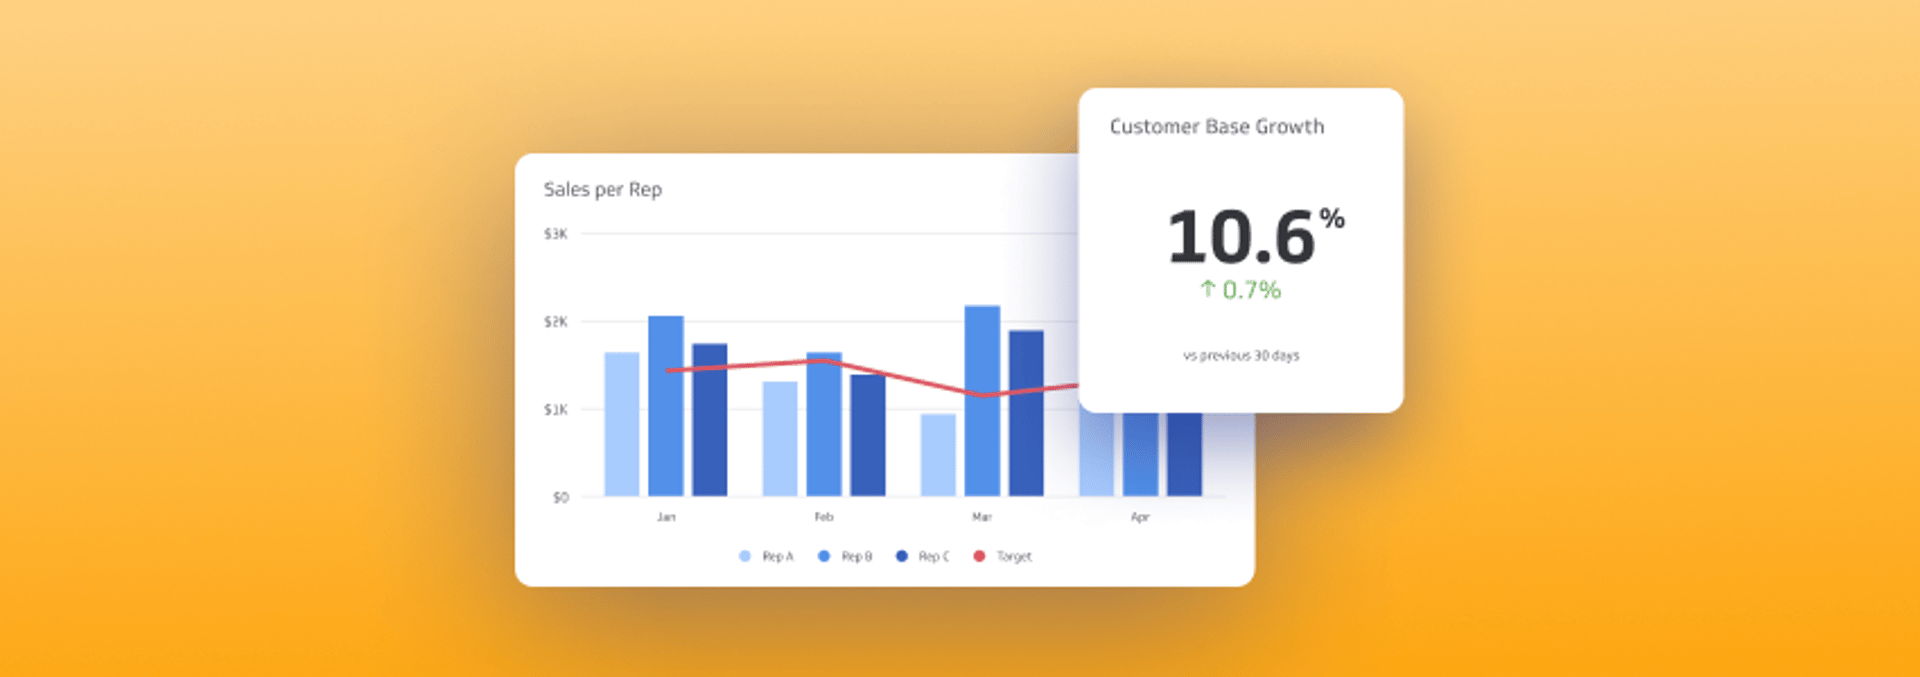
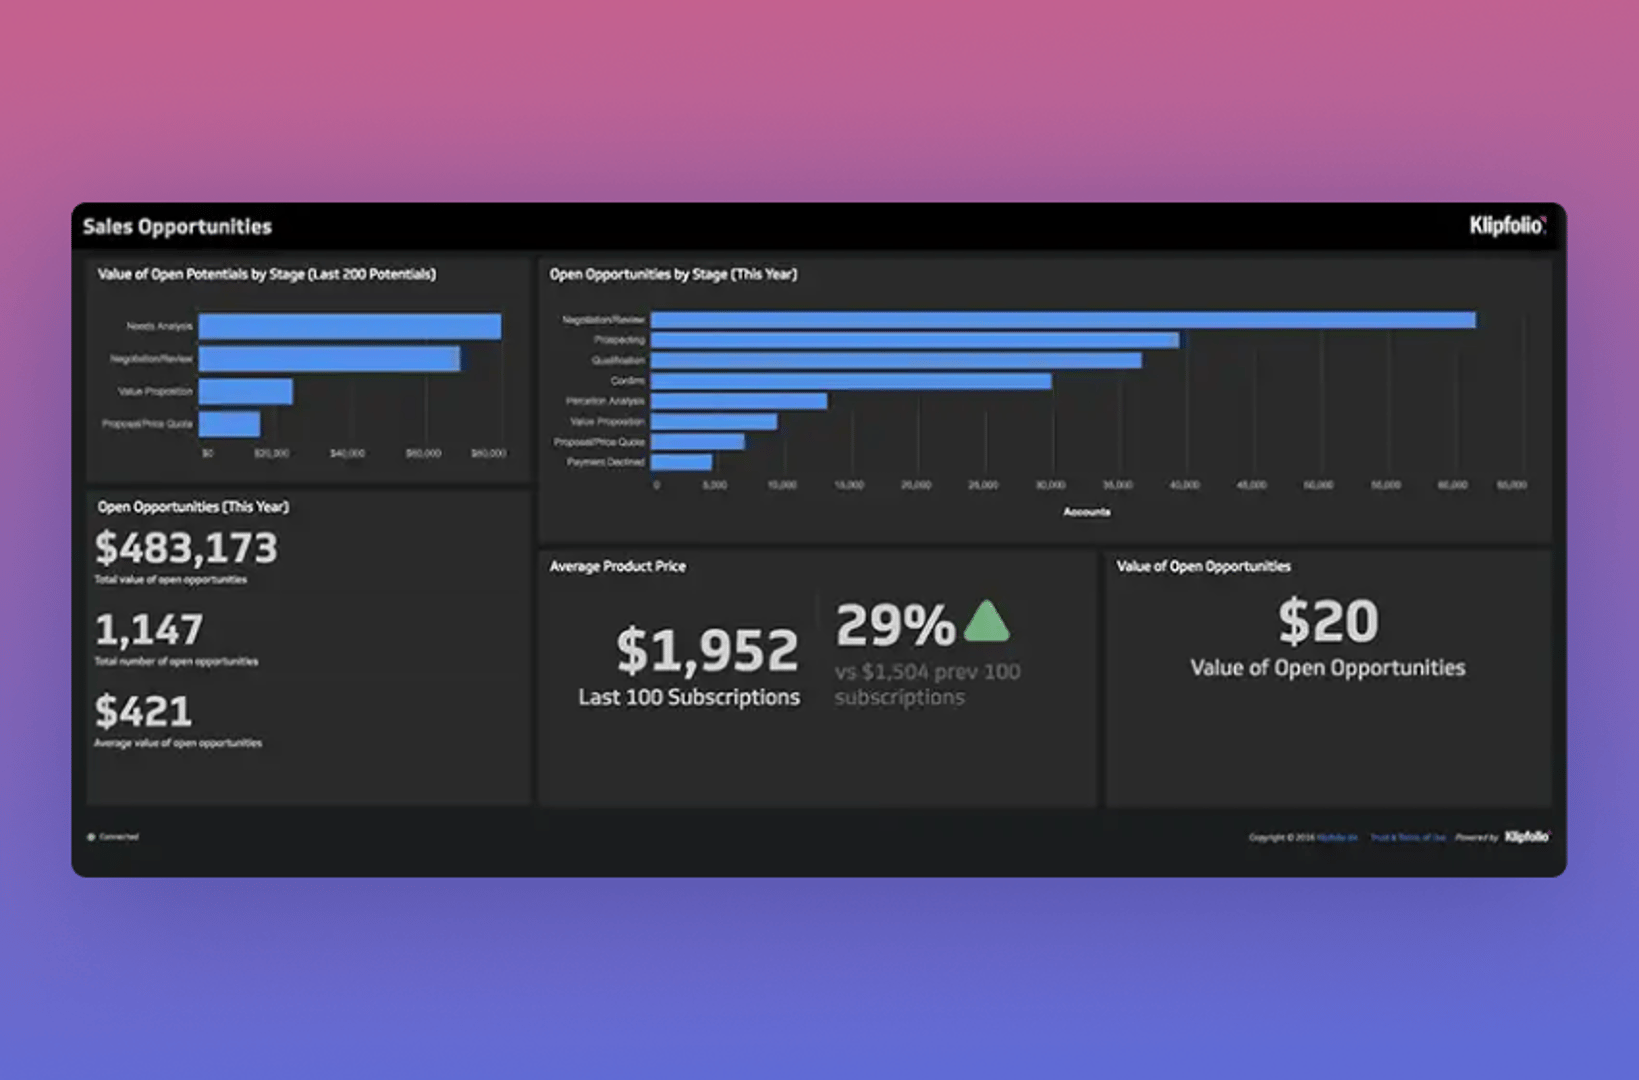
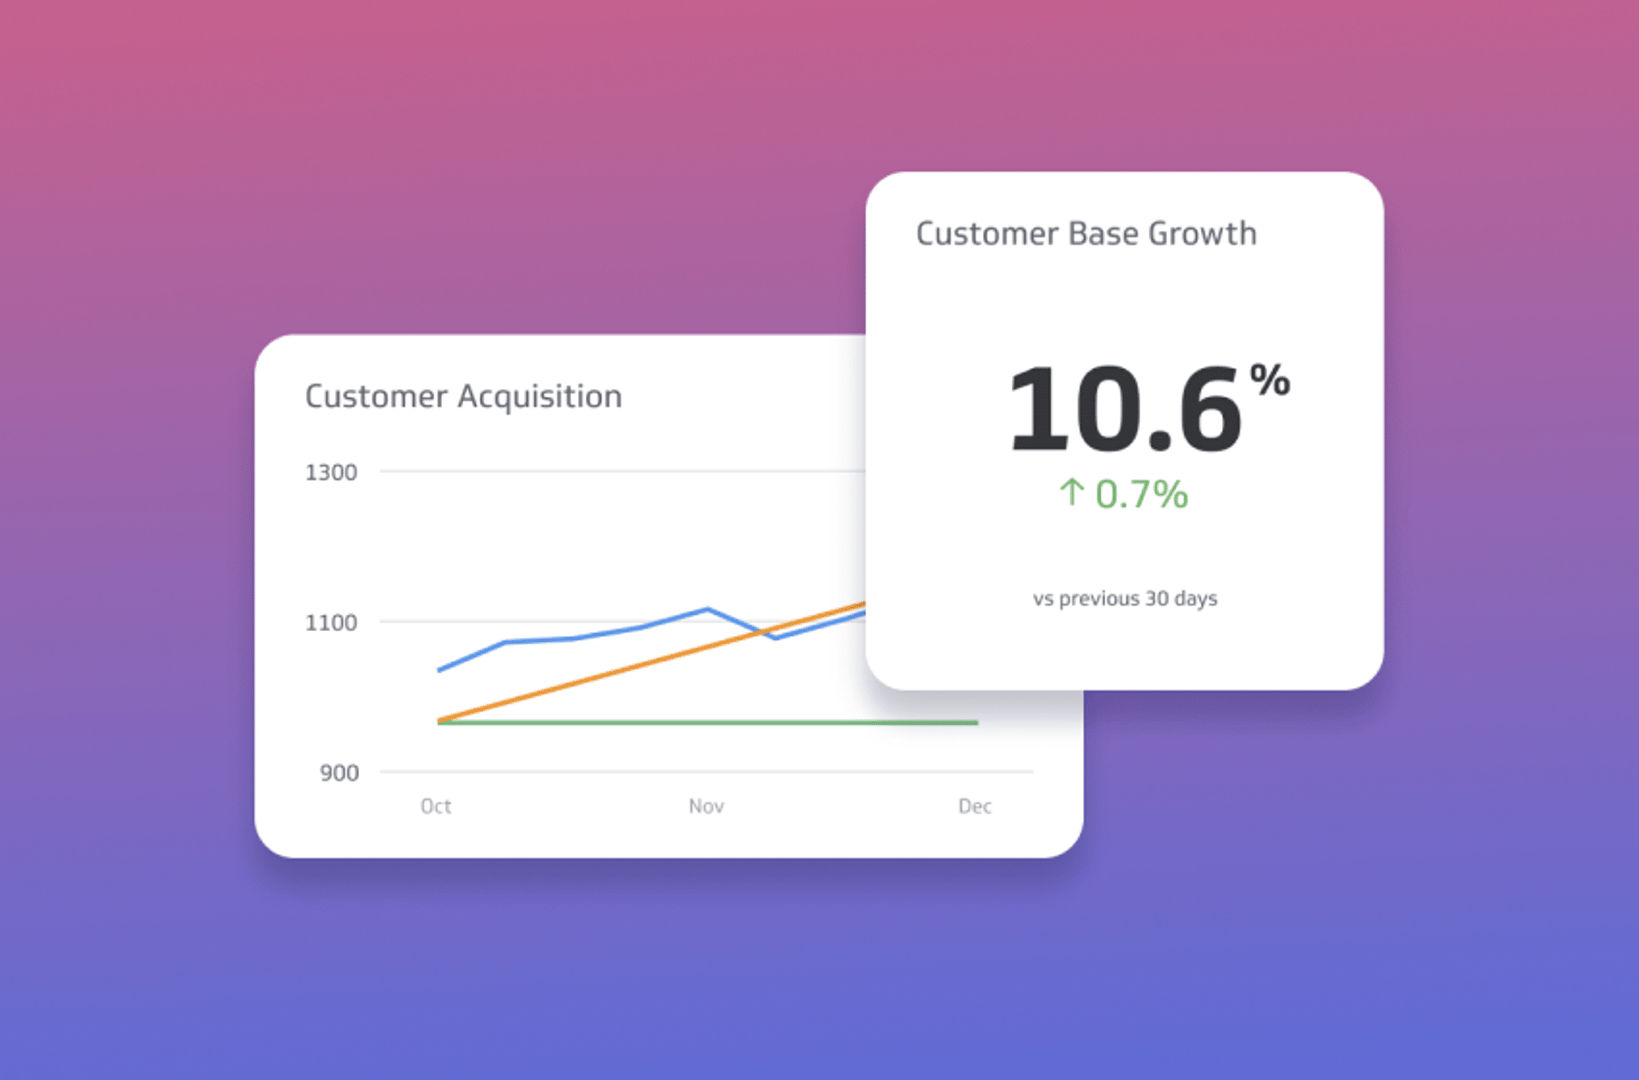
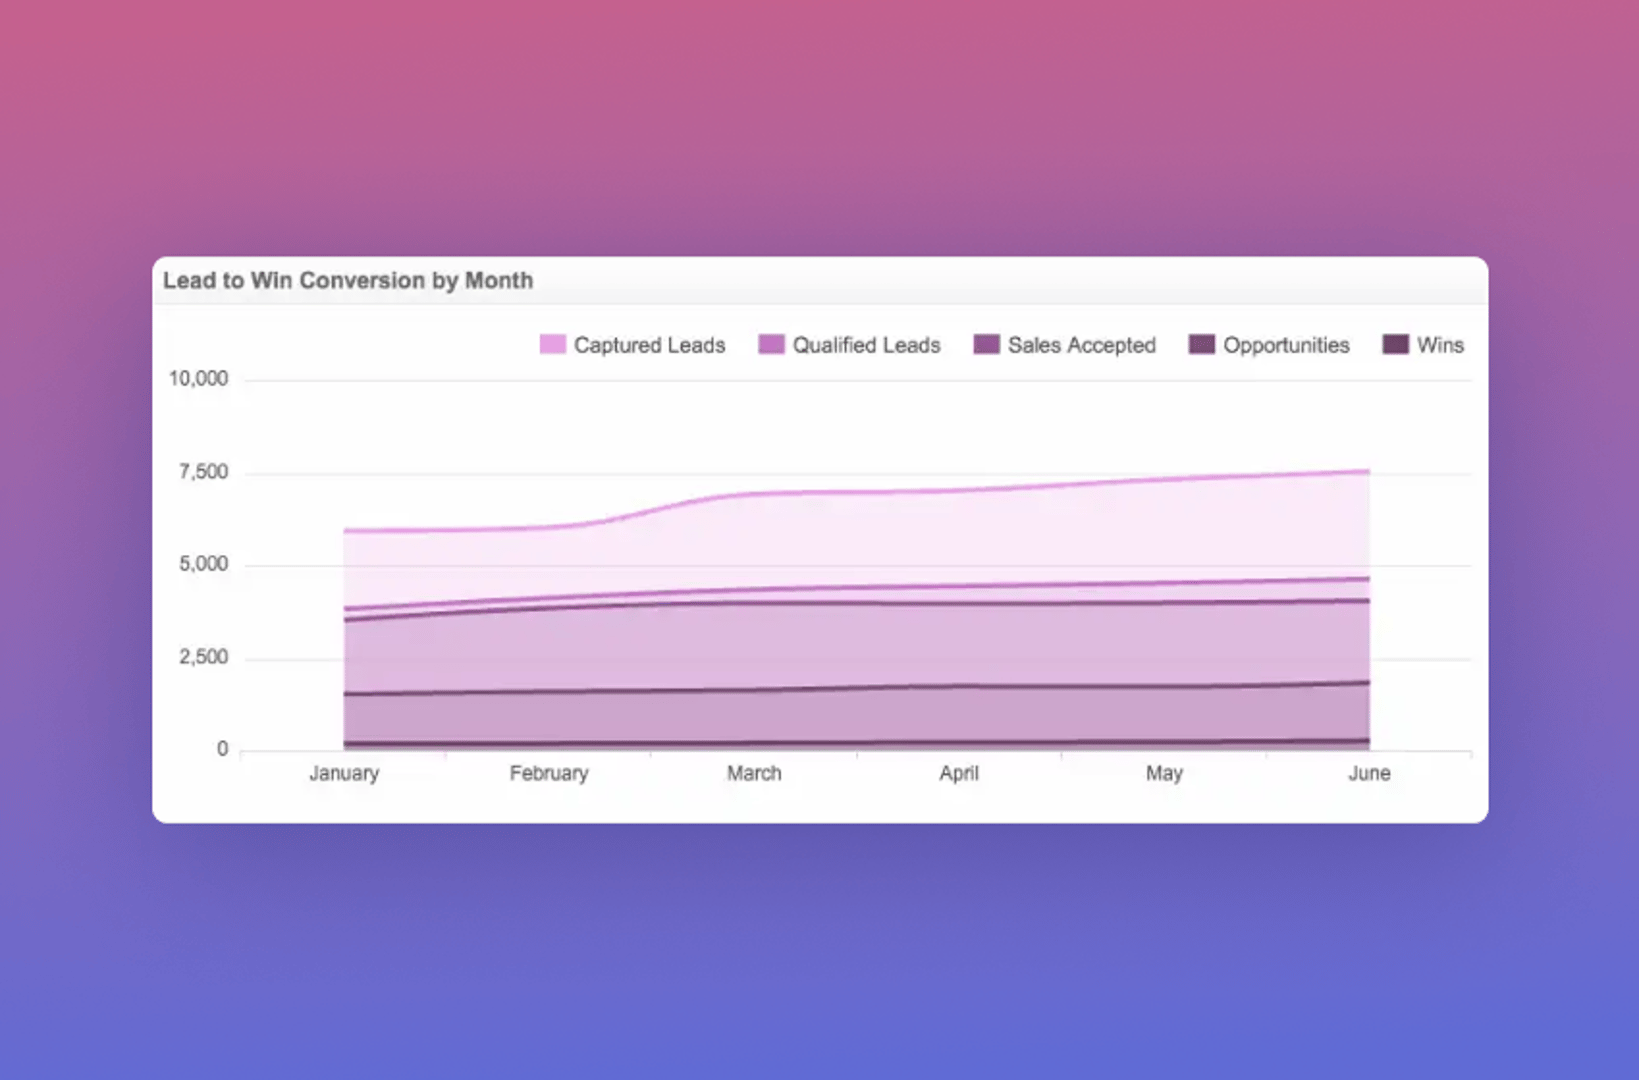
Sales and business intelligence dashboards
The sales department needs to track the number of open opportunities, account growth rate, and monthly recurring revenue growth.
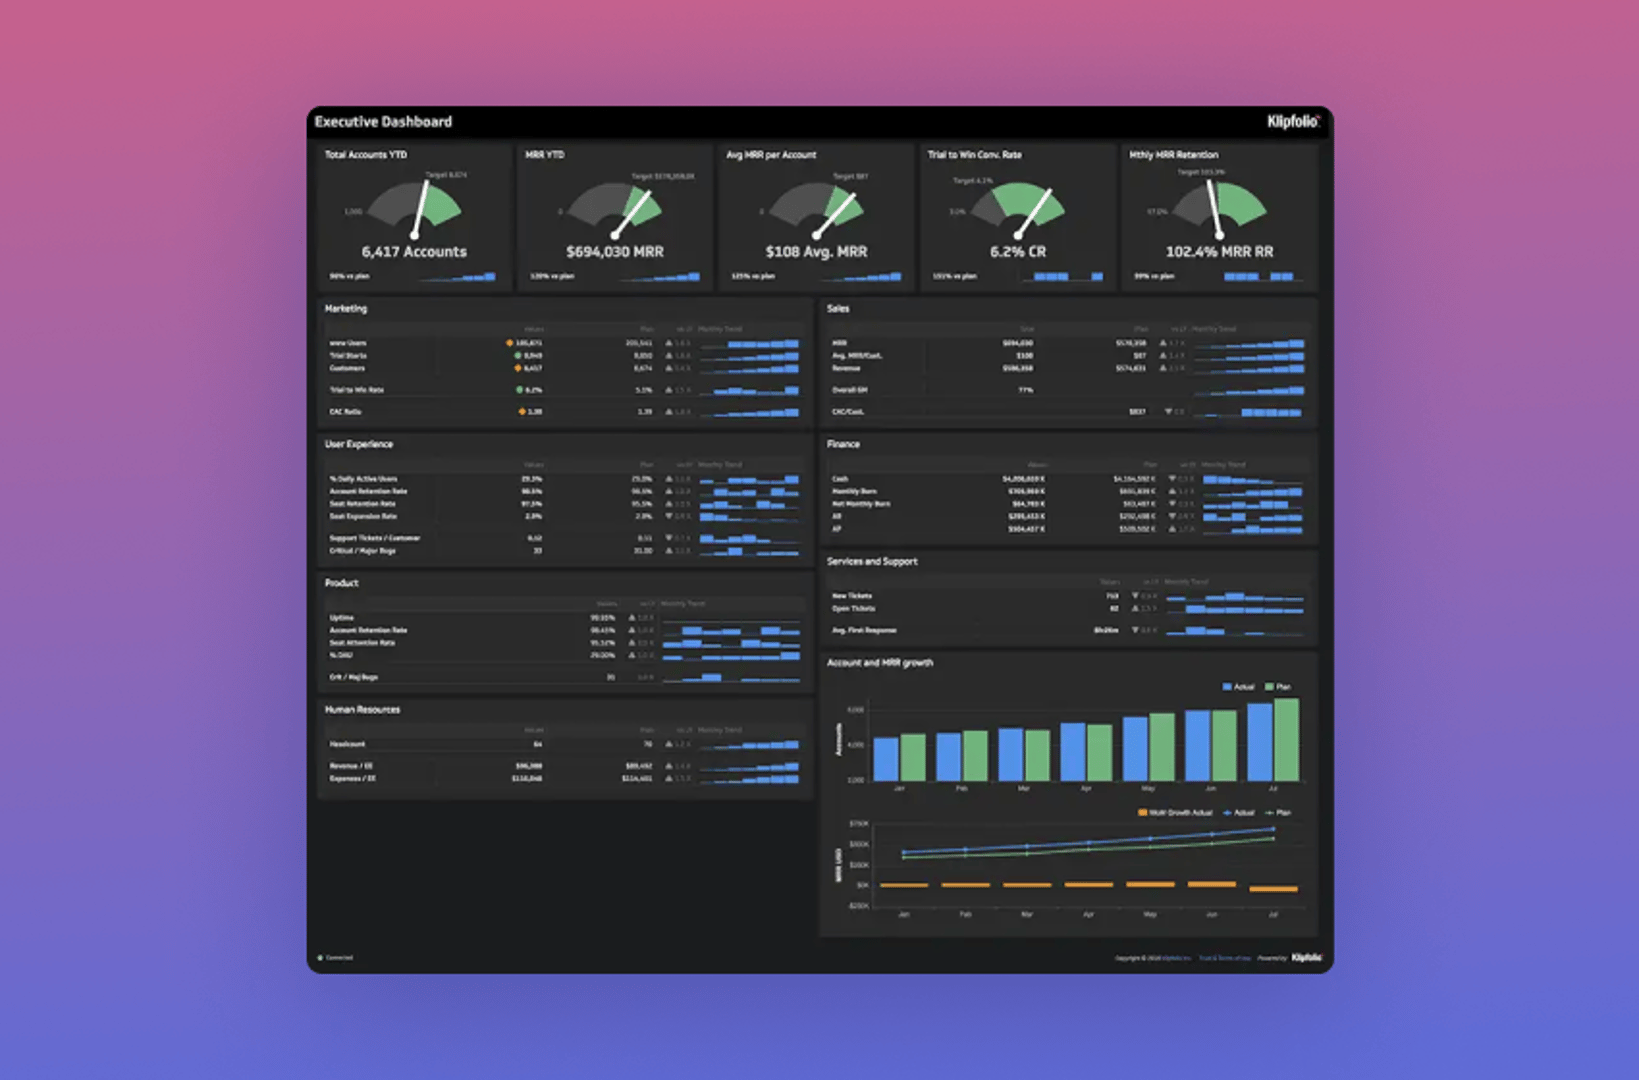
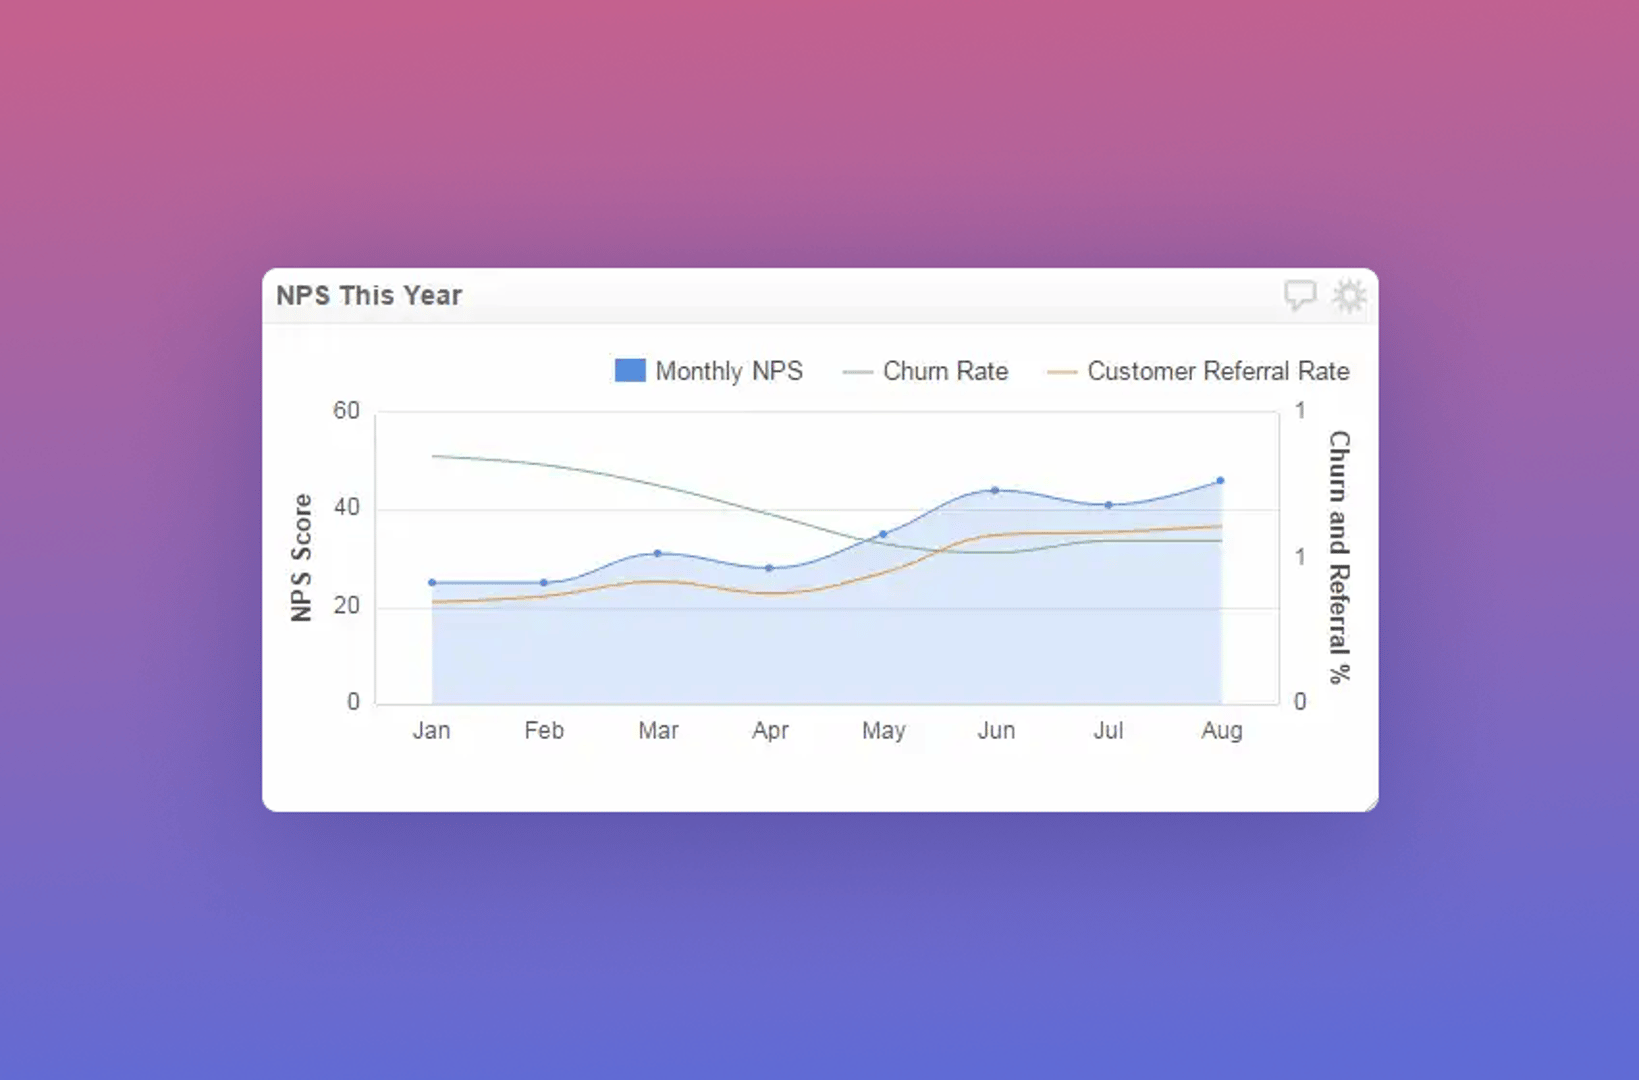
Executives and business intelligence dashboards
The executive team needs to monitor top-level data from all departments — tracking metrics such as support response time, net monthly burn, account retention rate, monthly recurring revenue, and lead-to-win rate.
KPI best practices
Best practices for picking the right KPIs for your business intelligence dashboard
When building a business intelligence dashboard, select KPIs that match the audience viewing it. Executives need a different set of KPIs than managers or specialists. Displaying irrelevant KPIs confuses your audience and leads to poor dashboard adoption.
How should you select KPIs for your BI dashboard? Here are seven tips that separate effective, value-creating KPIs from detrimental, value-diminishing ones.
Pick KPIs that are aligned with your strategic business objectives
A business's performance is ultimately relative to its mission and goals. Your KPIs should be grounded in those objectives. This can be complicated, as many companies have short and long-term goals that differ across levels of the organization. Here are a few tips to help you navigate this complexity:
Select different KPIs for different levels of your company. Use longer-term goals for executive levels and shorter-term goals for management. Rather than finding a few metrics that apply everywhere, select KPIs for each audience based on their responsibilities and the decisions they own.
Avoid cookie-cutter KPIs. Your company and its goals are unique, and your KPIs should be too.
Make sure the KPIs you pick are attainable
There is no point selecting a KPI if the underlying data cannot be obtained — either because the application is too costly or you lack the resources to implement it. Before selecting a KPI, ask yourself:
What data points do I need to measure this KPI?
What technologies and processes do I need to access this data regularly?
How much will this cost, and what are the potential returns?
Be acute in your choice of KPIs
KPIs should keep everyone on the same page and moving in the same direction. They need to be specific enough to inform concrete actions. A vague KPI can be interpreted and acted on in too many ways.
Lifetime Value to Customer Acquisition Cost Ratio (CAC/LTV) is an acute KPI. It is useful to service businesses to the extent that decision-makers understand the data flowing into it and have some control over it. "Operating Costs" is not an acute KPI and is less useful in an operational decision-making context.
Limiting the number of KPIs you focus on also matters. Here is why:
Fewer KPIs force harder thinking about what is truly key to your business.
Focus compounds. The fewer KPIs you track, the more attention each one receives.
Monitoring costs add up. The more KPIs you maintain, the more time and money it takes to track and improve them.
Pick accurate KPIs
Make sure the KPI is specific enough to be reliable. Ask yourself:
Does the KPI include all relevant information?
Does any of the data feeding into the KPI cloud the overall results?
How accurately does the KPI reflect and predict business performance? If everything is on track but the KPI is not, ask whether it is truly a key performance metric.
Select KPIs that are actionable
Is there something you can actually do to change the trajectory of this metric? If not, it is likely not the right metric to feature. The KPIs on your business intelligence dashboard should drive decisions.
Can at least some of the events the KPI measures be influenced by the business?
Can the KPI be structured in a way that inspires action?
Pick KPIs that are alive
It is easy to get comfortable with a set of KPIs you have relied on for a long time, but your business is not static — and your KPIs should not be either. Revisit them regularly and ask:
Do the original reasons for selecting these KPIs still hold true?
Has your business or its operating context changed?
Can your KPIs be refined to reflect those changes?
Are decision-makers actively working to improve them?
Do they have the right tools to do so?
Is your KPI ecosystem supporting data-driven decision-making and improving business outcomes?
Display KPIs that you care about
Pretty metrics are not enough. Every KPI on your dashboard needs a purpose. When adding examples of KPIs and metrics to your business intelligence dashboard, ask yourself: "Why do we care about this?" If no clear business question drives the visualization, leave it off the dashboard.
Designing a business intelligence dashboard
Business intelligence tools and dashboards help you stay in control of your business, but some dashboards do this better than others. Here are a few dashboard design best practices to follow.
- Build one dashboard for each role — don't try to create a one-size-fits-all dashboard
- Feature comparison values to give metrics context
- Group together related data so viewers can scan sections quickly
- Make your visualizations scannable and precise — remove anything that does not add meaning
- Use colours appropriately — avoid multiple random colours that create visual noise
- Make results clear and easily digestible — your audience should understand the dashboard at a glance