

Summary - Data is all the rage in 2019, with some calling it “the new oil.” It’s valuable, sought-after, and it drives profits and fuels acceleration. The only problem with data as a means of growth is that without careful management, it quickly becomes obsolete. So if you’re planning on gathering data, you should first ask yourself three questions: 1) Why are you gathering data? 2) How
Data is all the rage in 2019, with some calling it “the new oil.” It’s valuable, sought-after, and it drives profits and fuels acceleration. The only problem with data as a means of growth is that without careful management, it quickly becomes obsolete. So if you’re planning on gathering data, you should first ask yourself three questions:
1) Why are you gathering data?
2) How are you storing your data?
3) What are you doing with your data?
If your data is sitting around gathering dust because it’s too poorly organized for effective analysis, it might as well not exist. With that in mind, let’s take a look at proper data management, why it matters to the modern marketer, and how transitioning to a visual platform like Klipfolio can be instrumental in your growth journey.
Why Are You Gathering Data?
Ah, the all-important question that so many agencies forget to ask themselves. We all know that data matters, and we all know that it can be used for prolific growth — but if you don’t have a set goal, you haven’t even reached the starting line.
Defining the purpose of your data is a bit like creating an essay thesis: The final result is often either too broad or too narrow...But there’s a happy medium of perfection somewhere in the middle. The bottom line is that you don’t want to limit yourself too much, but you also don’t want to leave your purpose so wide open and unrefined that you end up lost and confused in a field in Omaha.
Here’s a great example of a strategic data-gathering goal:
“I want to determine which of my three core value adds my audience is best responding to.”
With this goal, you know exactly what you’re trying to find—and there’s a clear benefit to your bottom line. Once you find this information, you can evolve a well-rounded strategy based on your conclusions.
How are you storing your data?
Data makes for a flighty partner. It’s easy to lose track of it, and once you’ve lost it can be darn hard to get back. That’s why it’s incredibly important that you’re funneling all your hard-earned data into a modality that enables you to make the most out of it.
A popular choice is Google Data Studio, which offers a variety of dashboarding and data visualization tools to help you harness the power of your collected data. In fact, Google Data Studio was the choice of our team at Arora Project for some time, but the platform comes with some downsides:
It’s with those hurdles in mind that our team recently made the switch to Klipfolio, which offers a lot more versatility for advanced users— and yet combines those complex capabilities with unparalleled visual dashboards that make client-facing conversations much more impactful (while opening the way to effective, streamlined data analysis). As Carly Fiorina, Former CEO of HP, succinctly explains:
“You want everyone to be able to look at the data and make sense out of it. It should be a value everyone has at your company, especially people interfacing directly with customers. There shouldn’t be any silos where engineers translate the data before handing it over to sales or customer service. That wastes precious time.”
Whichever tool you choose to achieve this accessibility goal, the important thing to remember is that storage matters. If you’re going to use your data effectively, you need to have it all in one place, and you need to be able to rely on your platform of choice.
What are you doing with your data?
So you’ve set a goal, you’ve found a storage platform that works for you (Klipfolio if you’re a smart cookie). Now don’t just let your data set gathering dust. It’s a waste, and nobody likes waste.
You have all the tools at your fingertips to convert your data into growth. And that means the dreaded word — analysis. You need to look at your data and begin drawing conclusions from it.
Complicated, right? Actually, with the right visualization, this can be easy. Here’s a (very simplified) example of using Klipfolio’s visualization tools to draw data-based conclusions.
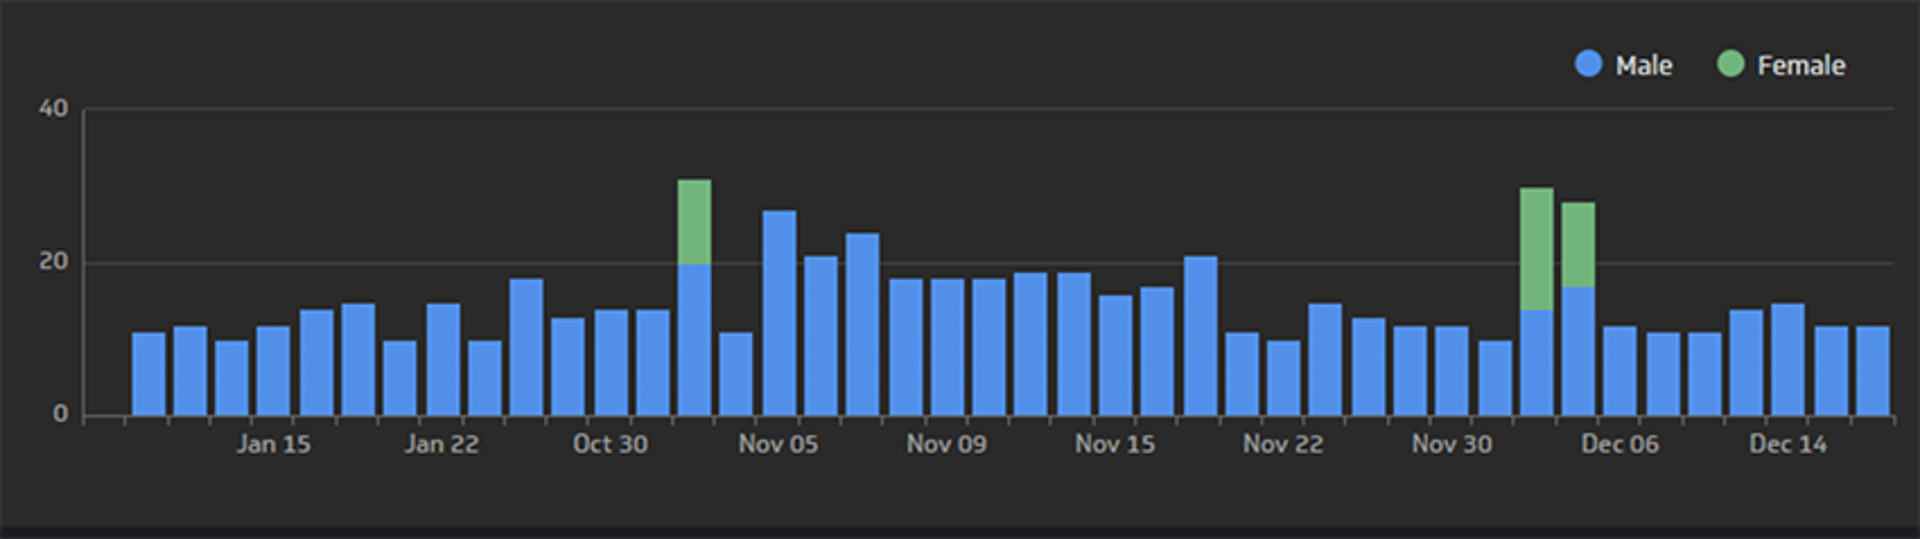
From the chart, it’s abundantly clear that this company is wasting time and money marketing to the female demographic. With this conclusion In mind, the company can quickly begin throwing all of their marketing dollars into efforts aimed at the male demographic.
Of course, this is a kindergarten-level example. But the fundamentals are the same. As long as you know your ABCs, you can use visual data tools to organize your data and draw immediate conclusions to optimally impact your bottom line.
Once you’ve drawn your conclusions and are confident that they’re supported by data, don’t miss the all-important next step: Asking more questions. This is how you refine your funnel and take your data implementation to the next level. Chris Savage, CEO of Wistia, explains this well in a discussion on using data that differentiates you from the competition:
“As you gain fresh insight from your data, it opens the door to new questions. As you have new questions, you need to update your instrumentation and analysis. Saying the process is “done” is saying you understand everything there is to know about your users, product, and channels.”
Going back to our oversimplified example, that means that now we know our core audience is the male demographic we not only have to ask ourselves “why,” but we have to hone in on what drew them to our product in the first place. What’s the commonality? Do they all like to watch YouTube videos of cat fails? Are they all under 6 feet tall? The more we learn about our audience, the more we can implement effective marketing strategies that trigger growth.
At the end of the day, all of these insights and stratagems come from how you’re managing your data. Once you have a visual platform like Klipfolio well-established, you have everything you need to define and redefine your goals, measure the metrics that matter, and draw conclusions that actually have significant meaning.
Related Articles

5 tips to understand (and organize) your restaurant data
By Saleem Khatri — June 9th, 2026
PayTabs embraces a data-driven strategy with KPI dashboards
By Mitch Dupuis — June 25th, 2025
What is data literacy and why does it matter?
By Emily Hayward — May 21st, 2025
