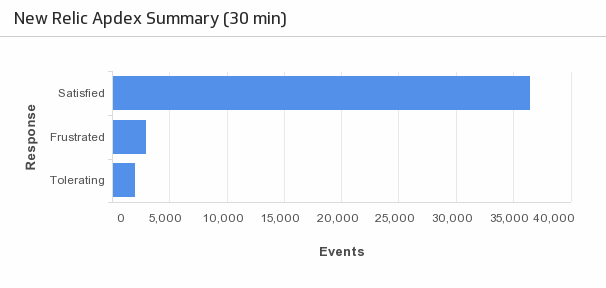
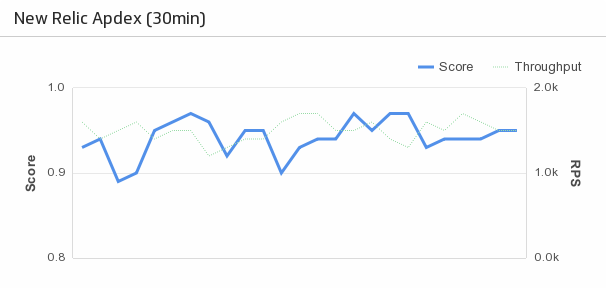
New Relic
Uptime Report
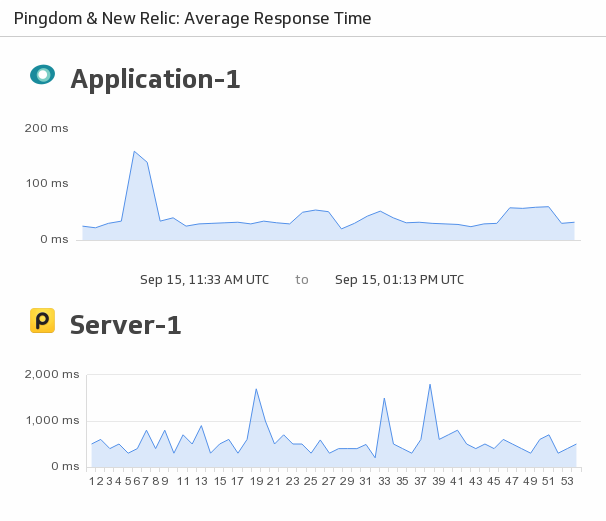
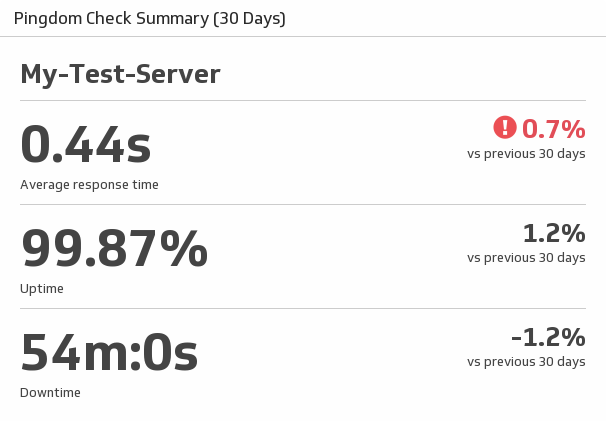
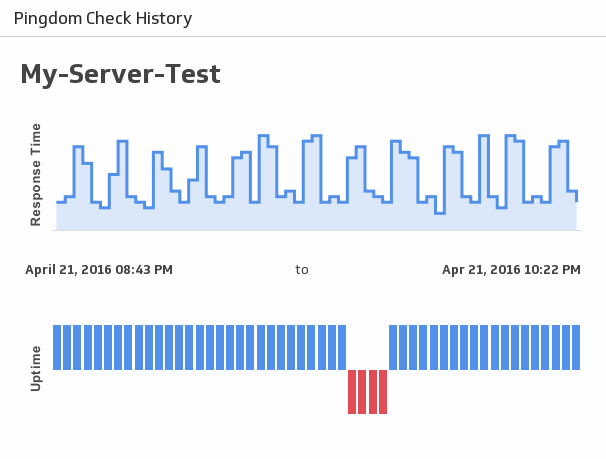
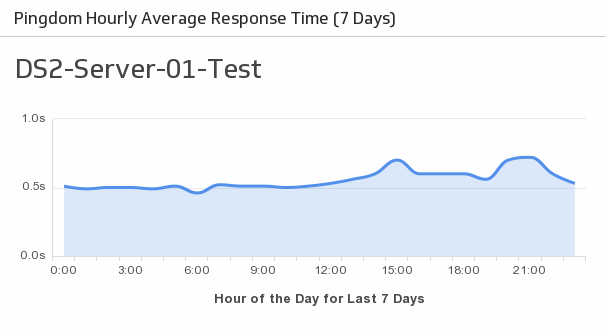
Monitor the uptime of your chosen server using New Relic and Pingdom.
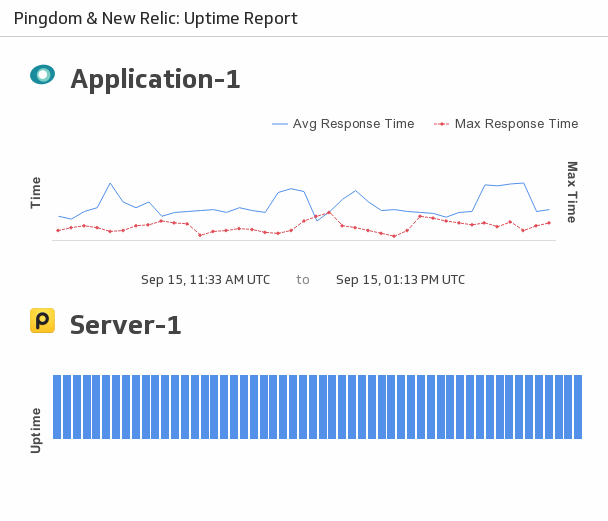
Monitoring uptime is a critical operational metric. Any downtime or lag in response time could mean a loss in customer trust. This dynamic metric allows you to bring together your data from 2 major services that help you manage your servers.
About the visualization
Create a comprehensive uptime report and track response time trends with this Klip.
About New Relic
A platform for DevOps and tech teams, New Relic is a software analytics company that gives users the ability to measure and monitor infrastructure and app performance.
About Pingdom
Connect Pingdom to Klipfolio Klips and display your website uptime, response times, and error data in a live dashboard. Use pre-built Klips or build a custom Pingdom dashboard from scratch.