Pingdom
Pingdom allows you to track your site’s performance and with uptime, real user, transaction, synthetic, server, experience, and website availability monitoring.
Track all your Pingdom KPIs in one place
Sign up for free and start making decisions for your business with confidence.


Build a Pingdom dashboard with Klipfolio
With Klipfolio, you can build a custom Pingdom dashboard to monitor the uptime and performance of your websites, cloud applications, and servers. A Pingdom dashboard will help you track website monitoring metrics like uptime, response times, and error times.
How to build a Pingdom dashboard
There are two ways to build dev-ops dashboards in Klipfolio:
- Klip Gallery - Use pre-built Pingdom metrics
- Connector Gallery - Use the Connector Gallery to create a custom Pingdom dashboard
Use pre-built Pingdom metrics
Assemble a Pingdom dashboard by selecting pre-built metrics from the Klip Gallery.
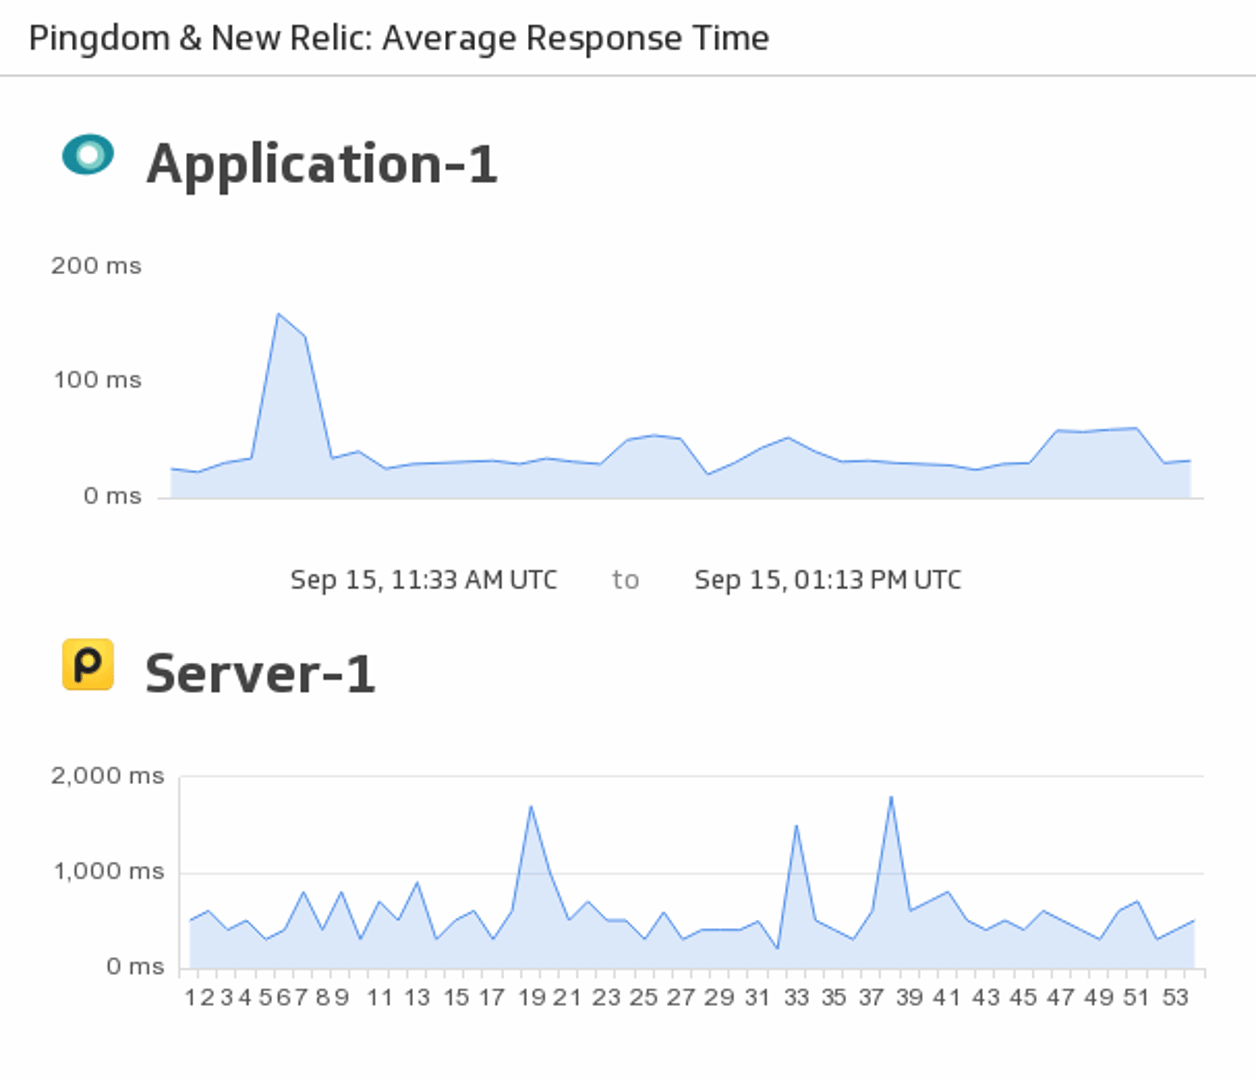
Average Response Time
Make sure to stay on top of your server and application response time by merging your New Relic and Pingdom data to monitor responsiveness in real-time.
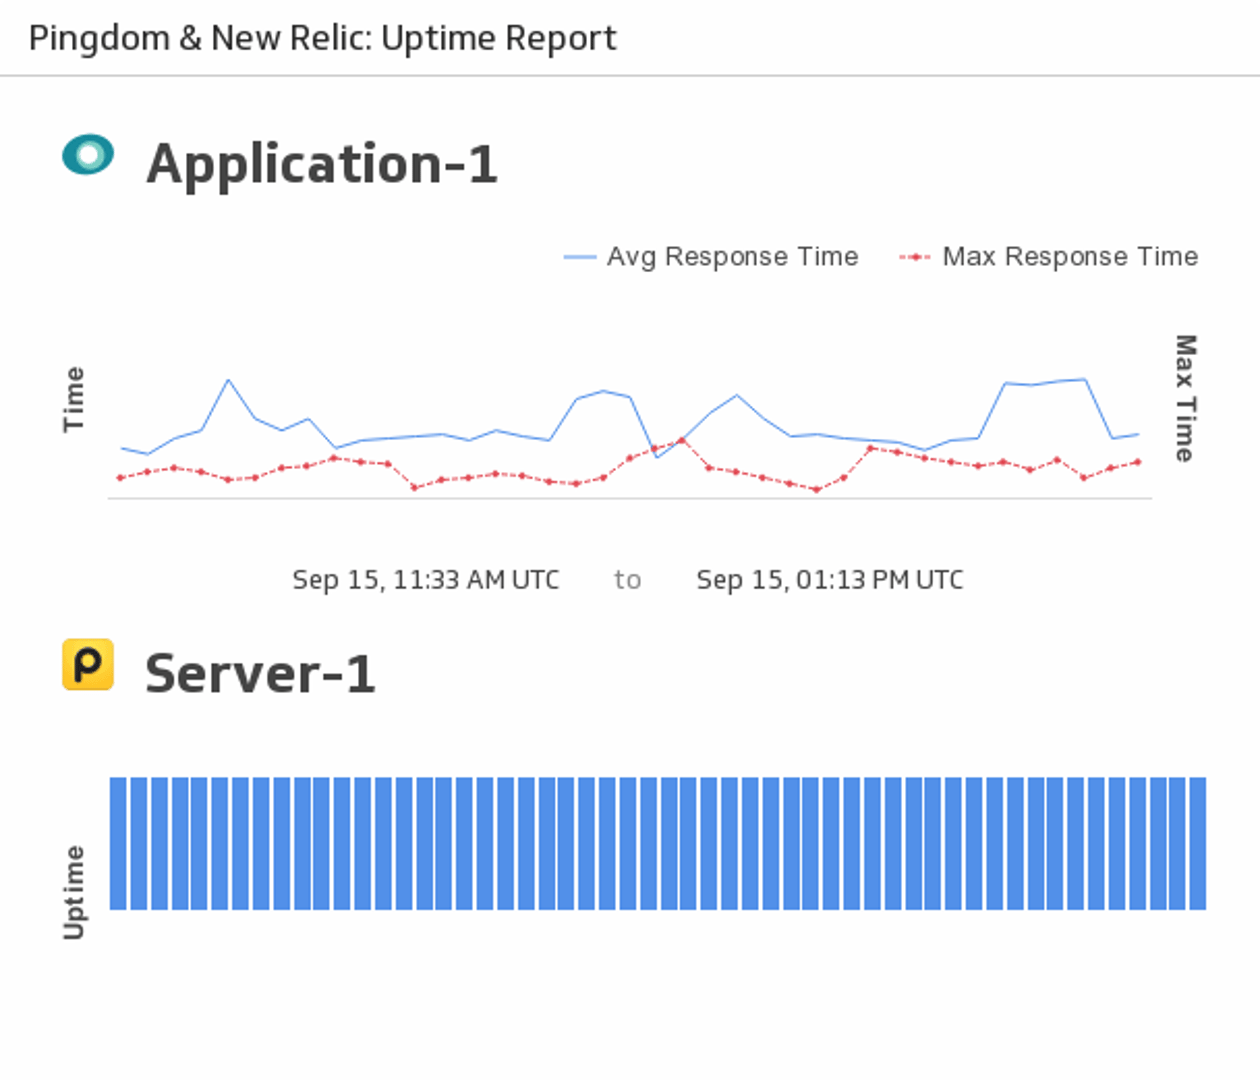
Uptime Report
Monitor the uptime of your chosen server using New Relic and Pingdom.
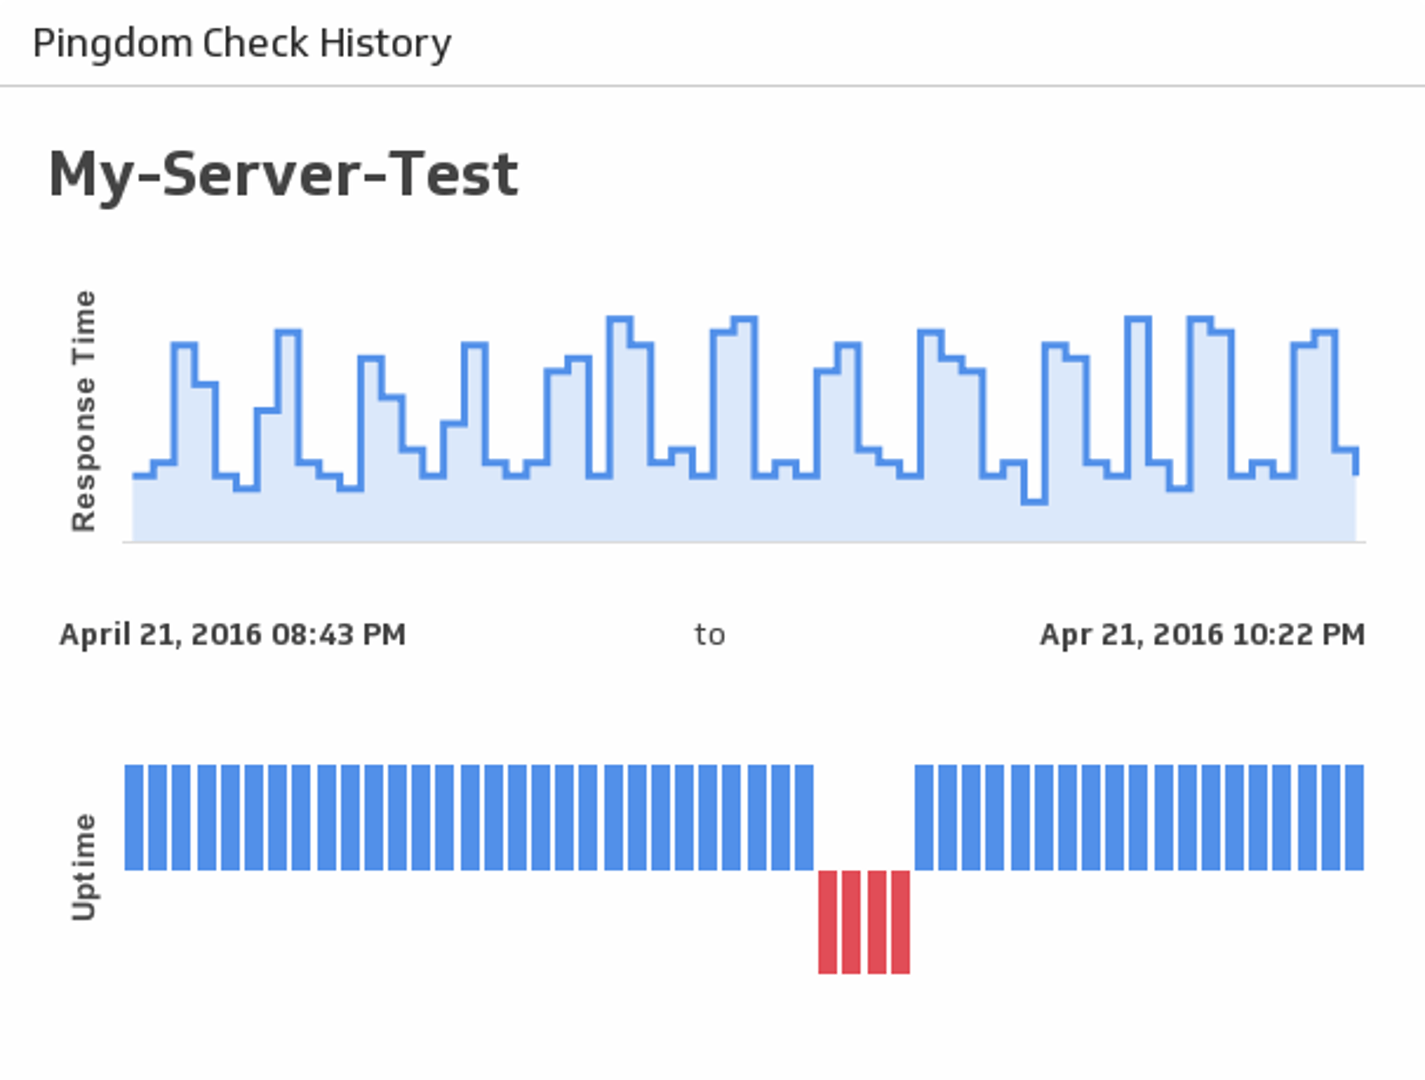
Check History
See historical uptime and response times for a server of your choice.
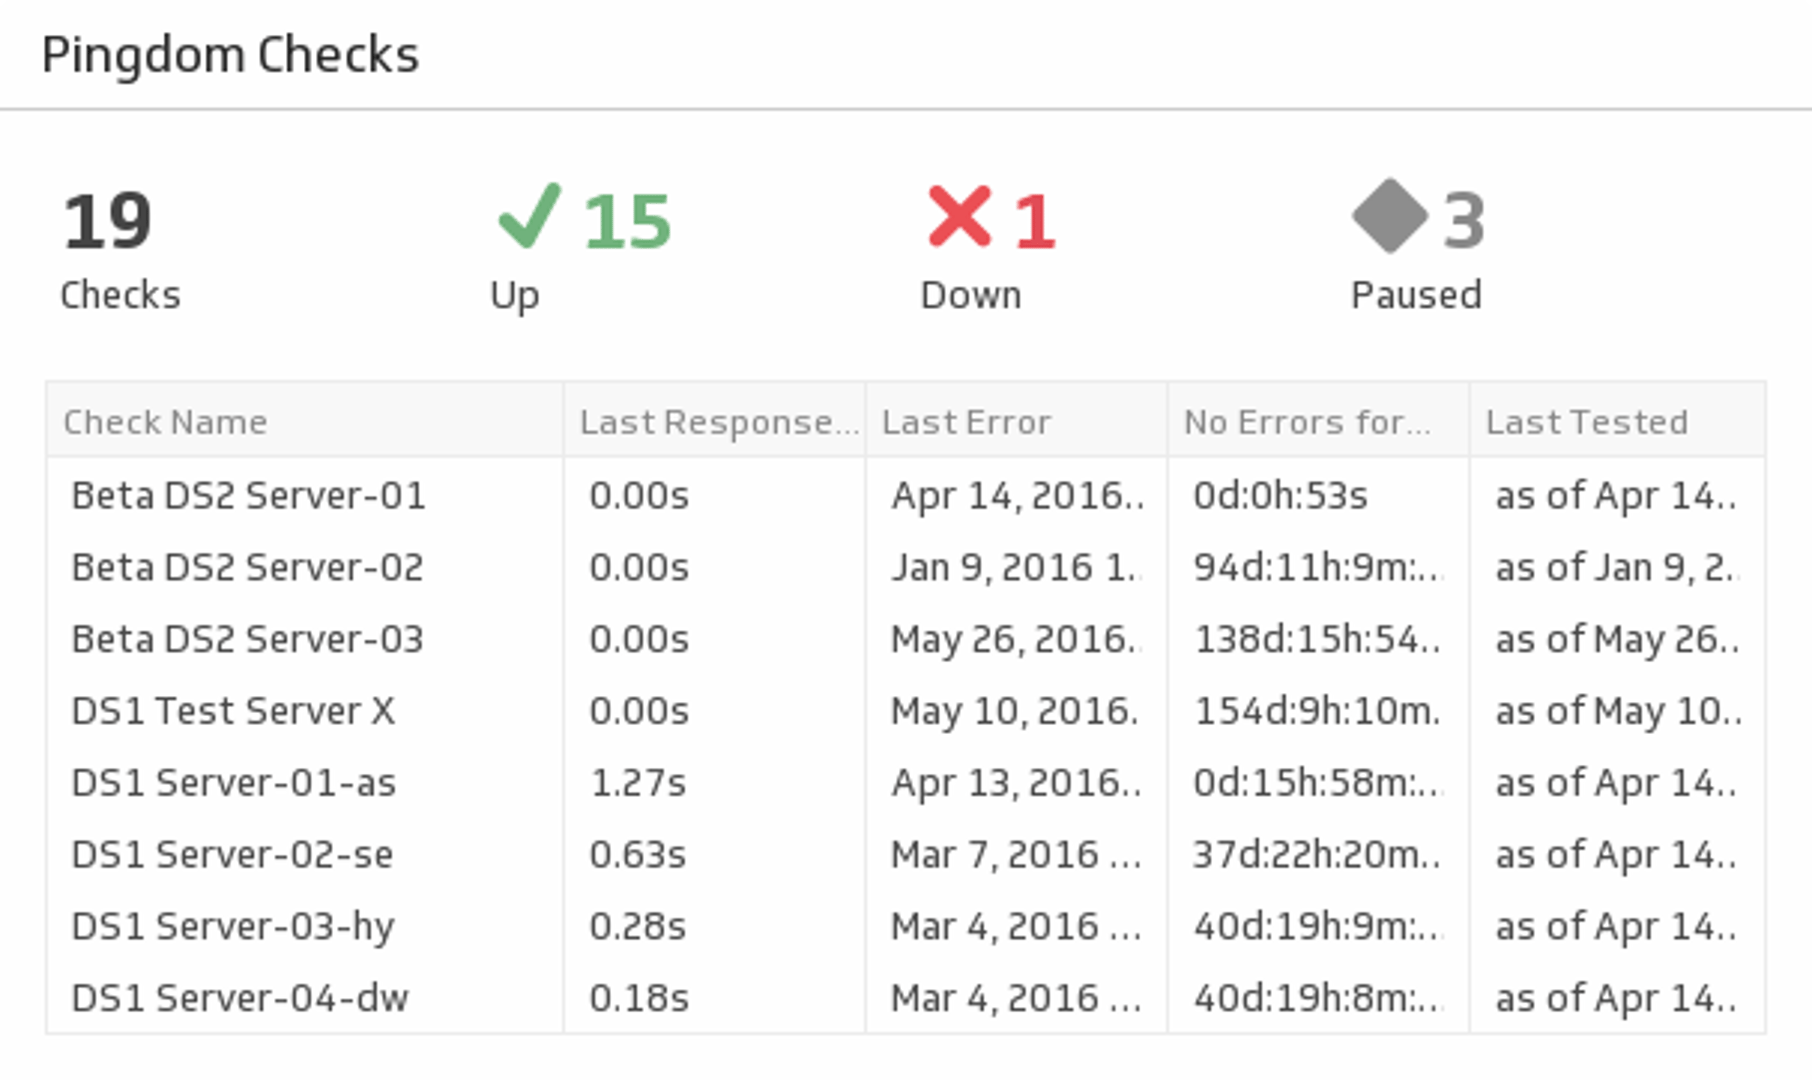
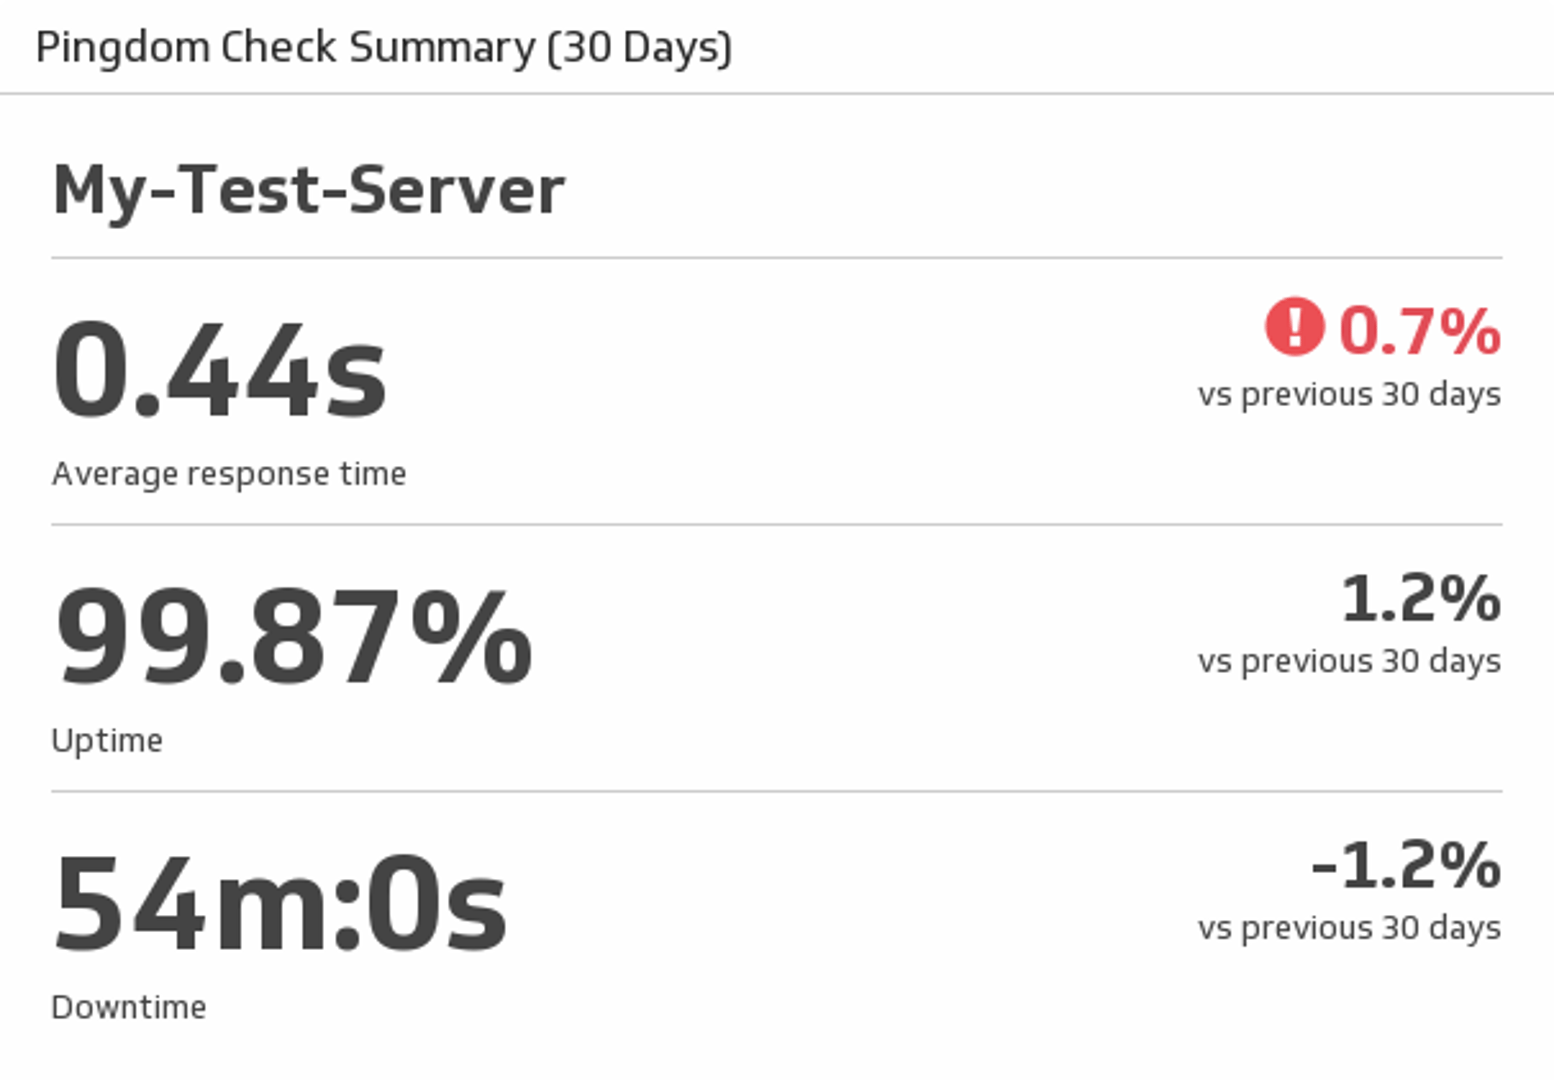
Checks Summary
See stats for your services including statuses, response times and error times.
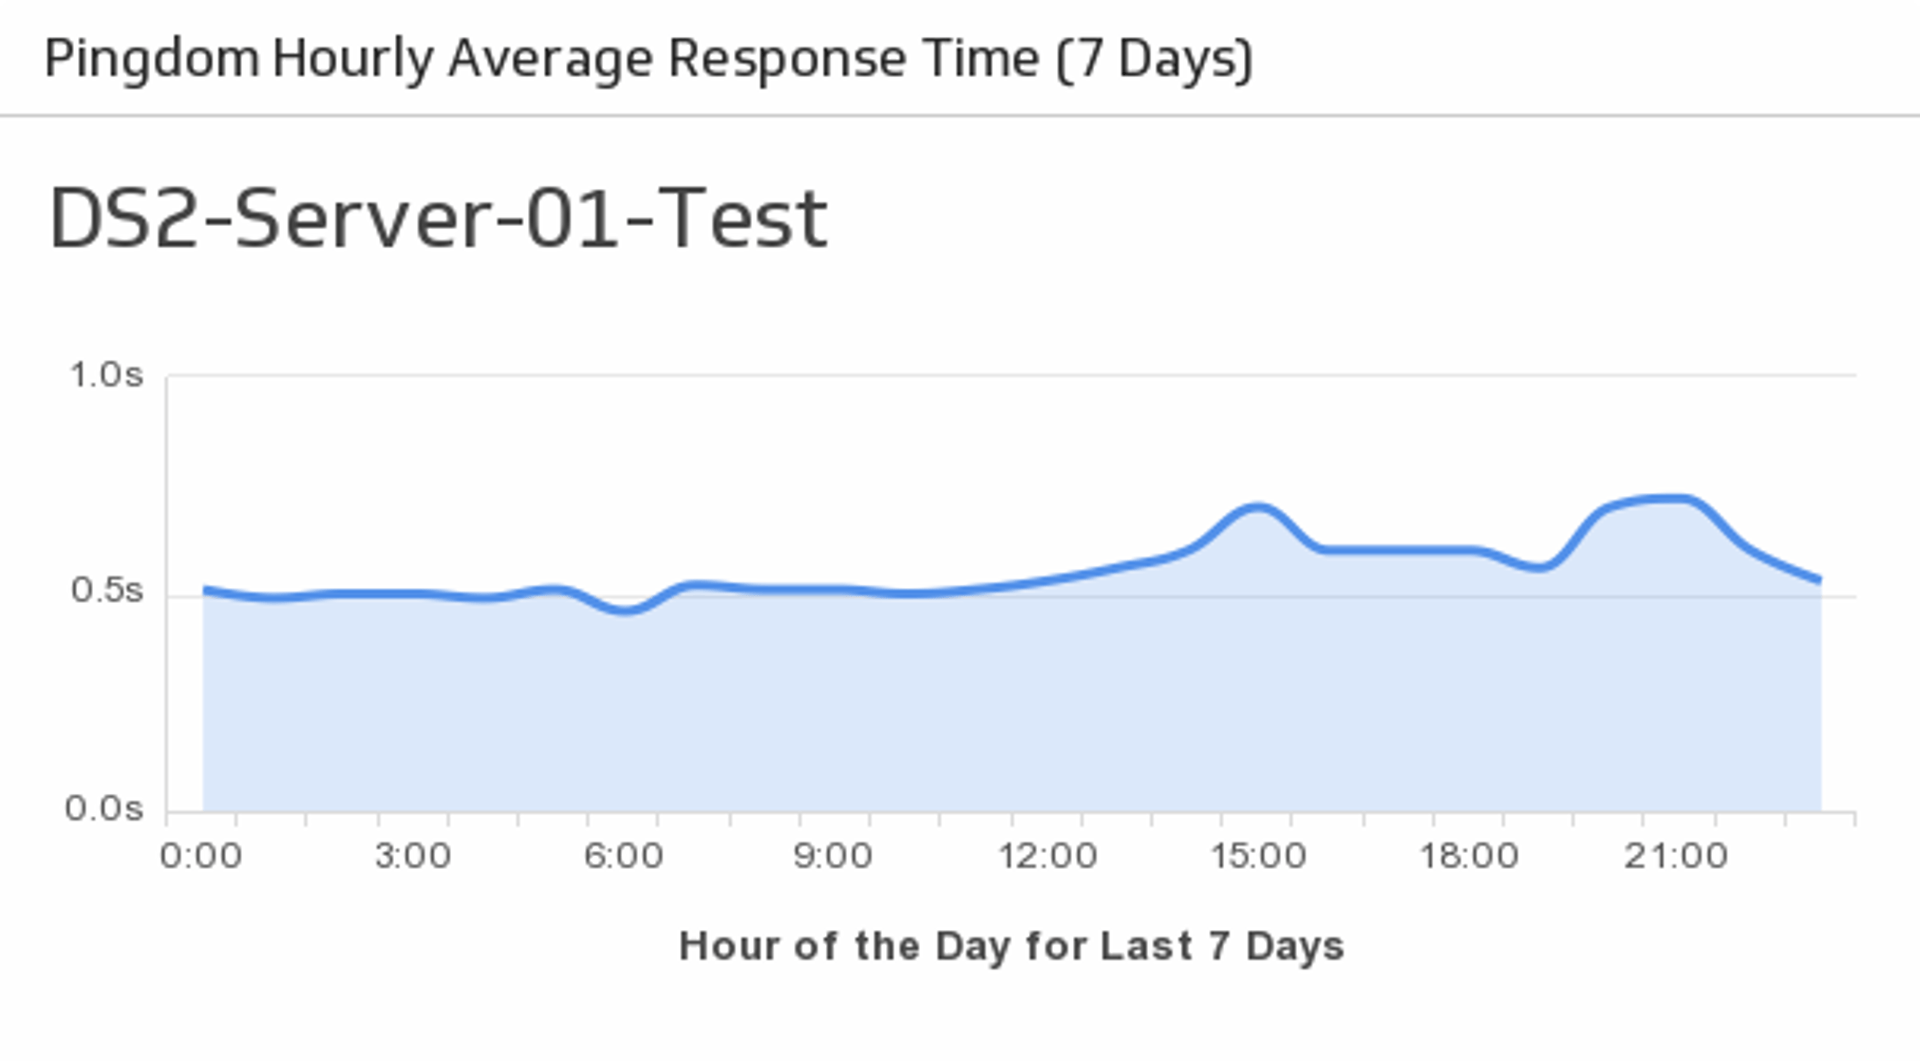
Hourly Average Response Time
Monitor the average response times for your specified server over the past week.
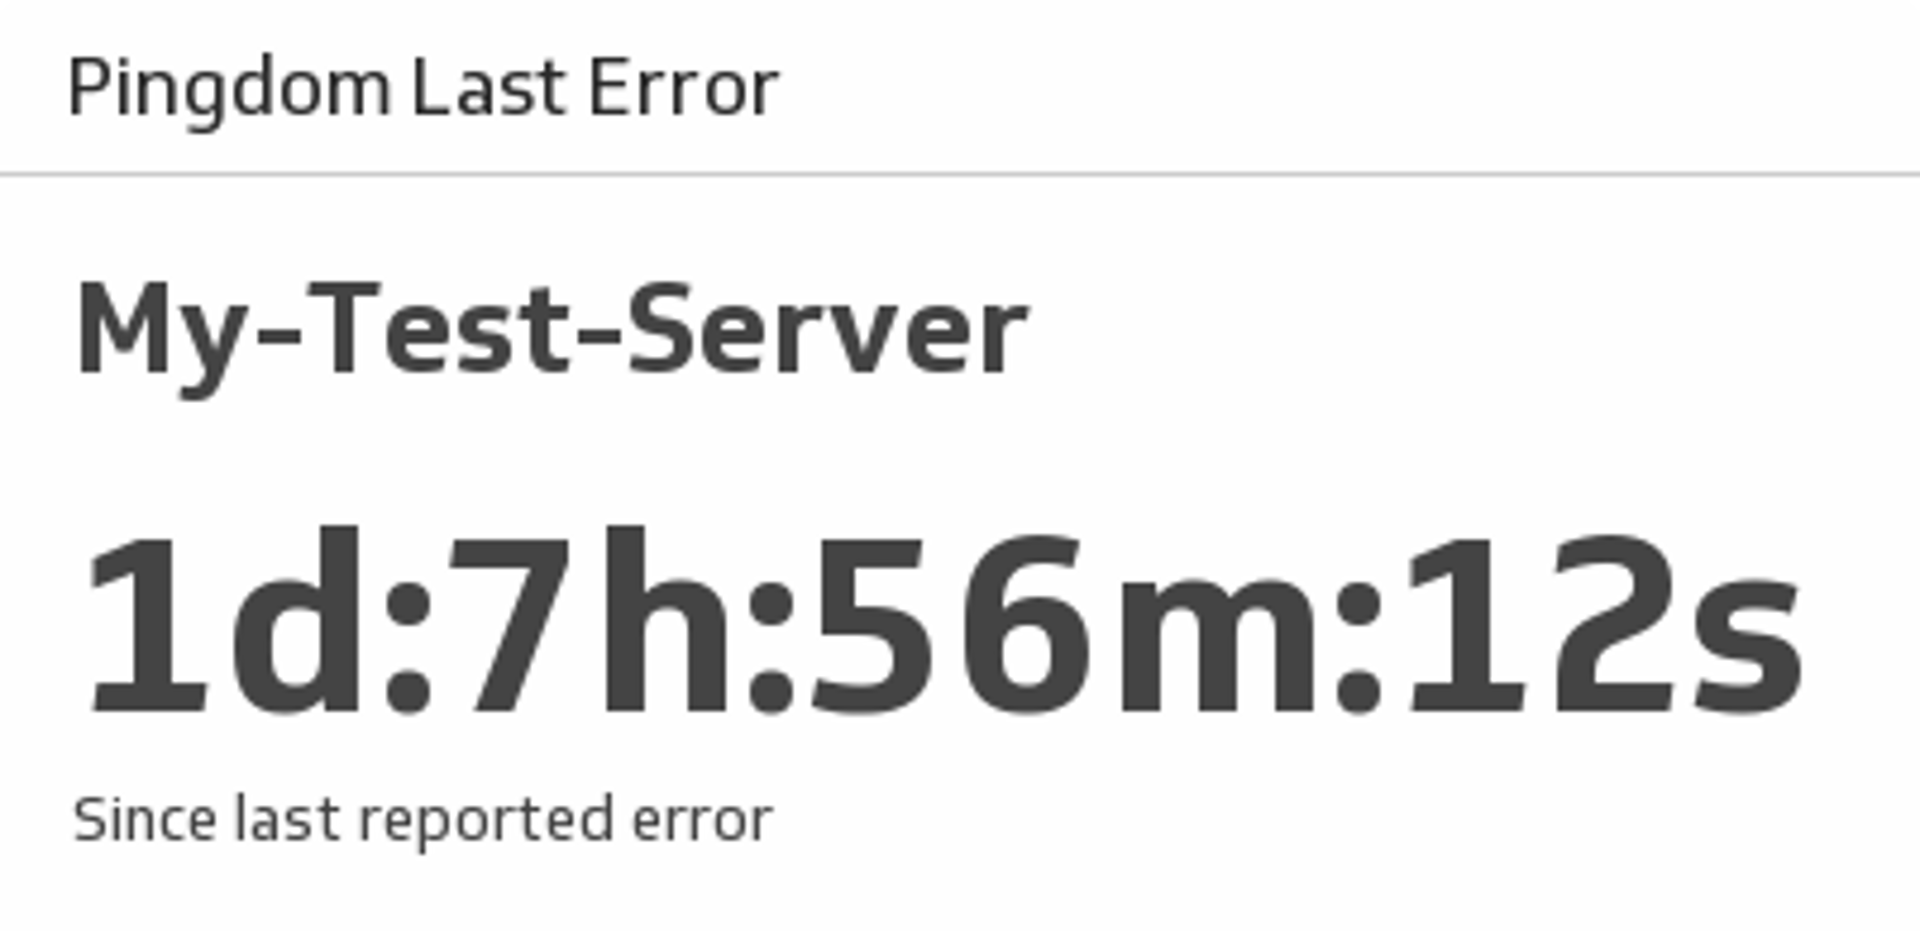
Last Error
See the amount of time that has passed since your last Pingdom error.
Server Overview
See average response time, uptime and downtime for a specified Pingdom server.


Use the Connector Gallery to create a custom Pingdom dashboard
With our Connector Gallery, you can create custom API queries to pull in data from your Pingdom account. Building custom queries allows you to specify the metrics and time periods that you want to track.
You can use custom queries to build out visualizations in Klipfolio. You can also combine your Pingdom data with other relevant data to create your custom dashboard.
Learn more about working with the Pingdom API and how you can start building your own Pingdom queries in Klipfolio.
