Server Overview
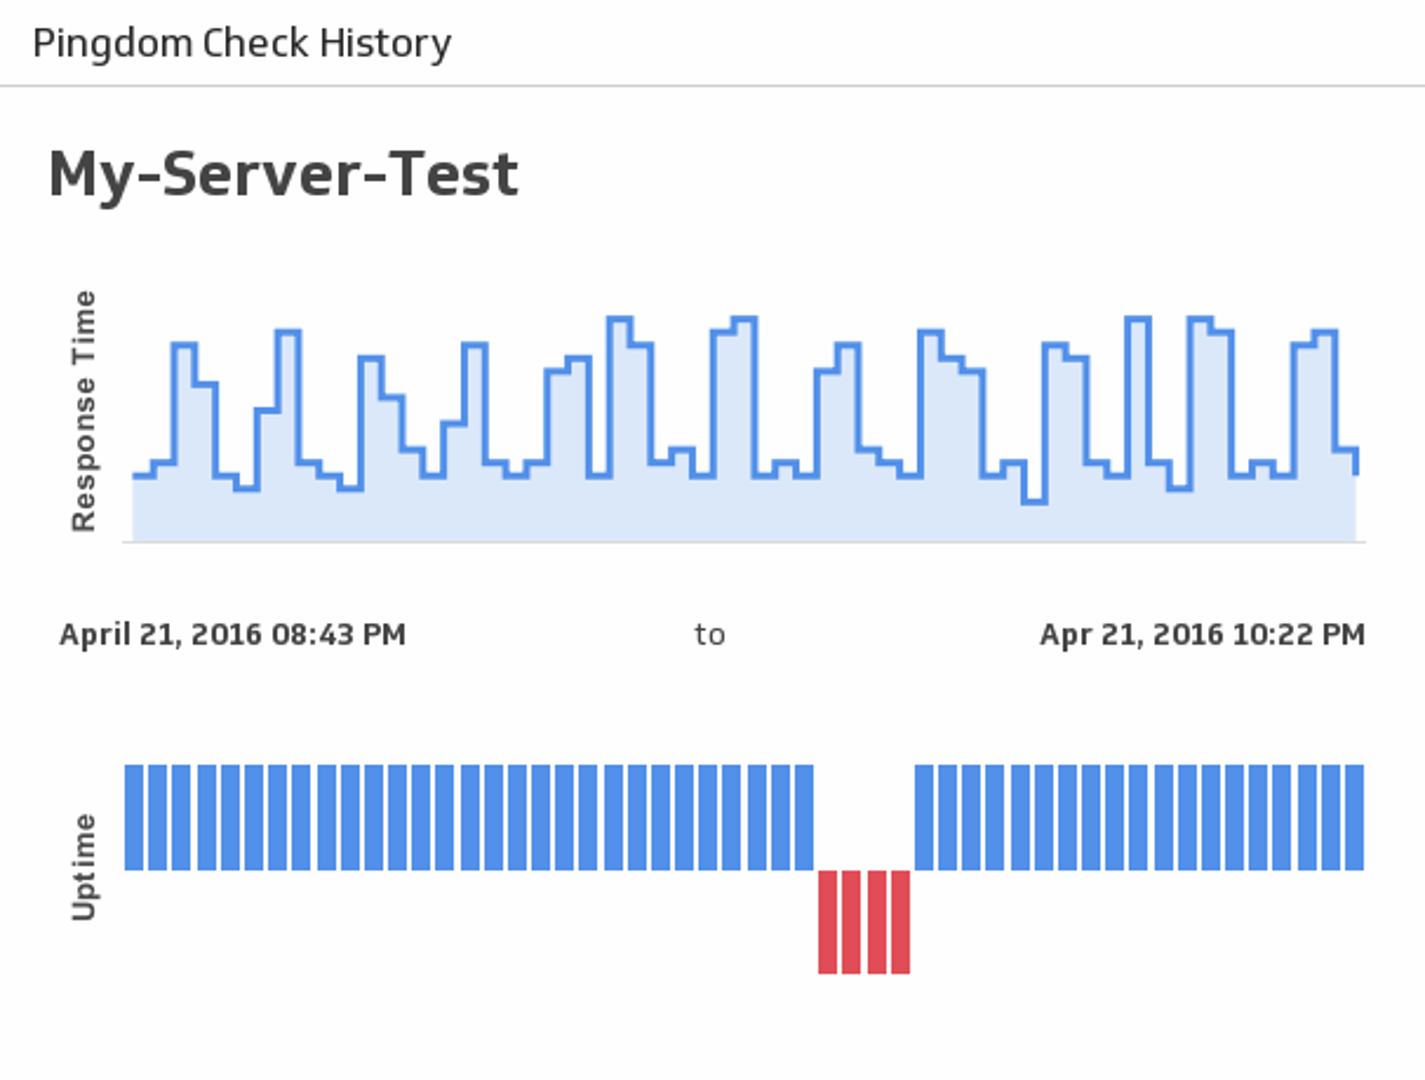
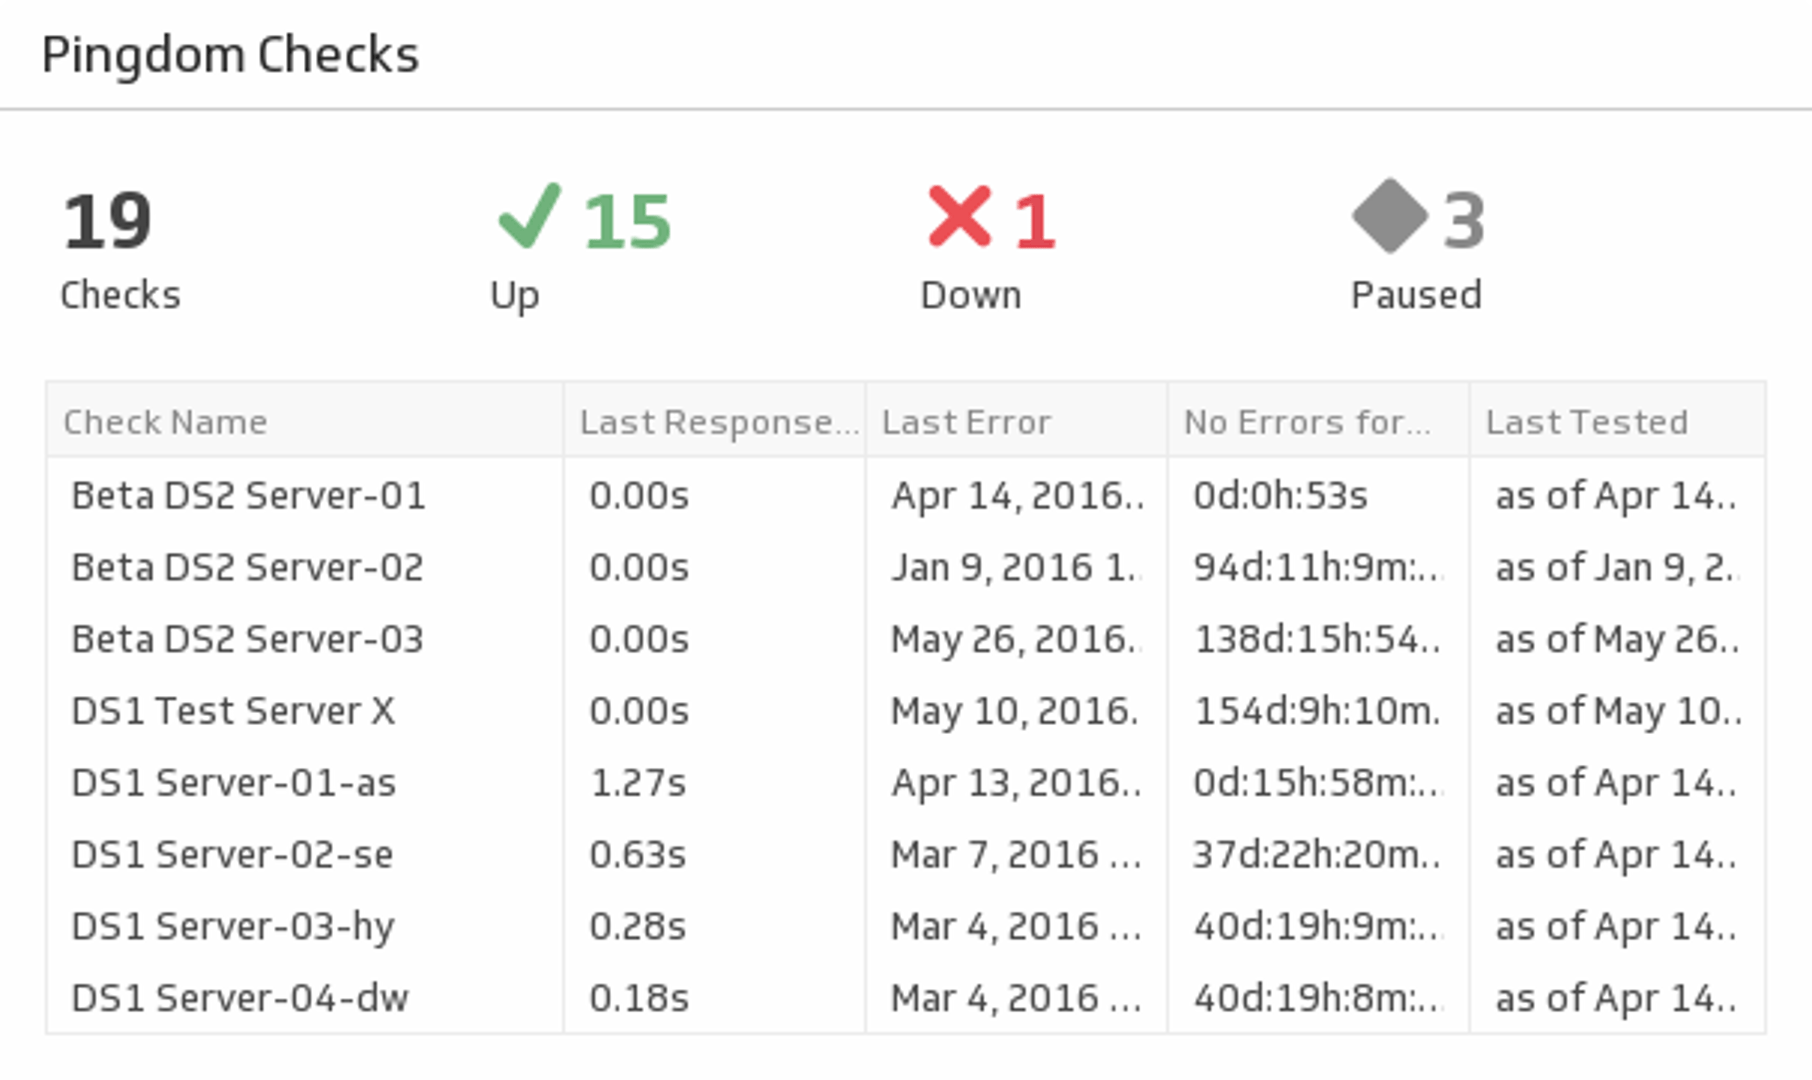
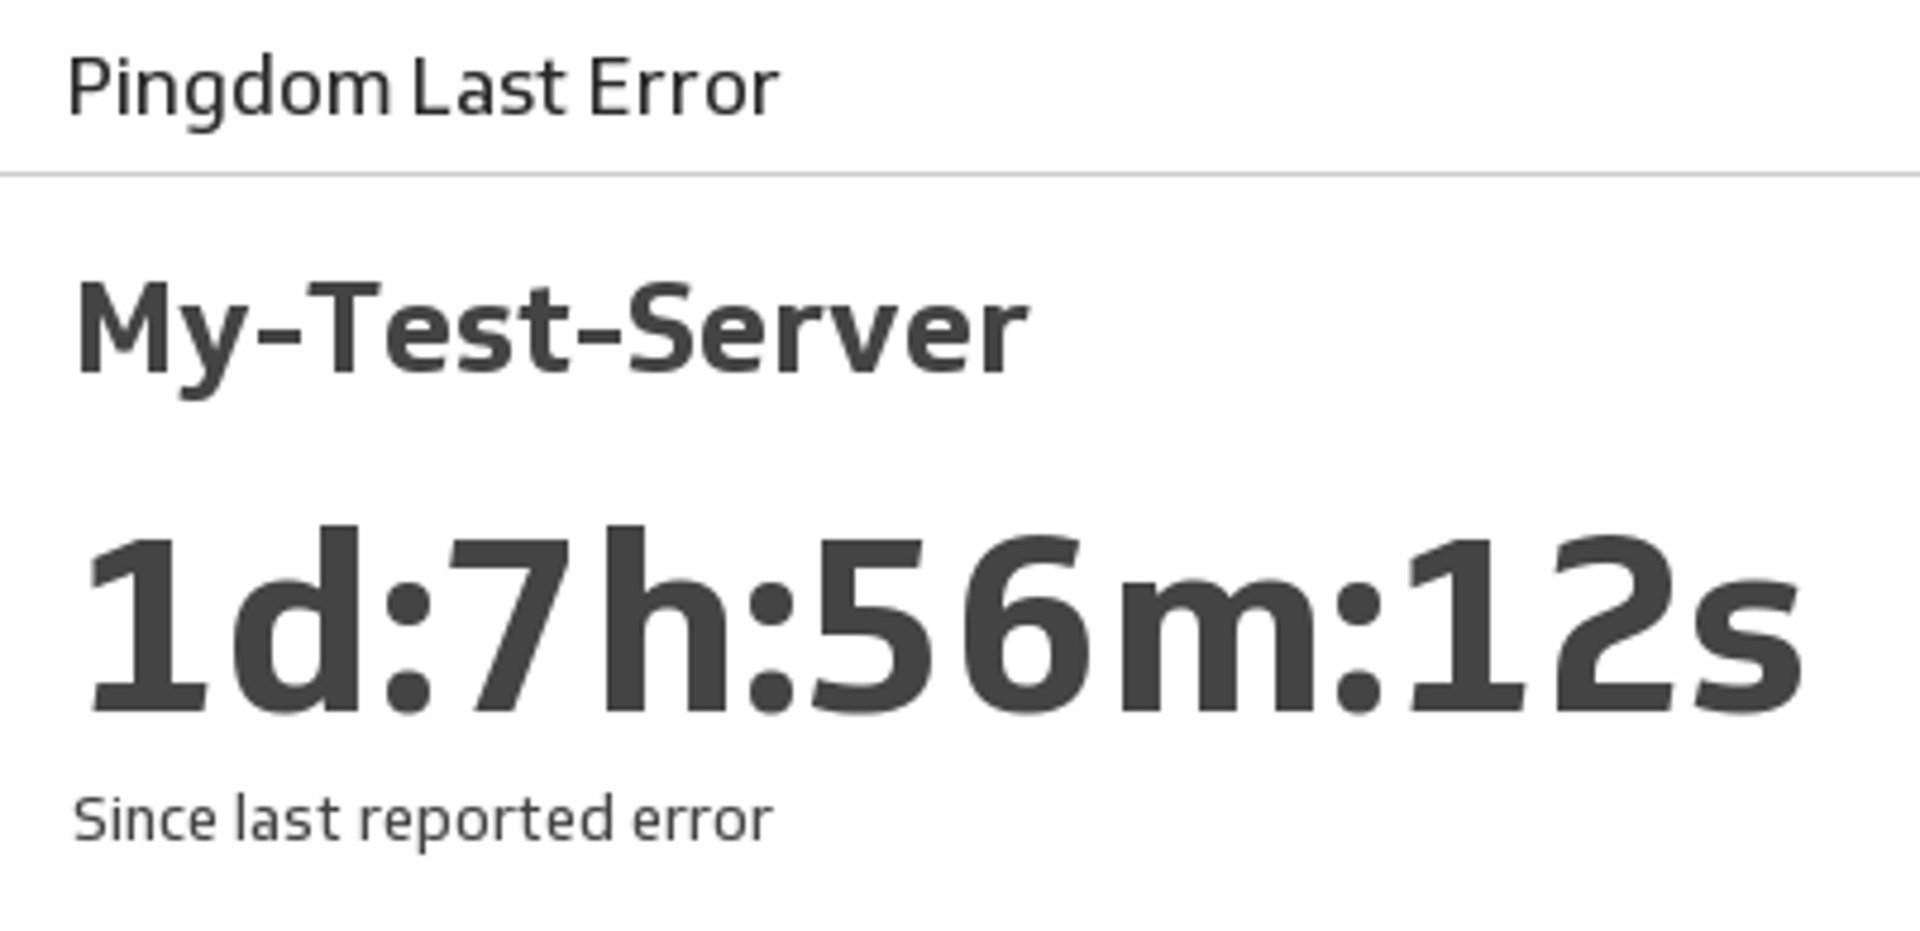
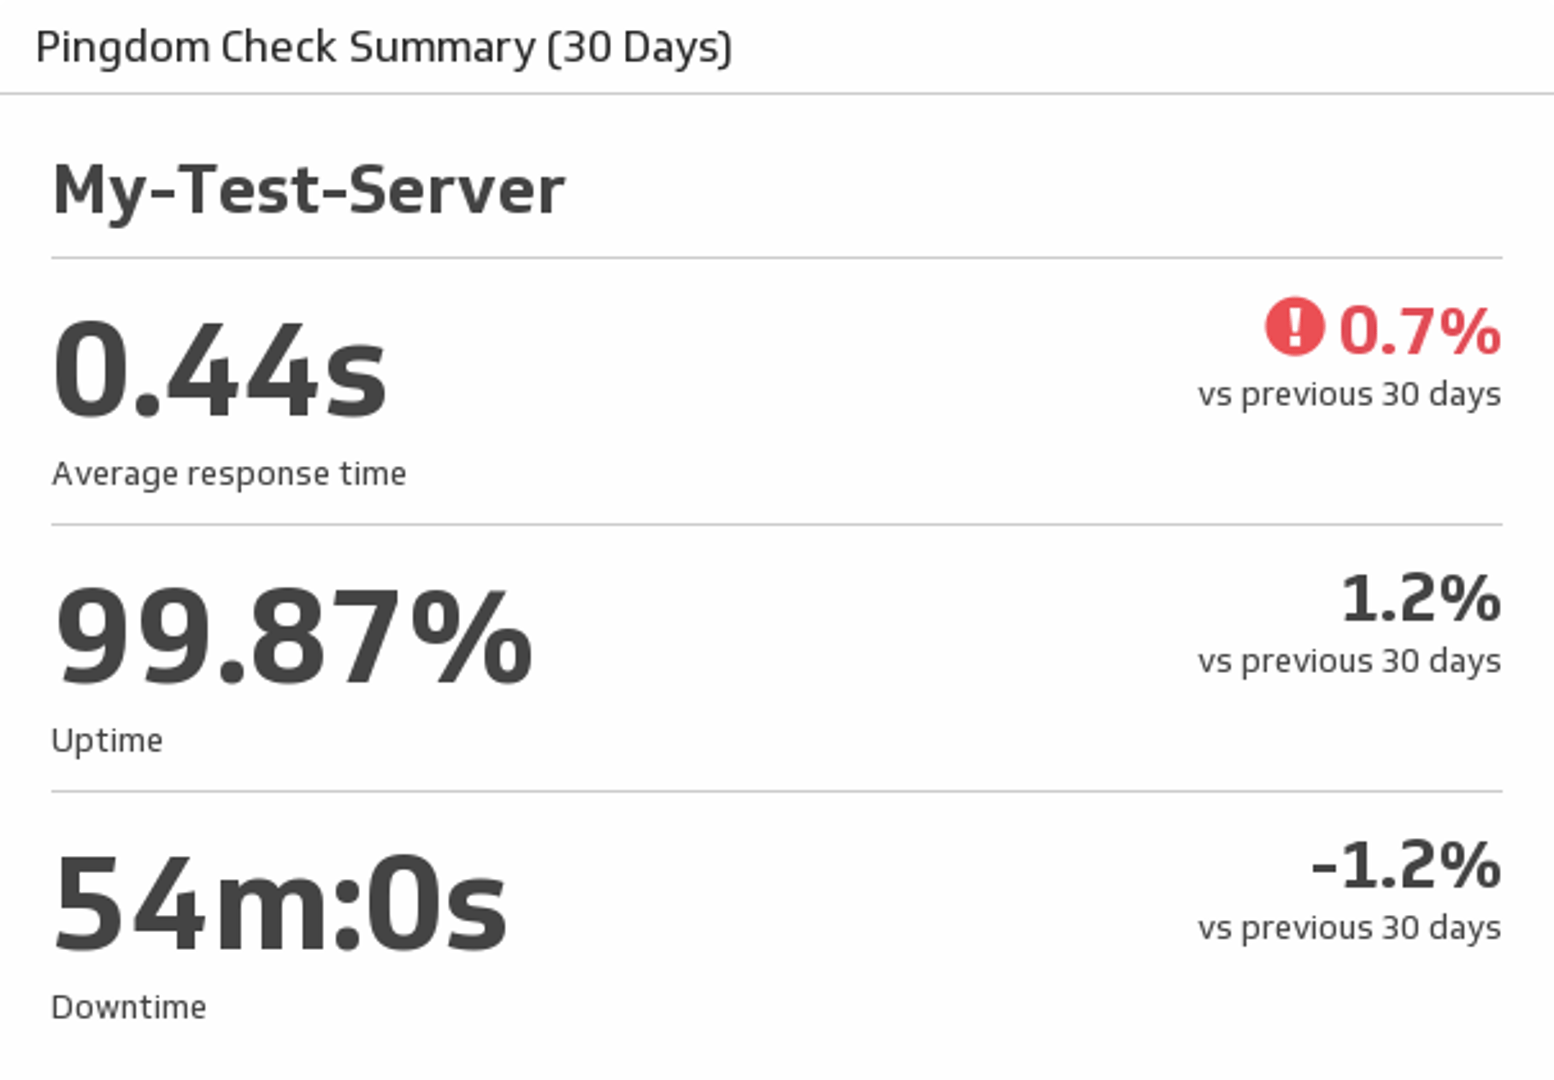
See average response time, uptime and downtime for a specified Pingdom server.
Track all your Pingdom KPIs in one place
Sign up for free and get started with our Server Overview Klip.
Get This Klip +Free for 14 days ● No credit card required
About Pingdom
Connect Pingdom to Klipfolio Klips and display your website uptime, response times, and error data in a live dashboard. Use pre-built Klips or build a custom Pingdom dashboard from scratch.
Related Klips

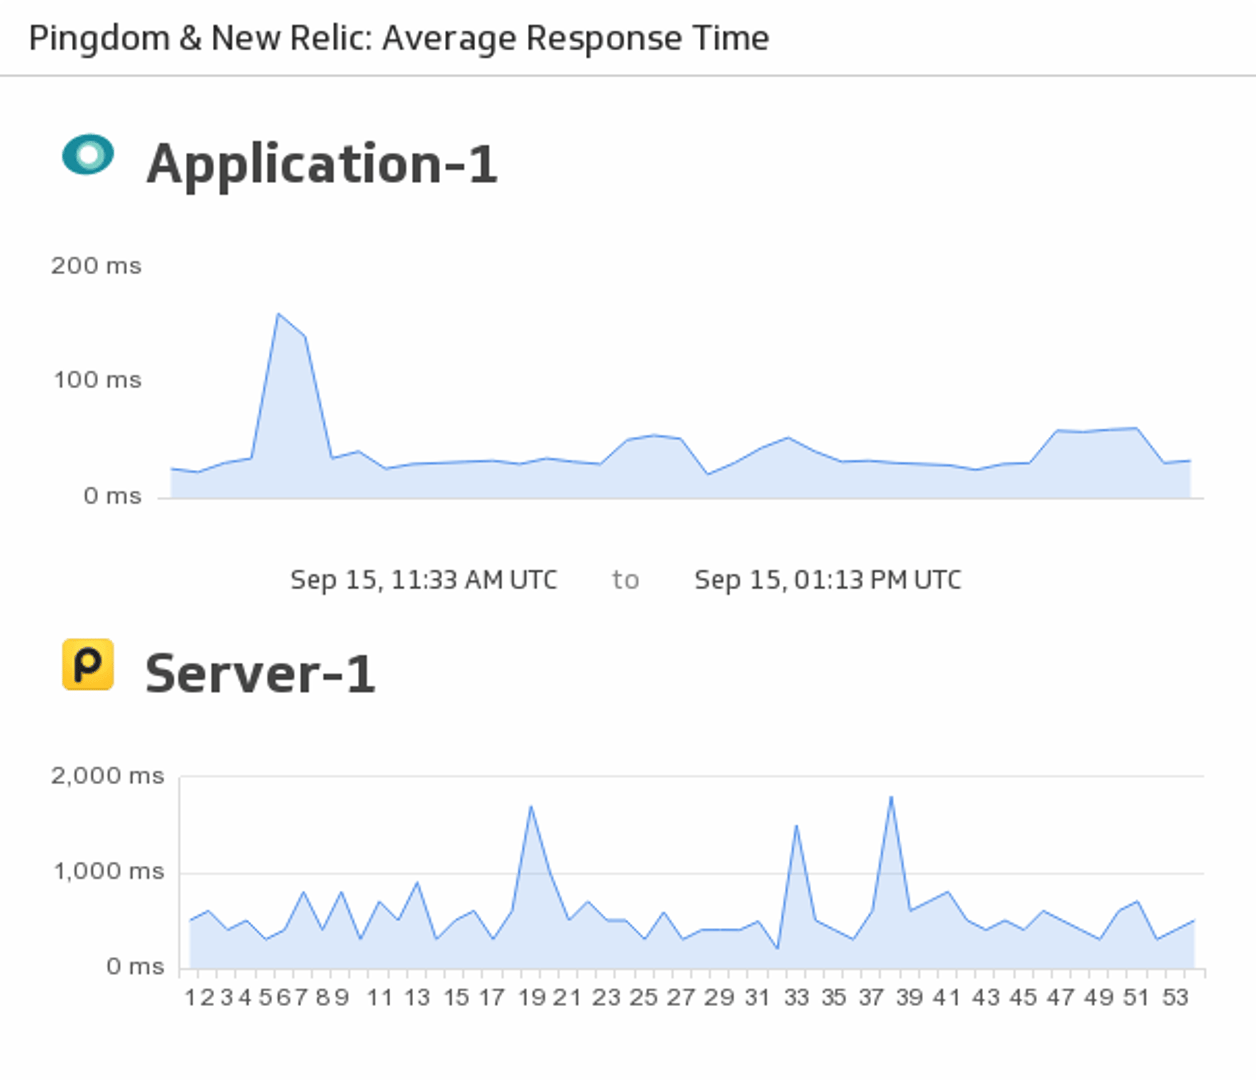
Average Response Time
Make sure to stay on top of your server and application response time by merging your New Relic and Pingdom data to monitor responsiveness in real-time.

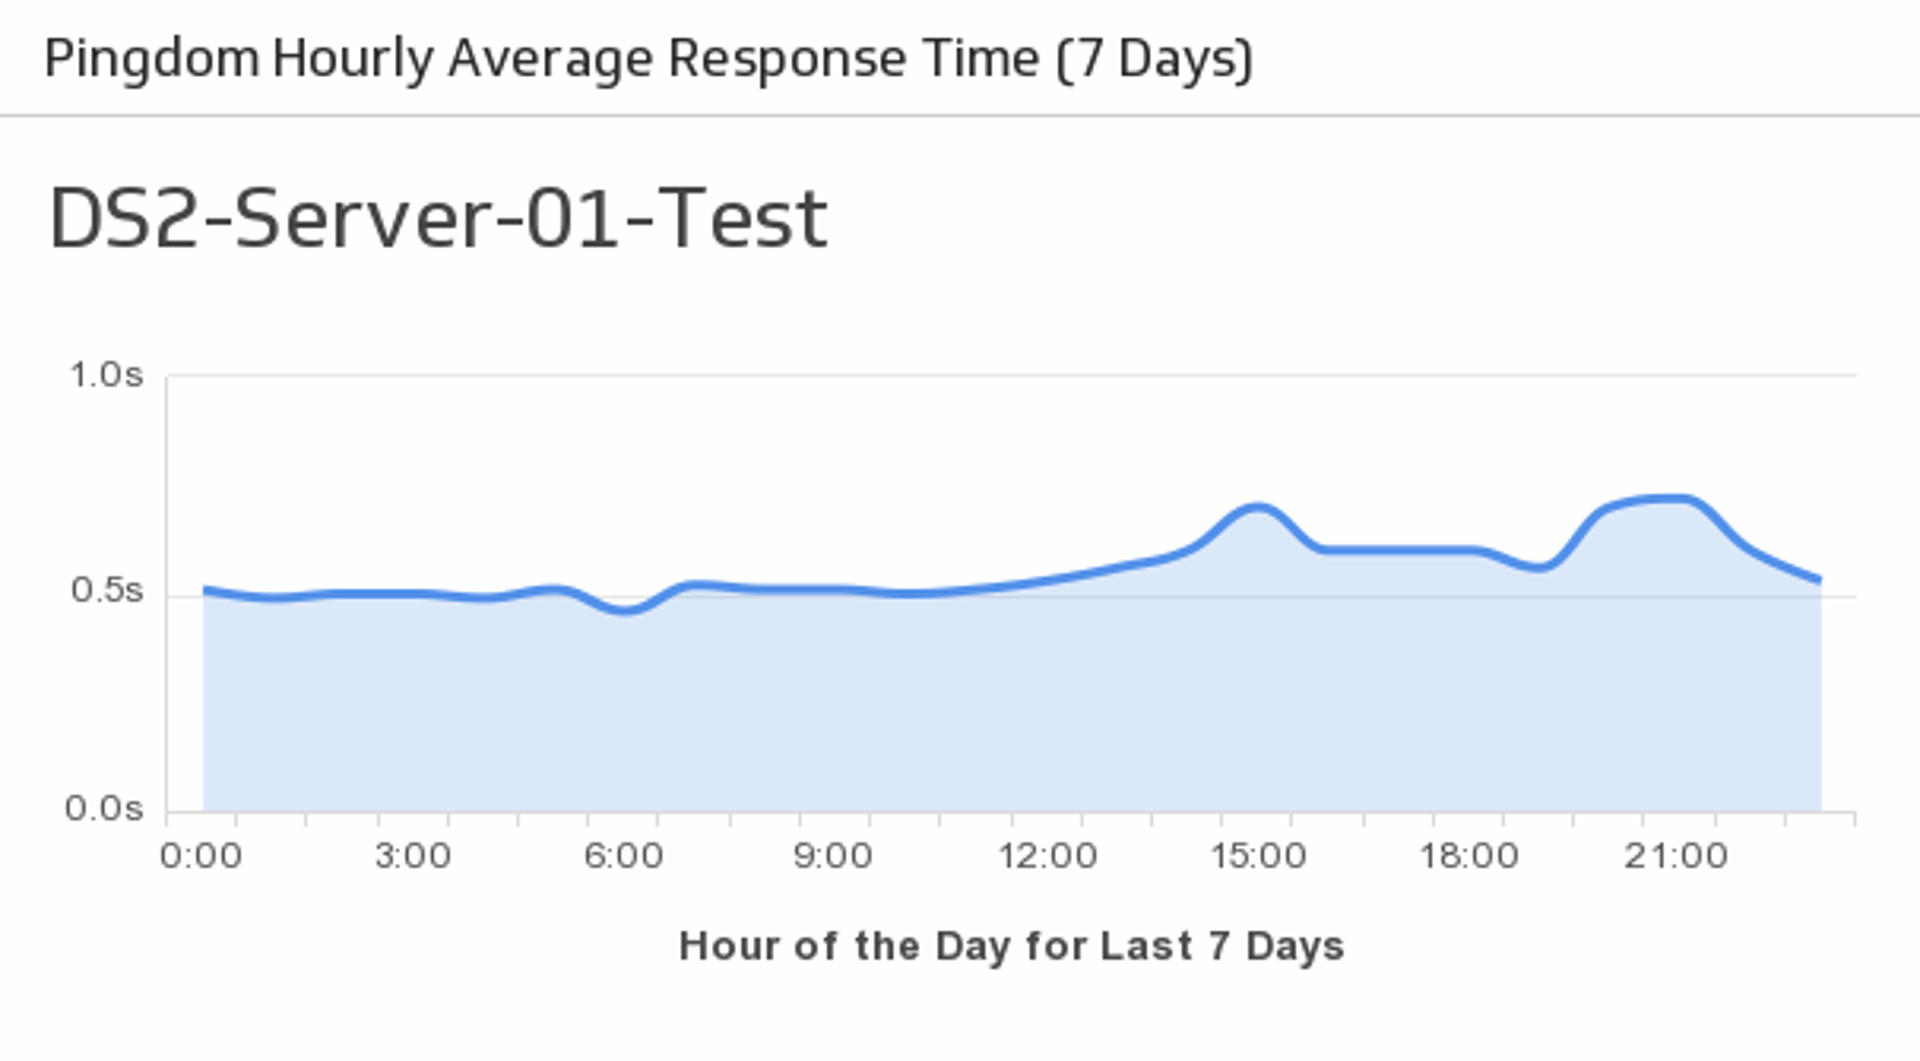
Hourly Average Response Time
Monitor the average response times for your specified server over the past week.

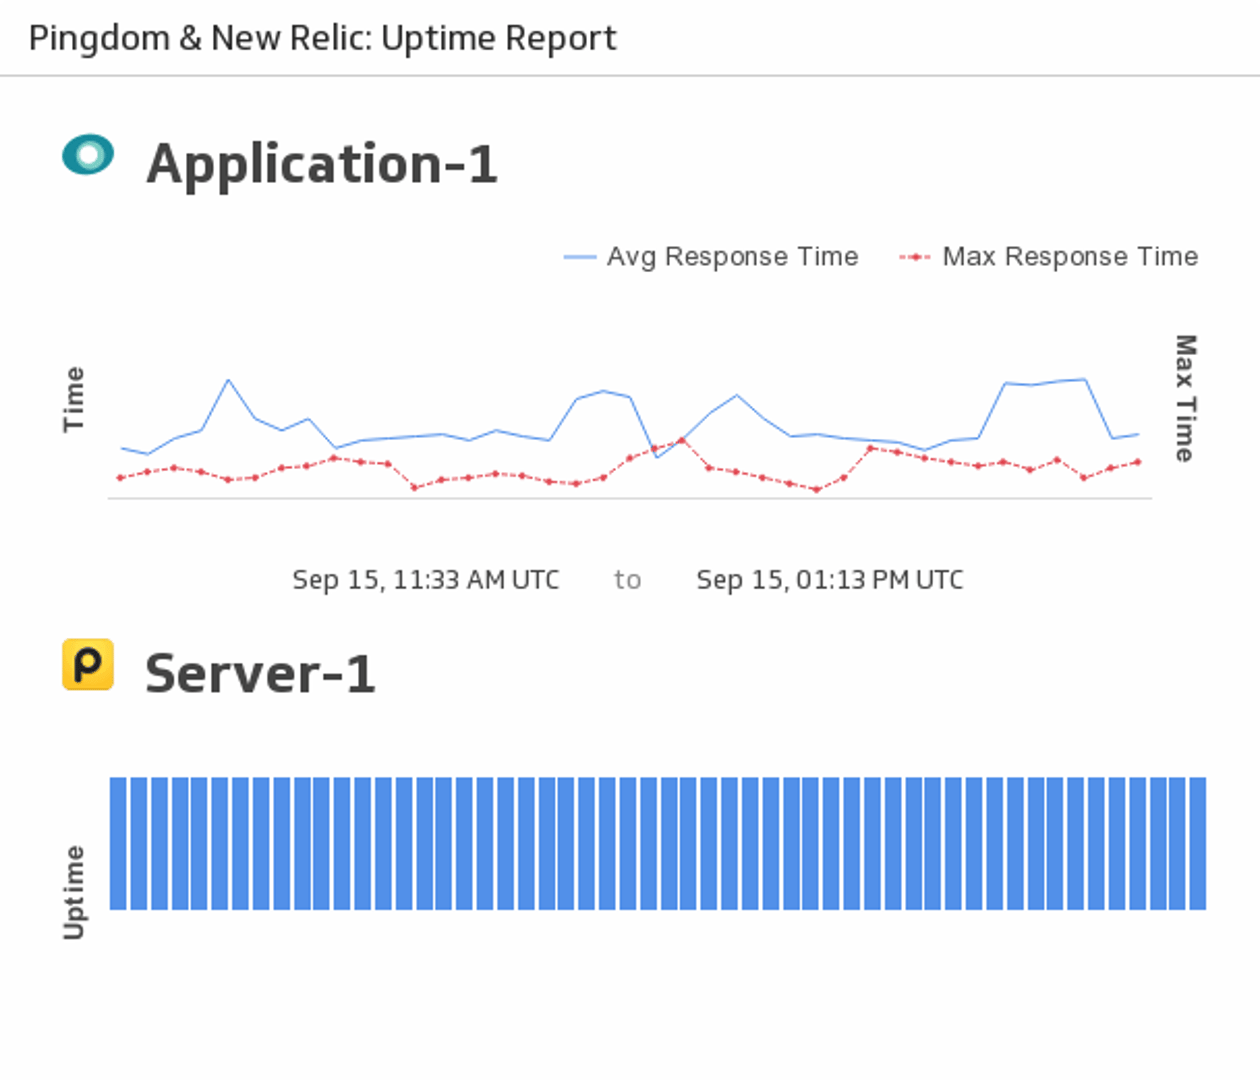
Uptime Report
Monitor the uptime of your chosen server using New Relic and Pingdom.