Shopify
Shopify is an ecommerce platform that lets you run an online store, manage inventory, track orders, and monitor sales trends. Connect Shopify to Klipfolio to build real-time dashboards that pull live store data — orders, products, customers, and revenue — without manual exports.
Tracking Shopify data across orders, inventory, and customers gets messy fast when you're jumping between reports. Connect Shopify to Klipfolio and pull everything into a single, real-time dashboard.
How to connect Shopify to Klipfolio
Klipfolio connects to Shopify via OAuth. Setup takes about four steps.
- In the left navigation sidebar, click the 3-dot menu beside Data Sources and select + New data source.
- On the Where is your data? page, select Shopify, enter your Shop Name, and click Continue.
- Click Connect an account, sign in with your Shopify credentials, and authorize Klipfolio to access your store data.
- On the Configure your connection page, modify the base URL to target the specific data you need — orders, products, customers, or shop info — then click Get data.
Once your data source is saved, it's available in your Data Source Library and ready to power custom Klips.
View the step-by-step setup guide
Build a Shopify dashboard
There are two ways to build a Shopify dashboard in Klipfolio:
Klip Gallery: Start with pre-built Shopify Klips for common metrics like orders, revenue, and inventory. Customize to match your store's needs.
Custom build: Use the Shopify API to query exactly the data you want. Klipfolio supports JSON responses, pagination, and data modelling so you can shape the data before it hits your dashboard.
Top reasons to use Klipfolio for Shopify dashboards
Real-time store visibility: Your dashboard refreshes automatically — from every minute to every 24 hours — so you're always looking at current order and inventory data, not yesterday's export.
All your metrics in one place: Combine Shopify data with other sources like Google Analytics 4, Stripe, or your ad platforms. See the full picture of your store's performance without switching tabs.
Dashboards built your way: Use Excel-like formulas and flexible layouts to calculate custom metrics — average order value, return rate, revenue by product — and display them exactly how your team needs to see them.
Share with anyone: Distribute dashboards via TV mode, public links, scheduled PDF emails, or embedded views. Keep your whole team aligned without giving everyone direct Shopify access.
No manual exports: Stop downloading CSVs and pasting data into spreadsheets. Klipfolio pulls from the Shopify API on a schedule you control.
What Klipfolio adds to your Shopify workflow
| What you do in Shopify | What Klipfolio adds |
|---|---|
| Export orders as CSV to review trends | Automated dashboards that update in real time |
| Check individual reports in the Shopify admin | One view combining orders, products, and customers |
| Share screenshots or static slides with your team | Live dashboards accessible via link, TV, or email |
| Manually calculate metrics like AOV or return rate | Custom Klips built with Excel-like formulas |
Stop exporting data manually. Start monitoring your Shopify store in real time with a dashboard that updates itself.
Use pre-built Shopify metrics
Assemble a Shopify dashboard by selecting pre-built metrics from the Klip Gallery.
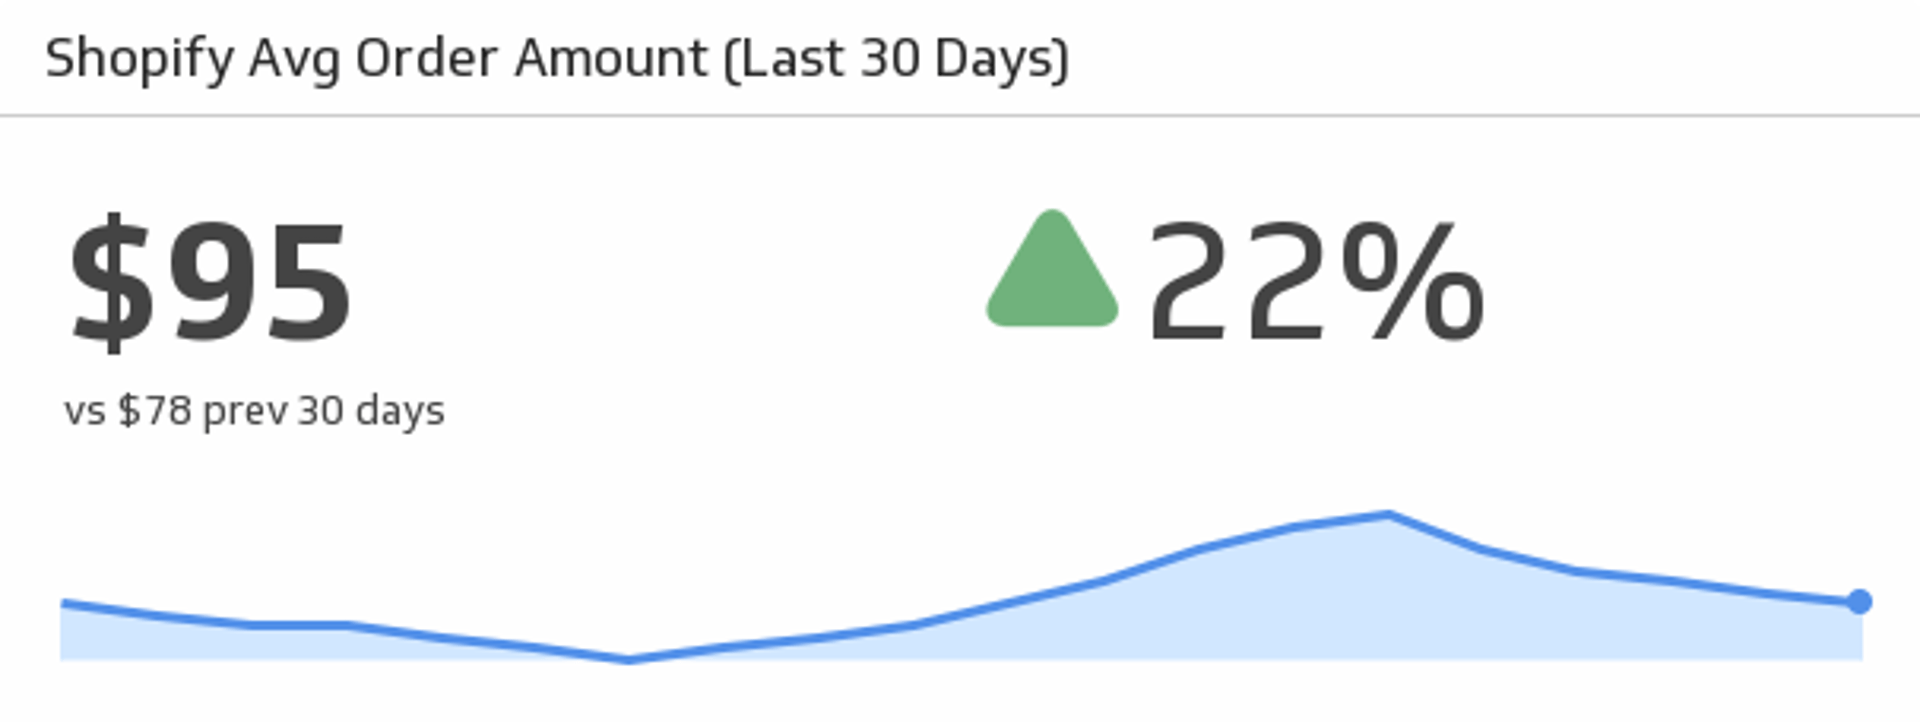
Average Order Amount (Last 30 days)
See the trend, track, and compare your average orders over the past 30 days.
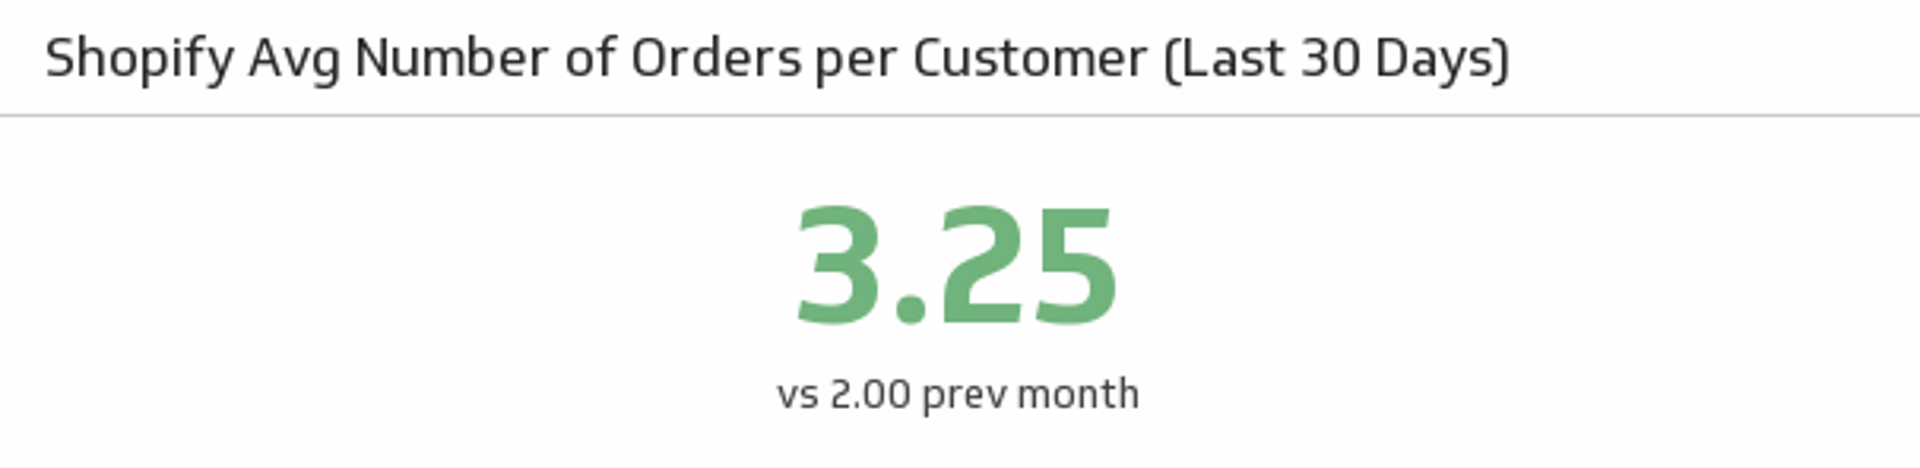
UsesAvg Number of Orders per Customer
See the average number of orders your customers have made over the past 30 days and compare it to the previous month.
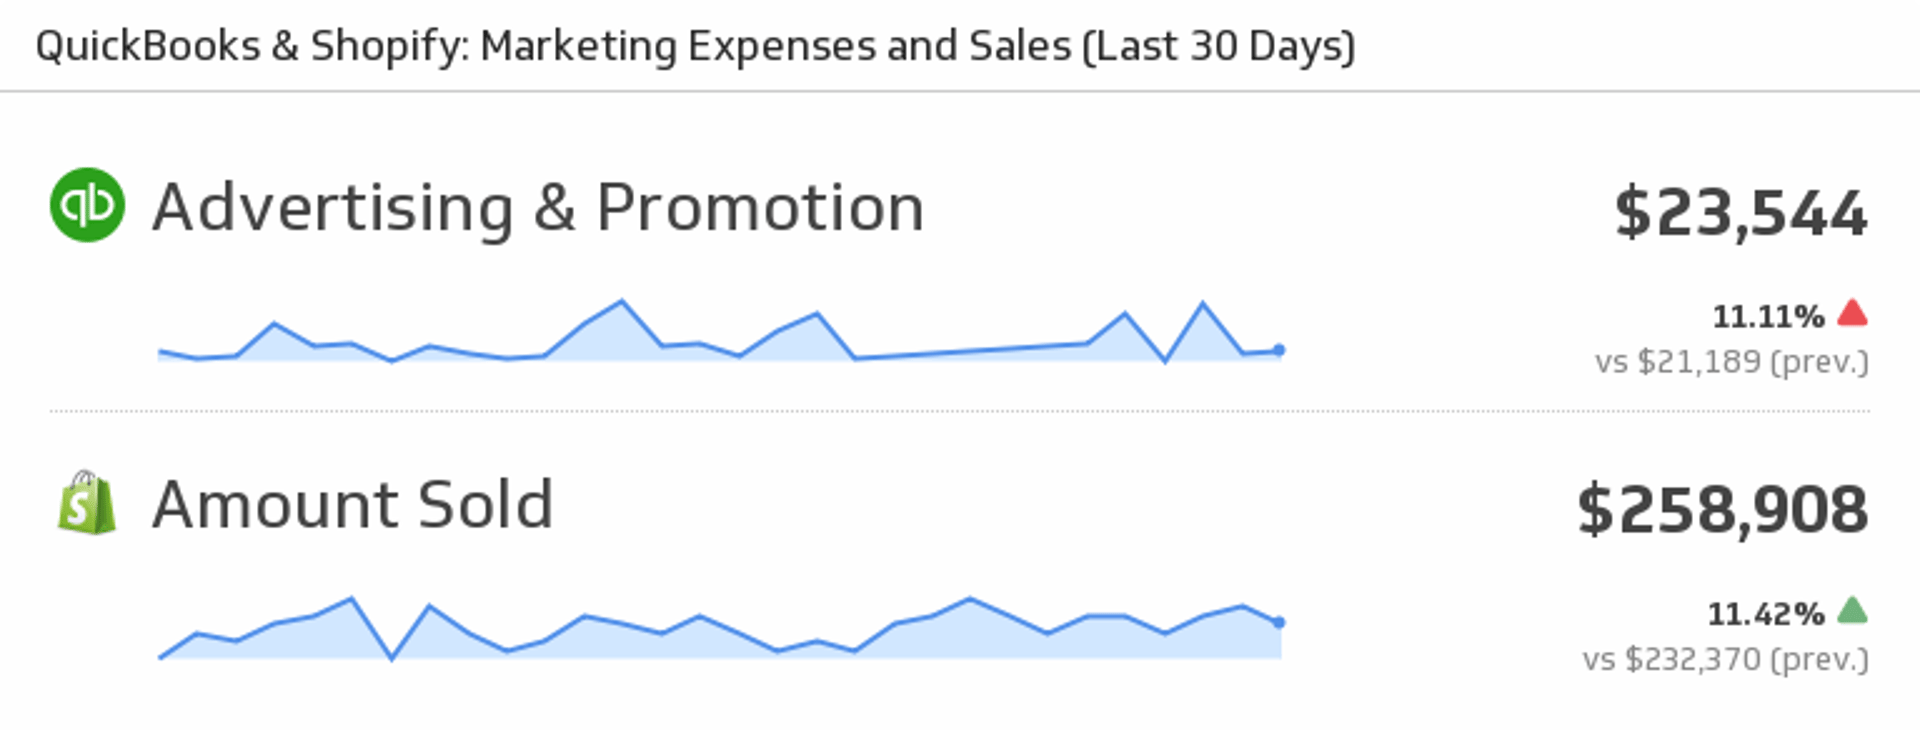
UsesMarketing Expenses and Sales
Mash up your QuickBooks and Shopify data to see your Marketing Expenses and Sales for the last 30 days.
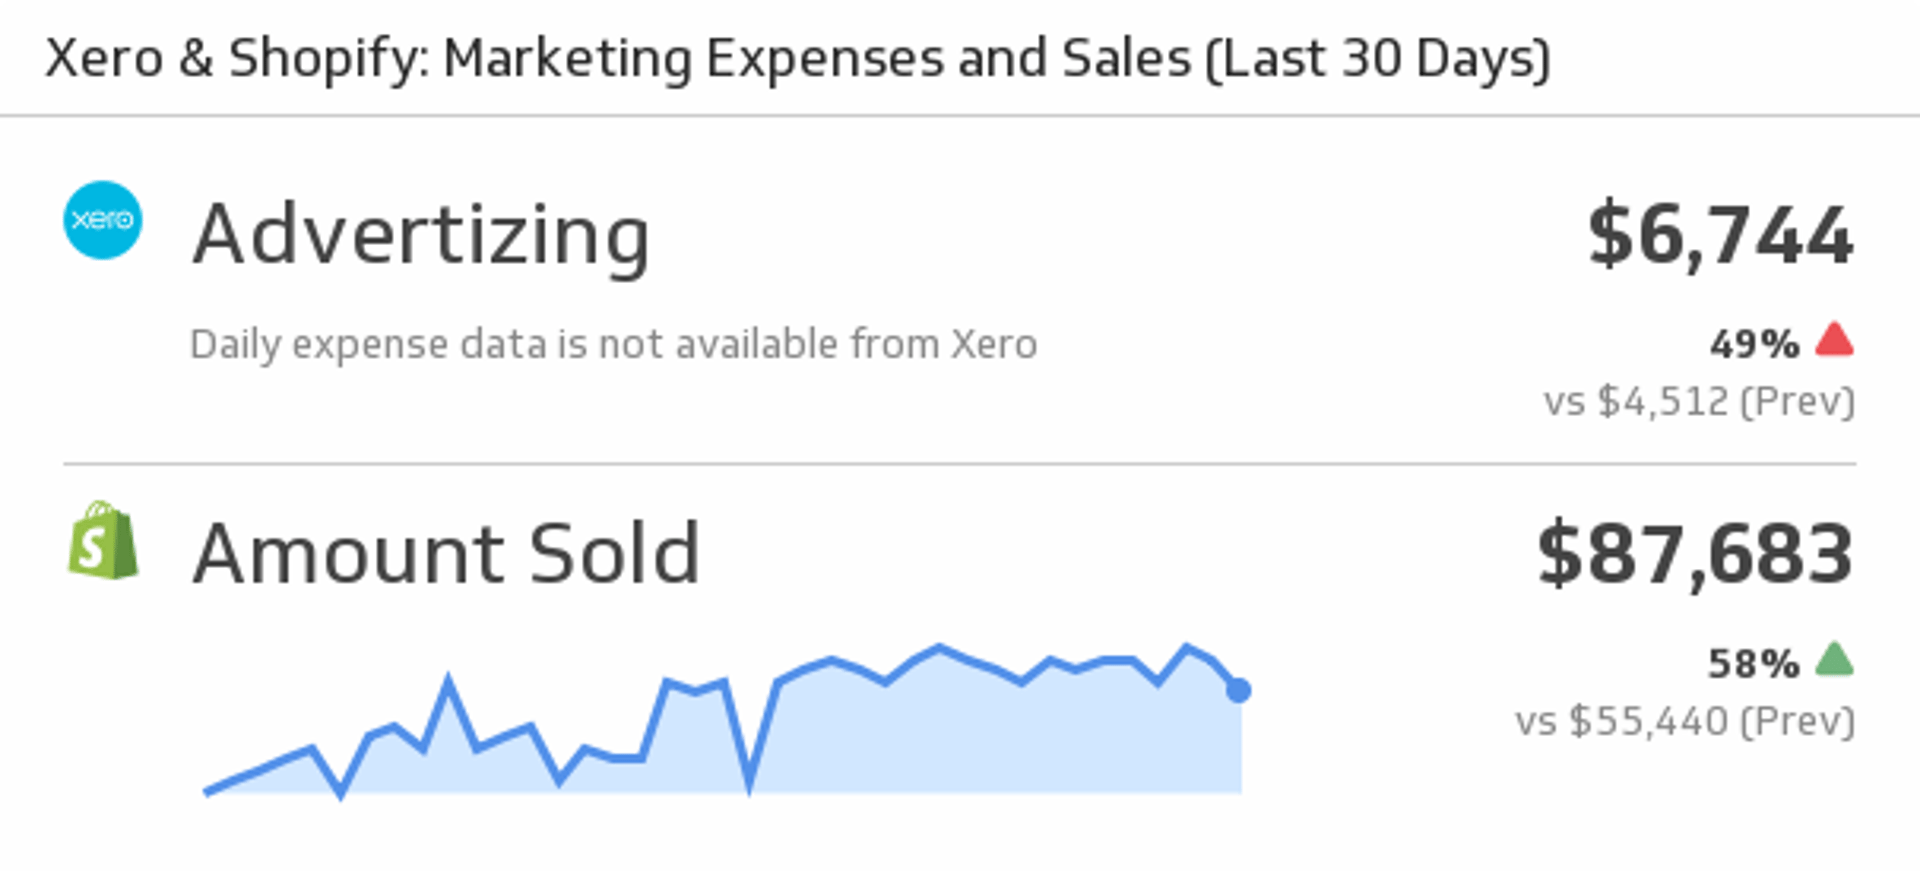
UsesMarketing Expenses and Sales
Mash up your Xero and Shopify data by displaying Xero marketing expenses and Shopify Sales.
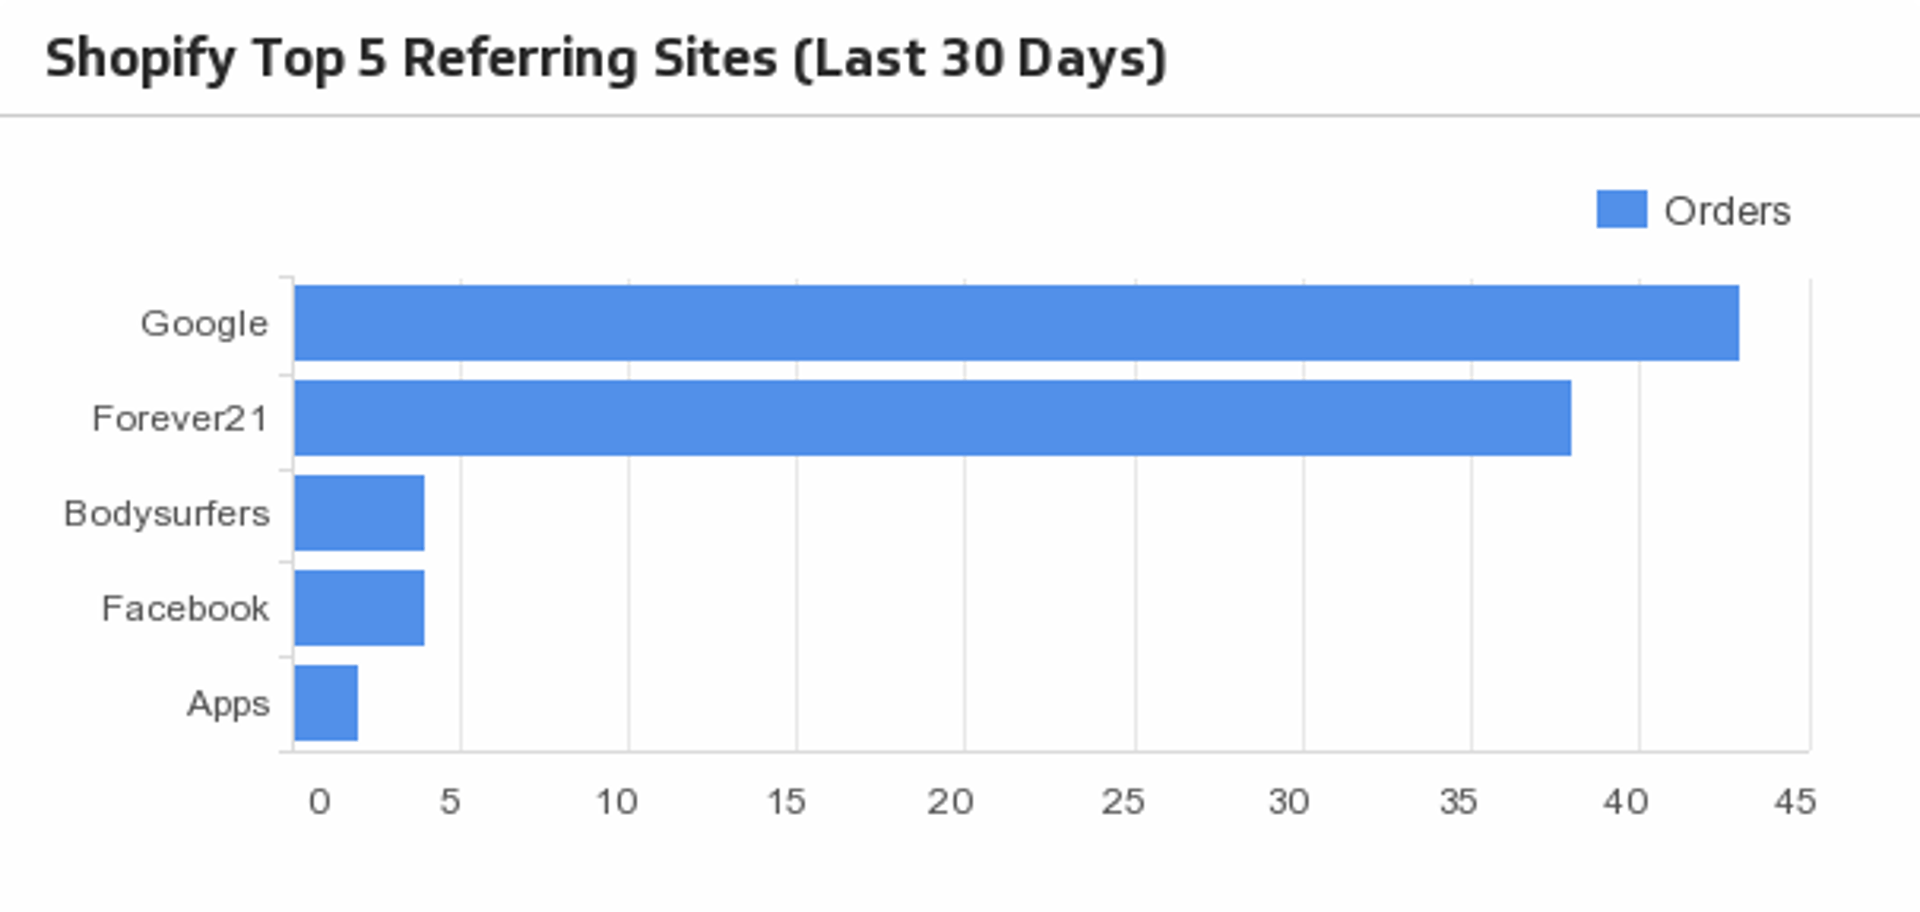
UsesTop 5 Referring Sites (Last 30 days)
Monitor what sites are sending customers to your online shop, and their order count once on your site!
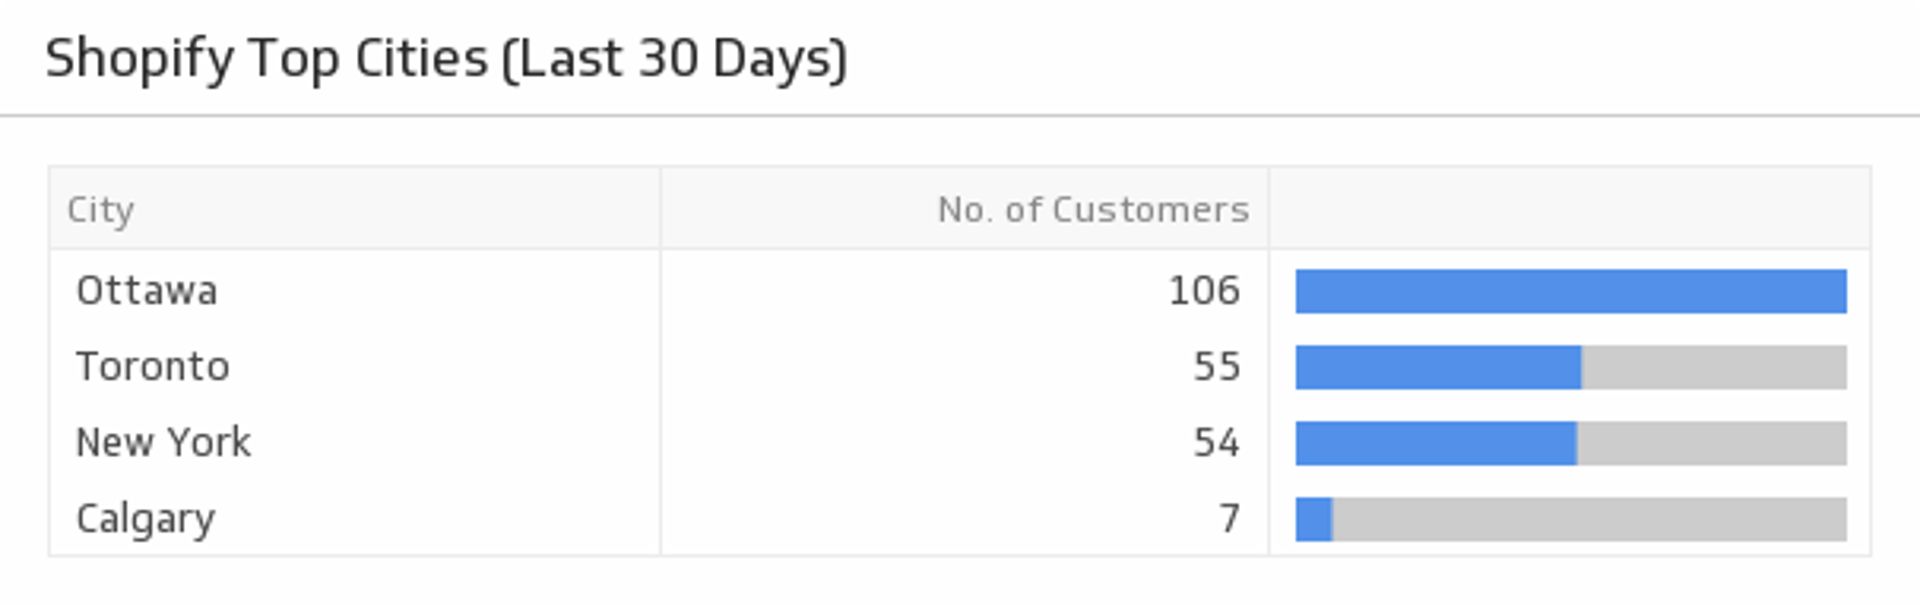
UsesTop Cities (Last 30 days)
See which cities the majority of your customers live in.
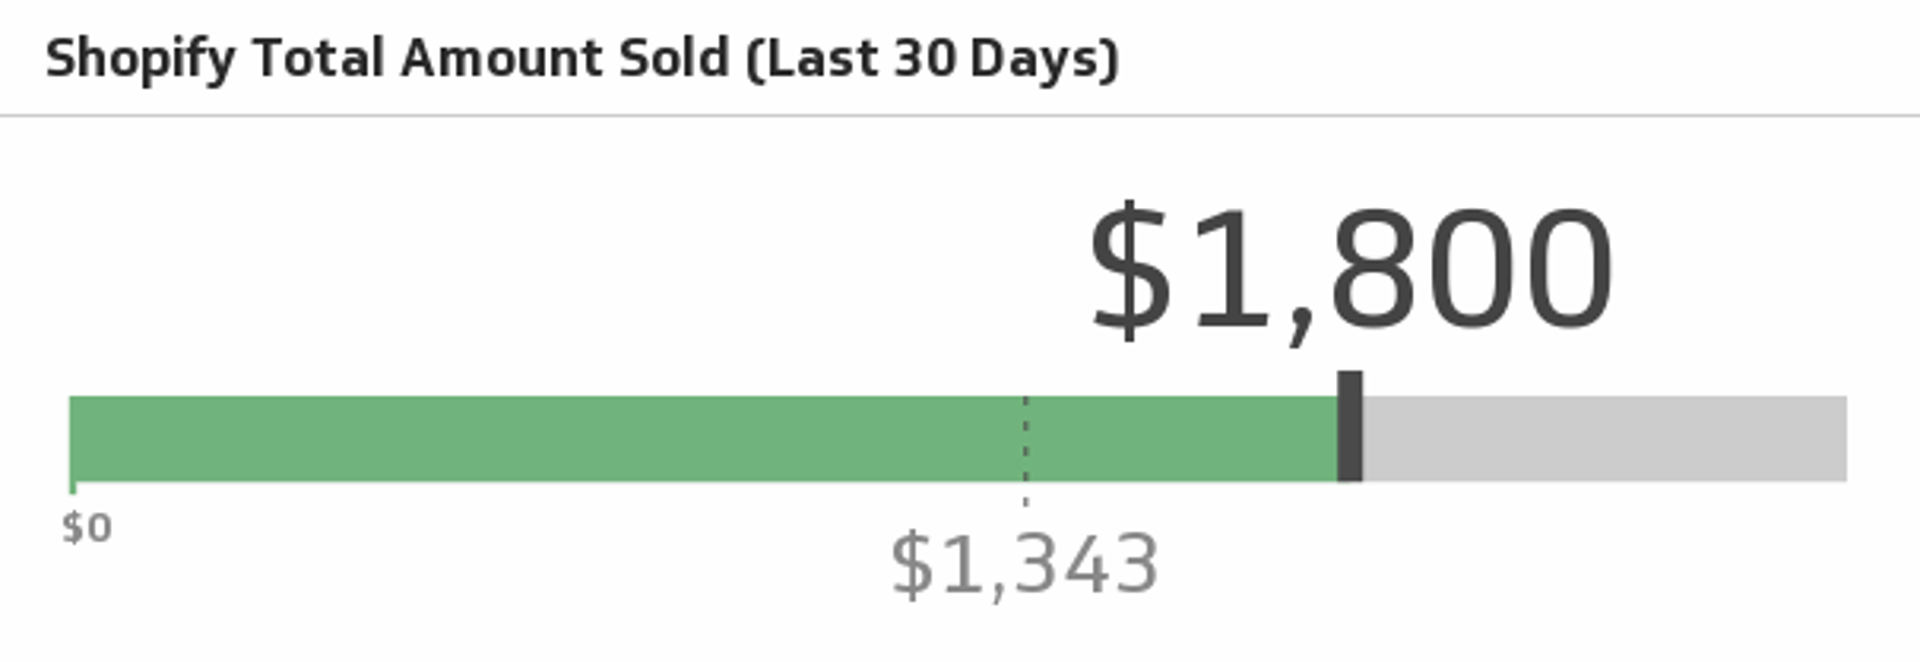
UsesTotal Amount Sold (Last 30 days)
Track how much you're selling this month and see if you can surpass the previous month.
Uses