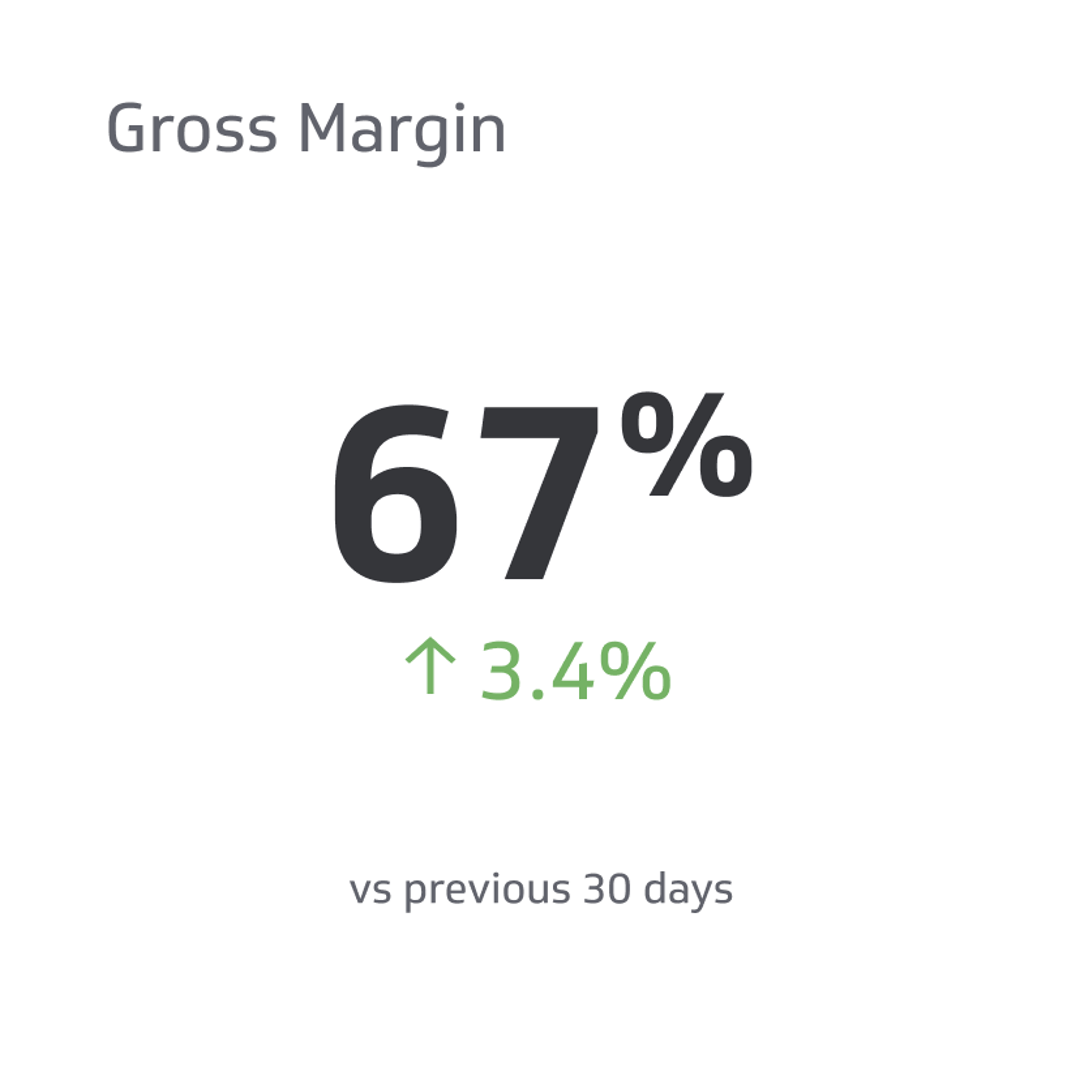
Gross Margin
Gross margin, a key financial performance indicator, is the profit percentage after deducting the cost of goods sold (COGS) from a company's total revenue.
Track all your Financial KPIs in one place
Sign up for free and start making decisions for your business with confidence.
In the world of business, understanding financial metrics is crucial for success. One key performance indicator that drives profitability and informs decision-making is Gross Margin.
Understanding gross margin is essential for investors, business owners, and financial analysts who seek to evaluate a company's performance and compare it to industry standards.
In this article, we’ll dive into the definition, examples, formula, and how to calculate gross margin effectively—ultimately helping you unlock your company's true earning potential.
What Is Gross Margin?
Gross margin, a key financial performance indicator, is the profit percentage after deducting the cost of goods sold (COGS) from a company's total revenue.
This gross profit metric gives businesses valuable insights into their operational efficiency and profitability by revealing how much money is left to cover overhead expenses such as marketing costs, rent, and employee salaries.
Gross margin is commonly presented as a percentage, allowing for easy comparison of a company's performance against its industry peers or historical data.
For instance, let's consider Apple Inc., one of the world's most profitable companies. If Apple generates total revenue of $100 million through iPhone sales and incurs COGS of $60 million for producing those iPhones, their gross profit is $40 million ($100M - $60M).
A higher gross profit suggests that a business is more efficient in controlling its production costs and generating profits from its core operations.
Difference Between Gross Margin and Gross Profit
Gross Margin and Gross Profit are closely related financial metrics that help businesses understand their profitability. While they are often used interchangeably, there is a subtle difference between them.
Gross profit vs. margin
Gross profit is the monetary value after subtracting the COGS from net sales revenue. Gross profit represents the actual dollar amount generated from a company's core operations before considering other operating expenses. Gross profit does not consider the proportion of profit relative to net sales revenue.
On the other hand, gross margin is expressed as a percentage and represents the proportion of gross profit relative to net sales revenue. It provides a more standardized measure of profitability, allowing for easy comparison between companies of different sizes or industries.
Factors Affecting Gross Profit Margin
Gross profit margin is a vital metric that quantifies the proportion of total revenue that exceeds the cost of goods sold (COGS). However, multiple factors can impact this figure, both internally and externally.
Here's a rundown of the key elements:
Production costs
The cost and quality of raw materials can significantly impact the gross margin. Any fluctuation in these costs—whether due to supply chain disruptions, geopolitical events, or other reasons—can have a direct effect on gross profit.
Wage rates, efficiency of labor, and the overall productivity of the workforce can also influence production costs and, consequently, gross margin. Additionally, costs such as utilities, equipment maintenance, and factory leases play into the COGS.
Pricing strategy
How a company prices its products will directly impact its gross margin. Companies may adopt various pricing strategies, such as cost-plus, value-based, or competitive pricing, each of which can have different implications for the gross margin.
Sales volume
Higher sales volumes often lead to economies of scale, where the cost per unit decreases as you produce more. This can lead to an improved gross profit margin.
Product mix
The overall product mix can influence the gross margin if a company sells multiple products with different production costs and selling prices. A shift in sales towards higher-margin products will elevate the overall gross profit and vice versa.
Supply chain efficiency
An efficient supply chain can reduce lead times, minimize stockouts, and lower inventory carrying costs. However, disruptions or inefficiencies can inflate COGS and narrow the gross margin.
Currency fluctuations
For companies that operate internationally or source materials globally, currency exchange rates can greatly impact the cost structure and, in turn, the gross profit. Additionally, currency fluctuations can influence investor sentiment in the stock market, potentially affecting products and services stock prices and profit gross valuations of companies with overseas operations or sales.
Competitive landscape
In highly competitive markets, companies might be compelled to reduce prices, which can erode the gross margin. On the other hand, a company with a unique value proposition or a differentiated product might enjoy higher pricing power and a healthier margin.
Regulations and tariffs
Government regulations, tariffs, and trade barriers can influence the cost structure. For example, tariffs on imported goods can increase the COGS, reducing the gross profit.
Seasonality
For businesses affected by seasonal trends, there might be periods of the year where the gross margin is higher or lower, depending on sales volumes and associated costs.
Market demand
A surge in demand can allow companies to command higher prices, potentially boosting the gross margin. Conversely, a decrease in demand might necessitate discounts or promotions, which can depress the margin.
Gross Margin Formula: How to Calculate Gross Margin
To calculate gross margin, here are the gross margin formula to follow and an example scenario that will make it easier for you to understand the concept.
Step-by-step process
Calculating gross profit margin can be a straightforward process once you have the necessary data at hand.
The first step is determining your total revenue or net sales, which entails adding up all the income generated from selling goods or services during a specific period.
Next, gather information on your COGS. This includes all direct costs associated with producing the product or delivering the service, such as material expenses, labor costs, and manufacturing overheads.
Once you have tallied both revenue and COGS for a given period, you can calculate the margin ratio by following this formula:
Gross Margin % = (Total Revenue - COGS) / Total Revenue x 100.
Example scenario for calculating gross profit
Let's assume a company has $ 5,000 in net sales and $ 3,000 in COGS over two months.
To calculate the gross margin percentage, we would use the formula: (Total revenue - COGS)/Total revenue x 100.
Using this gross profit formula for our example scenario: ($5000 - $3000) / $5000 x 100 = 40%.
This means that the company's gross margin is 40%, and that percentage of its revenue covers its production costs.
A high gross margin percentage reflects positively on businesses as it implies the company effectively manages its production costs and generates a significant profit from its core operations.
Importance of Gross Margin in Business
The importance of gross margin in business cannot be overstated, as it is a vital indicator of financial performance and profitability.
Impact on profit
A higher gross margin means a company has more money left over after selling its goods or services to pay for operating costs and expenses, marketing, and research and development expenses. This can result in higher profits and better financial health for the business.
For example, if a company with $100,000 in revenue has a gross margin of 50%, it means they have $50,000 left over after accounting for the COGS.
Role in decision-making
By understanding their gross margin, businesses can make informed decisions about pricing strategies, production costs, and overall profitability.
Additionally, knowing the factors that impact gross margin allows companies to adjust their operations strategically.
By analyzing trends in sales volume, pricing strategies or cost-reduction initiatives can be implemented to maximize profits while maintaining high levels of customer satisfaction.
Improving Gross Profit
Improving gross profit is critical for businesses that want to enhance profitability and operational efficiency.
Streamlining margin processes
Streamlining processes is one of the most efficient ways to improve gross margin. By analyzing and optimizing workflows, businesses can reduce wastage and improve operational efficiency, which leads to cost savings.
One way to streamline processes is by utilizing technology tools that automate routine tasks such as inventory management, order processing, or invoicing.
Another approach to streamlining processes is by implementing Lean principles. These help businesses identify activities that generate value and eliminate those that don't contribute meaningfully to the bottom line.
By streamlining processes with a data-driven approach, businesses can bolster their gross margin in terms of reducing costs and improving productivity levels overall.
Reducing costs
Reducing costs or expenses can significantly improve a company's gross margin. By cutting down on unnecessary expenses, like paying for personal credit cards, businesses can increase the company gross and overall profitability. One way to reduce costs is by streamlining processes and eliminating inefficiencies.
Another way to reduce costs is by negotiating better deals with suppliers for raw materials or inventory.
Additionally, reducing marketing and advertising expenses without compromising product or service quality could help businesses save money.
Increasing sales
Improving sales is one of the most effective ways to increase your gross margin. This could be achieved by targeting new customers, up-selling to existing customers, or introducing new products or services.
Analyzing customer demand and behavior can also help you identify areas for improvement in your product line or marketing strategy. Another way to increase sales is through promotional campaigns such as discounts or special offers that can incentivize buying behavior.
For example, if you own a clothing store, offering a discount on winter coats at the start of fall can drive seasonal sales and boost gross profit and overall revenue.
Negotiating better supplier deals
One way to improve gross margin is by negotiating better deals with suppliers. This involves finding ways to lower costs while maintaining the same quality of products or services.
Negotiating for lower prices, longer payment terms, and bulk discounts can significantly boost the gross profit of your company.
For instance, imagine a small retail store that purchases inventory from multiple suppliers. By negotiating better deals with suppliers, it can reduce its COGS, increasing gross margin without affecting product quality.
Implementing pricing strategies
Implementing pricing strategies is also effective in improving a company's gross margin. This involves adjusting the price of products or services to optimize profits without losing customers.
One common strategy is dynamic pricing, which adjusts prices based on demand and supply factors like competition, seasonality, and inventory levels. For example, a retailer may increase the price of an item during peak shopping periods but lower it during off-seasons when demand is low.
Another strategy is value-based pricing, which sets prices based on the perceived value of a product or service rather than internal costs.
By implementing these pricing strategies, businesses can gain better control over their financial performance while staying competitive.
Challenges in Maintaining a High Margin
While achieving a high gross margin is often a priority for businesses, maintaining it can be formidable. Several challenges can impact a company's ability to sustain robust gross margins:
Volatile commodity prices
Companies that rely on commodities as raw materials, like oil, metals, or agricultural products, often face fluctuating costs. A sudden surge in commodity prices can squeeze the gross margin if companies can't pass those cost increases onto consumers.
Increased competition
Price wars can emerge in markets with many players and limited product differentiation. Companies might find themselves in a situation where they need to reduce prices to remain competitive, thus compressing their margins.
Globalization
The global nature of today's business landscape means that companies often face competition from local entities and foreign companies with potentially lower operational costs.
Technological disruption
Rapid technological advancements can make certain products obsolete or less valuable. Companies might need to reduce prices to clear out inventory or to stay relevant, impacting the gross margin.
Labor costs
Wages and related expenses might increase in regions or industries experiencing labor shortages or where labor unions are strong. If these wage increases aren't accompanied by a corresponding rise in productivity or prices, they can erode gross margins.
Supply chain disruptions
Events like natural disasters, geopolitical issues, or global pandemics can disrupt supply chains, leading to increased costs. A resilient supply chain is crucial, but unexpected disruptions can still challenge gross margins.
Regulatory changes
New governmental regulations or changes in existing ones can lead to increased compliance costs. For instance, stricter environmental regulations mean investing in cleaner technologies or practices, which can be costly.
Consumer preferences
Shifting consumer tastes and preferences can force companies to adjust their product offerings. This might entail R&D costs, rebranding expenses, or promotional costs to introduce new products, all of which can strain gross margins, at least temporarily.
Economic Downturns
In recessions or economic slowdowns, consumers tend to cut back on spending. Companies might need to offer discounts or promotions to stimulate sales, often at the expense of their gross margin. Furthermore, securing venture capital and other venture fund sources can become challenging during these times since investors may become more conservative with where they place their money. As such, this can affect your profit margin, making it even more essential for businesses to optimize operations.
Currency fluctuations
For businesses operating internationally, currency exchange rate volatility can be a significant challenge. If a company's home currency strengthens considerably against other currencies, its products might become more expensive for foreign customers, potentially impacting sales and margins.
Boosting Your Business Profit Through Margins
Gross Margin is a critical metric that measures the profitability of a business by considering its revenue and cost of goods sold (COGS.)
By understanding the definition, example, formula, and gross margin calculation, you can compare your company's financial performance to industry benchmarks.
Analyzing gross profit and margin empowers investors, business owners, and financial analysts to make informed decisions, identify trends, and assess the impact of changes in revenue or production costs.
Related Metrics & KPIs