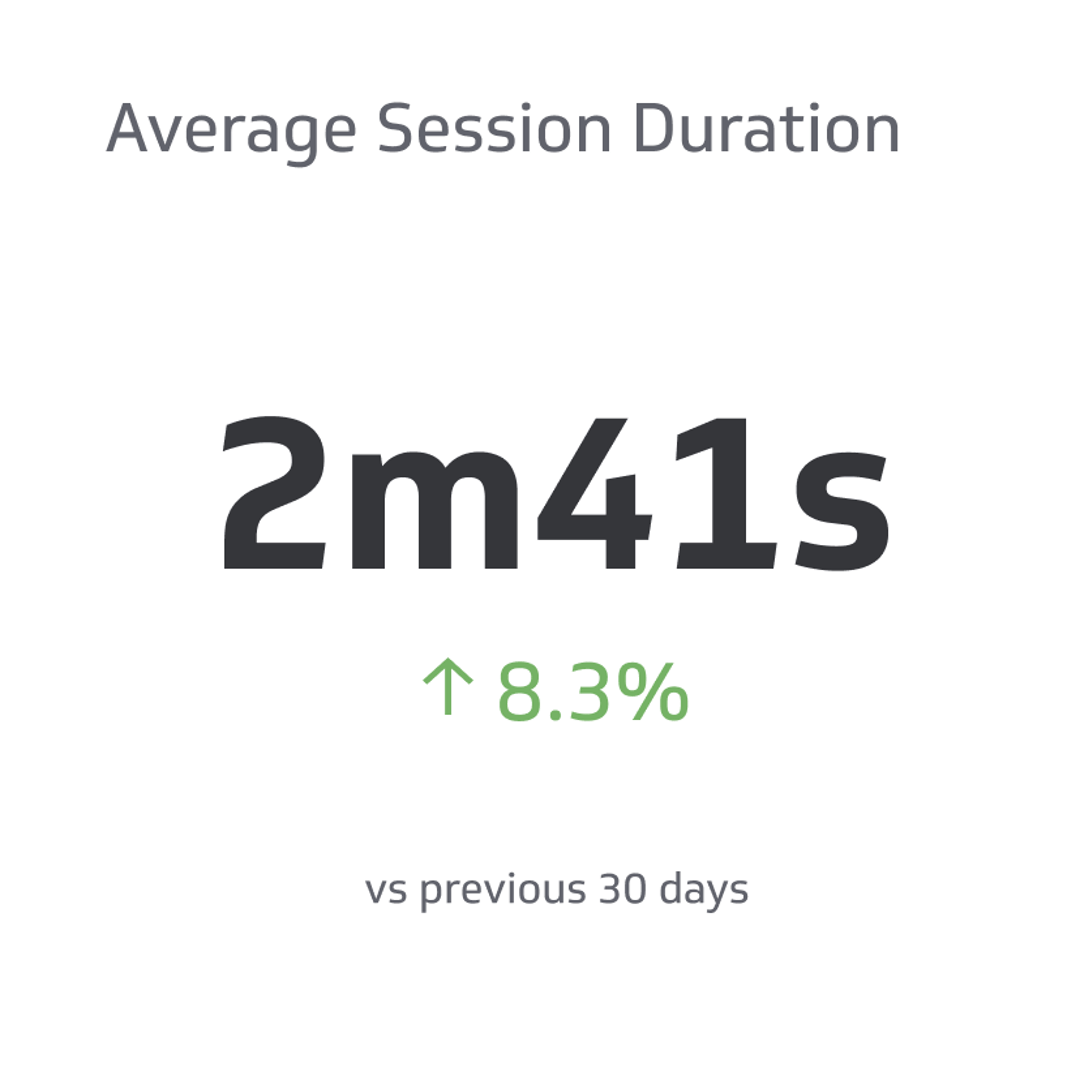
Average Session Duration
Average session duration refers to the average time users spend on a particular website, app, or platform during a single session.
Track all your Digital Marketing KPIs in one place
Sign up for free and start making decisions for your business with confidence.
Average session duration refers to the average time users spend on a particular website, app, or platform during a single session. It is typically calculated by dividing the total duration of all sessions by the number of sessions during a specific period.
It's also important to consider other metrics in conjunction with average session duration to gain a more comprehensive understanding of user behavior and engagement. For example, a website or app with a long average session duration but a high bounce rate (percentage of users who leave after viewing only one page) may indicate that users spend a long time on a single page without engaging with other parts of the platform.
What Is “Average Session Duration”?
Average session duration is a standard key performance indicator (KPI) used in web analytics to measure user engagement and the overall effectiveness of a website or app. A longer average session duration is generally considered positive, as it suggests that users spend more time on the platform, potentially engaging with its content or features meaningfully.
However, it's essential to interpret average session duration in context, as it can be influenced by various factors, such as the type of website or app, its content, and its purpose.
What Factors Can Influence Average Session Duration?
Various factors can influence the average session duration. For example, a news website may have shorter average session durations than an e-commerce website, as users may quickly read articles and move on. In contrast, users on an e-commerce website may spend more time browsing products and making purchases.
Other factors, such as the website or app's design and usability, the content's relevance and quality, and the user's intent or behavior, can also impact average session duration.
Is a Longer Average Session Duration Always Better?
Not necessarily. While a longer average session duration is generally considered positive, as it suggests that users spend more time on the platform, it's important to interpret it in context.
For instance, a website or app with a long average session duration but a high bounce rate may indicate that users spend a long time on a single page without engaging with other platform parts.
Therefore, it's essential to consider other digital marketing metrics, such as bounce rate, conversion rate, and user flow, in conjunction with average session duration to understand user behavior and engagement comprehensively.
What Is a Bounce Rate?
Bounce rate refers to the percentage of users who leave a website or app after viewing only one page, without engaging with any other pages or taking further action. In other words, it measures the proportion of single-page sessions in which the user exits without interacting further with the website or app.
A high bounce rate may indicate that users need help finding what they are looking for or are not engaging with the content or features of the website or app. It could be due to various factors, such as poor website design, irrelevant or low-quality content, slow loading times, confusing navigation, or lack of clear calls to action.
However, it's crucial to interpret bounce rate in context. In some cases, a high bounce rate may be expected or desirable. For example, on a blog or news website, users may come to read a single article and then leave, resulting in a higher bounce rate. On the other hand, for an e-commerce or content-rich website, a high bounce rate may indicate a potential issue with user engagement and conversion.
To lower bounce rates and improve user engagement, website or app owners can focus on improving website design, content quality and relevance, navigation, loading times, and overall user experience. Analyzing bounce rate in conjunction with other metrics, such as average session duration, conversion rate, and user flow, can provide a more comprehensive understanding of user behavior and help identify areas for improvement.
How Can I Improve the Average Session Duration?
Several strategies can potentially improve average session duration, such as:
- Creating high-quality, relevant content that engages users and encourages them to stay longer.
- Improving the usability and user experience of the website or app to make it easy for users to navigate and find what they are looking for.
- Providing interactive and engaging features, such as videos, quizzes, or interactive tools, that can keep users interested and entertained.
- Optimizing a website or app performance to reduce loading times and minimize technical issues that may cause users to leave.
- Understanding user intent and behavior through data analysis and using the insights to tailor the website or app to meet their needs.
- Implementing personalization and recommendation features that provide users with relevant content or product suggestions increases their engagement and session duration.
What Is User Experience?
User experience (UX) refers to a user's overall experience while interacting with a product, service, or system, such as a website, app, software, or physical product. It encompasses all user interaction aspects, including perceptions, emotions, behaviors, and satisfaction. A positive UX meets or exceeds the user's needs, expectations, and goals and provides a seamless, efficient, and enjoyable experience.
The goal of UX design is to create products that are user-friendly, visually appealing, and accessible and that provide a positive and meaningful experience for the users.
Specifically, the website or app should be easy to use, efficient, and effective in helping users achieve their tasks or goals. Additionally, the product or system should have a consistent and familiar design and behavior across different parts or sections to avoid confusion and provide a coherent experience.
A good user experience can lead to increased user satisfaction, loyalty, and engagement, as well as improved business outcomes, such as higher conversion rates, customer retention, and brand reputation.
Can Average Session Duration Vary Across Different Industries or Platforms?
Average session duration can vary significantly across different industries, platforms, and even individual websites or apps. For example, a news website may have shorter average session durations than a social media platform or an e-commerce website.
The type of content, purpose, and user behavior can all impact the average session duration. It's important to benchmark average session duration against industry standards or previous performance of the same platform to gain a meaningful context for evaluation.
How Can I Track Average Session Duration?
Businesses or individuals can track average session duration using web analytics tools like Google Analytics or other third-party analytics platforms. These tools typically provide data on various website or app metrics, including session duration, allowing you to analyze the data over a specific period to calculate the average session duration.
How to Locate Average Session Duration in Google Analytics?
Here is a quick rundown of the steps to locate the average session duration in Google Analytics.
Step 1: Access Google Analytics
Go to the Google Analytics website and sign in with your Google account. Make sure you have the necessary permissions to access the website or app for which you want to view the average session duration.
Step 2: Select the Desired Property and View
Once logged in to Google Analytics, select the appropriate property and view from the drop-down menus at the top left corner of the screen. Properties represent the websites or apps you have set up in Google Analytics, and views allow you to specify how you want to see the data for a particular property.
Step 3: Navigate to the Audience Overview Report
In the left-hand menu, click on "Audience" to expand the audience-related reports. Then click on "Overview" to access the Audience Overview report, which provides a high-level summary of various engagement metrics, including average session duration.
Step 4: View the average session duration
In the Audience Overview report, you will see various engagement metrics, including average session duration, displayed as a time value in the "Avg. Session Duration" column. The average session duration represents the average time users spend on your website or app during a session.
What Is the Difference Between Average Session Duration and Average Time on Page?
Average session duration and Average Time on Page are two related but distinct metrics in Google Analytics that provide insights into user engagement on your website or app.
Average session duration represents the average time users spend on your website or app during a session. A session is a single visit to your website or app that may include multiple interactions, such as pageviews, events, and conversions. The average session duration is calculated as the total duration of all sessions divided by the total number of sessions during the selected time. It provides a holistic view of user engagement across an entire session, from the initial entry to exit.
Average Time on Page describes the average time users spend on a specific page before navigating away or closing the page. It is calculated as the total time spent on a specific page divided by the total number of pageviews during the selected period. Average Time on Page is a page-level metric that indicates how engaging a particular page is to users.
Both metrics can be valuable in understanding user behavior and optimizing a website or app performance. For example, a high average session duration may indicate that users are spending a significant amount of time engaging with your website or app overall, while a high Average Time on Page may suggest that a particular page is capturing user attention and keeping them engaged.
By analyzing both metrics in conjunction with other engagement and conversion metrics, you can gain insights into user behavior and make data-driven decisions to optimize your website or app for better user experience and improved outcomes.
What Is a Good Average Session Duration Benchmark?
A good average session duration benchmark can vary depending on the type of website or app, industry, and user behavior. However, as a general guideline, an average session duration of 2-3 minutes or longer is reasonable. Remember that this is a rough benchmark and should be interpreted in the context of your specific website or app and its objectives.
To determine a relevant benchmark for your website or app, it's best to analyze historical data and compare your average session duration against your past performance or industry averages, if available.
Internal comparison can help you understand what is typical for your specific context and identify areas for improvement or optimization. It's also important to consider other related metrics.
A "bad" average session duration can vary depending on the context and goals of your website or app. Generally, a shorter average session duration may be considered less desirable, as it can indicate that users are spending less time on your site or app, which may result in less engagement, lower conversion rates, and reduced opportunities for interaction with your content or features.
In general, if your website or app has an average session duration significantly below industry benchmarks or your own performance goals, it may be an indication that users are not finding your content or features engaging or relevant.
In such cases, it's important to carefully analyze the data, identify potential pain points, and take appropriate actions to optimize the user experience and improve session duration, keeping in mind your website's or app's specific context and goals.
How Can Conversation Rates and User Flow Impact Average Session Duration?
Conversion rate and user flow are two important metrics that are often used in web analytics to measure the effectiveness of a website or app in achieving its intended goals and guiding users toward desired actions.
Conversion rate is the percentage of users who complete a specific goal or action on your website or app, such as purchasing, submitting a form, or signing up for a newsletter. It is calculated by dividing the number of conversions (completed goals) by the total number of visitors or sessions and then multiplying by 100 to get a percentage.
A higher conversion rate indicates that a more significant proportion of users are taking the desired action, which typically reflects a more compelling user experience and a higher likelihood of achieving business objectives.
User flow refers to the path users take as they navigate through your website or app, from the entry point, such as a landing page or home page, to completing a specific goal or action. User flow can be visualized using flowcharts or diagrams to understand the sequence of pages or screens users visit, their interactions, and the drop-off points where they exit or abandon the flow.
Analyzing user flow can help you identify any bottlenecks or obstacles in the user journey and optimize the user experience to improve conversion rates.
Both conversion rate and user flow are valuable metrics for evaluating the performance and user experience of your website or app. Both should be considered in concurrence with average session duration.
What Is the Best Way to Visualize Average Session Duration?
There are several ways to visualize average session duration, depending on the type of data you have and the context in which you want to present the information. Here are a few standard methods:
Line Chart
A line chart is a simple and effective way to visualize trends in average session duration over time. You can plot the average session duration on the y-axis and time (e.g., days, weeks, months) on the x-axis. This allows you to see how the average session duration changes over different periods and identify any patterns or trends.
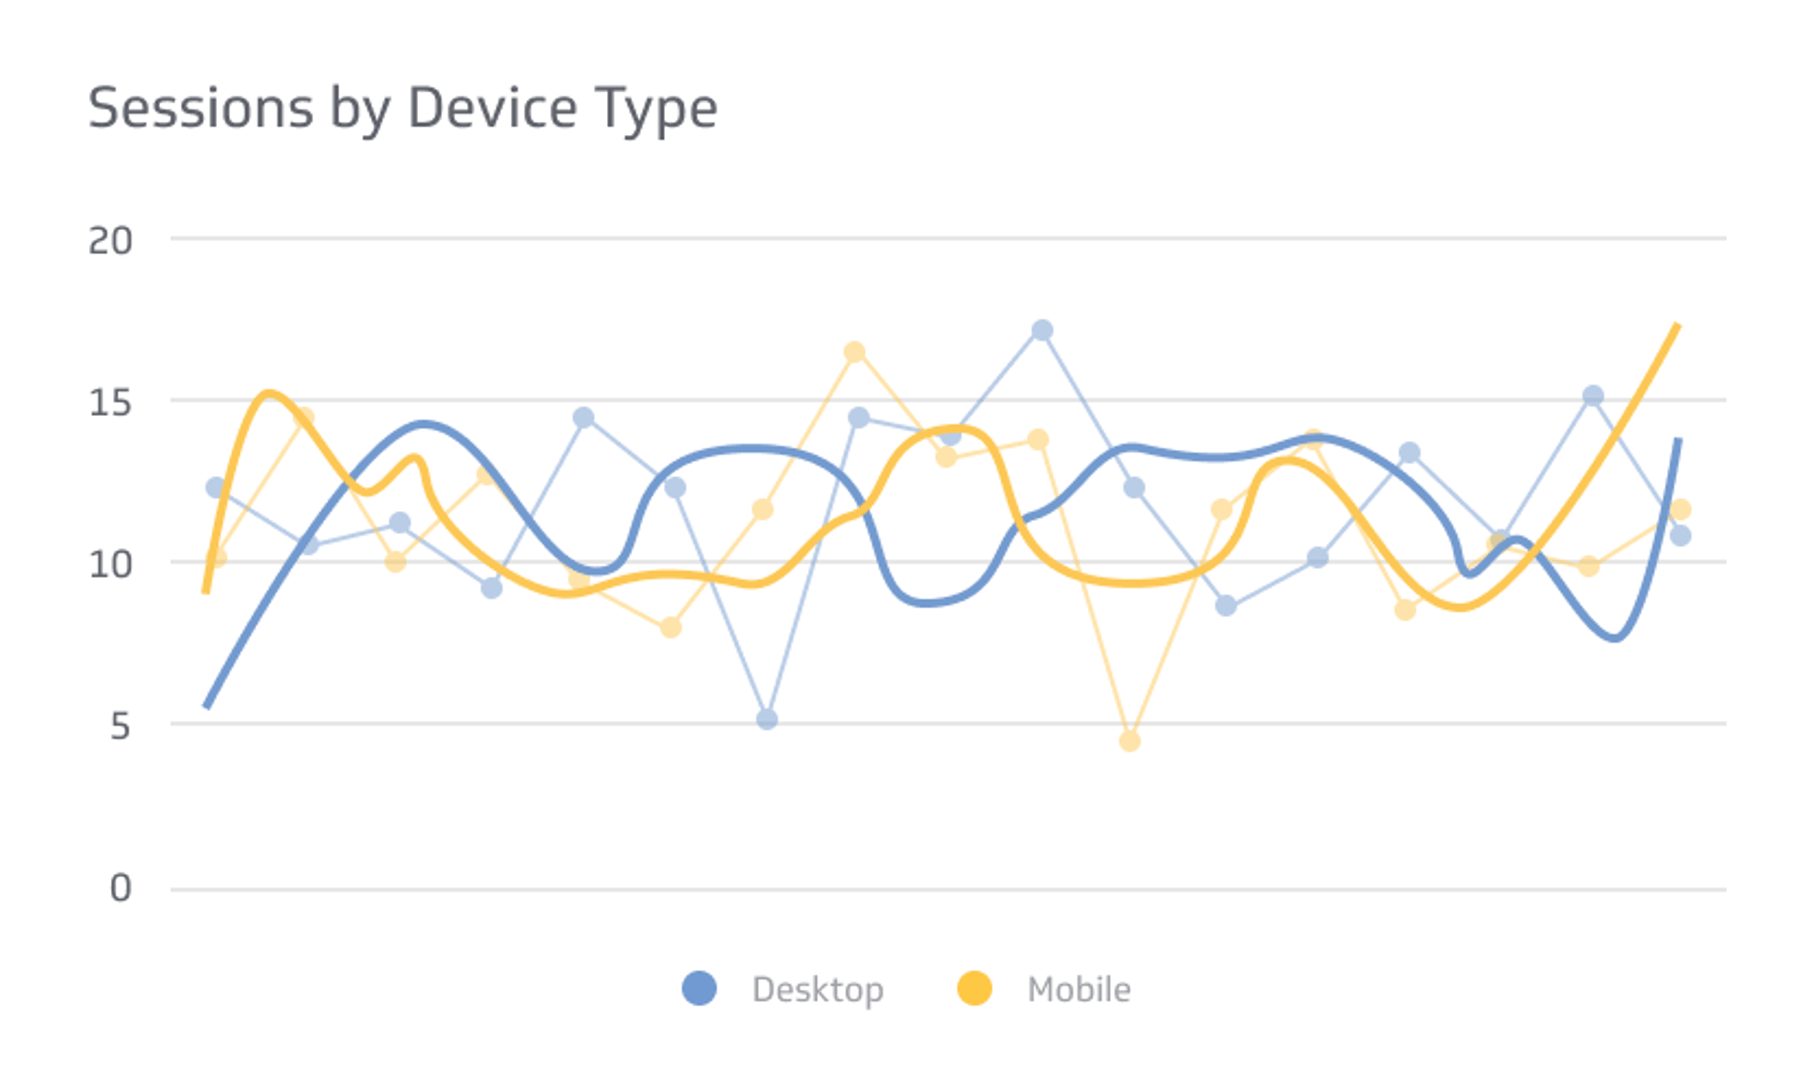
Bar Chart
A bar chart can compare average session duration across different segments or categories. For example, you can create a bar chart to compare average session duration by traffic source, by device type, or by user demographic. Each bar represents the average session duration for each segment, allowing for easy visual comparison.
Heatmap
A heatmap can provide a visual representation of the distribution of average session duration across different pages or sections of your website or app. You can use color gradients to indicate the intensity or duration of average session duration, with warmer colors representing longer sessions and cooler colors representing shorter session durations. This can help identify which areas of your site or app are attracting longer or shorter session durations and can provide insights into user behavior.
These are just a few examples of how you can visualize average session duration. The choice of visualization method will depend on the specific data you have, the insights you want to convey, and your audience's preferences. Choosing a visualization that effectively communicates the information you want to convey and helps you gain insights from the data is essential.
What Are Some Best Practices Relating to Average Session Duration?
Consider improving content relevance and quality. Creating high-quality, engaging, and relevant content is crucial in keeping users on your website or app for longer durations. Ensure that your content meets the needs and expectations of your target audience and is well-organized, easy to read, and visually appealing. Additionally, incorporating multimedia elements such as images, videos, and interactive features can enhance user engagement.
Enhance website or app usability and navigation to boost session duration. A user-friendly and easy-to-navigate website or app can help users find what they are looking for quickly and easily, leading to longer session durations.
Ensure that your website or app has clear and intuitive navigation, with easy-to-use menus, search functionality, and prominent calls to action. Additionally, aim to optimize your website or app for different devices, such as desktop, mobile, and tablet, to provide a seamless experience across all platforms.
People love the personalization of apps and websites! Personalization can enhance user engagement and encourage longer session durations. Use data and insights about your users to deliver personalized content, recommendations, and offers based on their preferences, interests, and behavior.
Further, internal linking can help users discover more content and spend more time exploring your site or app. Incorporate relevant and contextual internal links within your content to encourage users to click through and explore related content.
Understanding your metrics can improve performance. Regularly monitor and analyze data related to average session duration, bounce rate, and other engagement metrics using web analytics tools such as Google Analytics. Identify patterns, trends, and areas for improvement, and use data-driven insights to make informed decisions and optimize the user experience.
By following these best practices, you can optimize average session duration on your website or app, leading to increased user engagement, improved user experience, and potentially higher conversion rates.
Final Thoughts
In summary, average session duration is a valuable metric to measure user engagement, but it should be interpreted in context and used in conjunction with other metrics to gain a holistic understanding of user behavior and website or app performance.
A longer average session duration may indicate that users are spending more time engaging with your content, exploring different pages, and potentially converting.
average session duration should be used in conjunction with other relevant metrics such as conversion rate, bounce rate, and goal completions to gain a comprehensive understanding of user behavior and website or app performance.
Remember, there is no one-size-fits-all benchmark for average session duration, as it can vary greatly depending on the nature of your website or app, your target audience, and your business goals.
It's essential to interpret this metric in the context of your specific situation and use it as a part of a broader analytics approach to gain insights and make data-driven decisions.
Related Metrics & KPIs