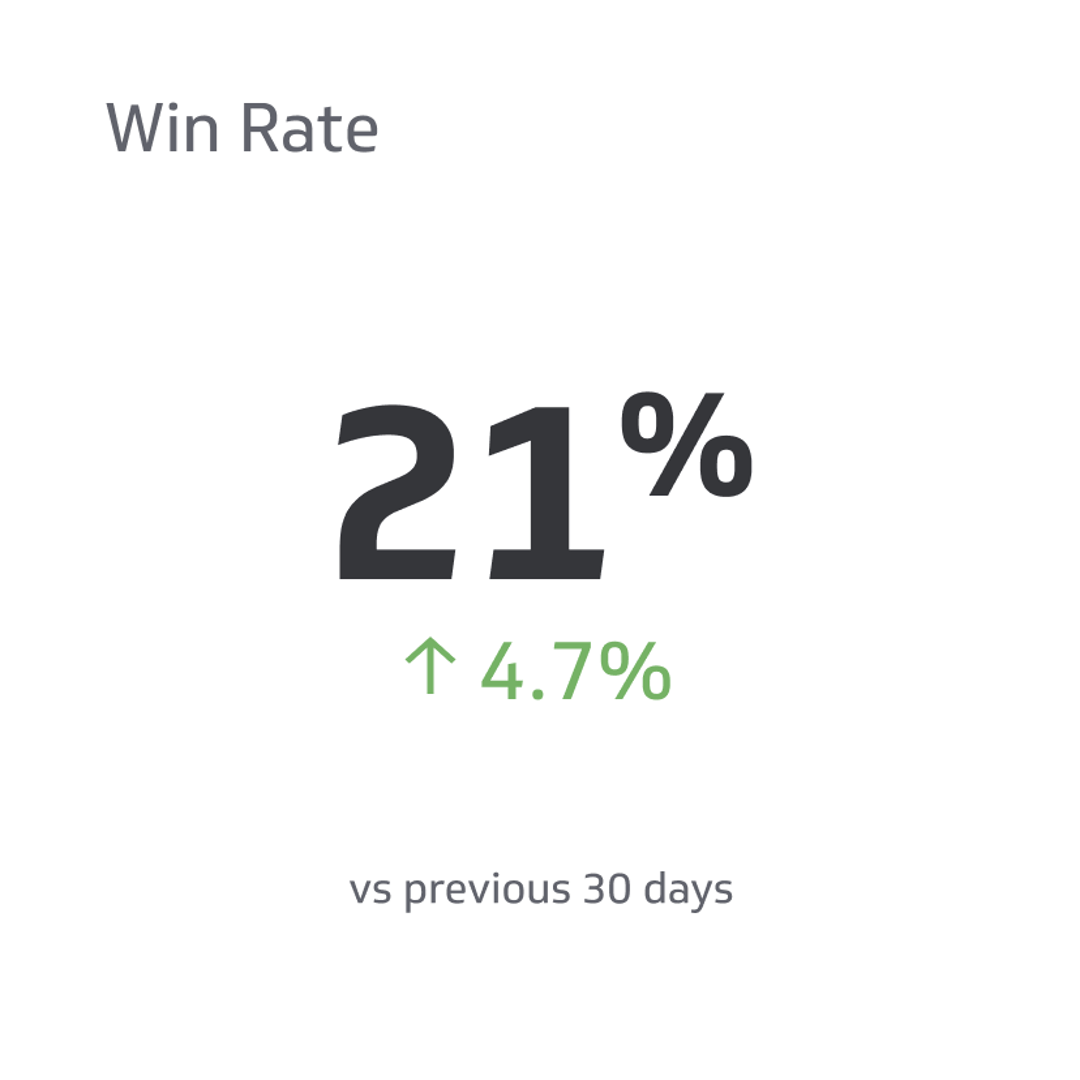
Win Rate
The metric is a percentage representation of all deals you close in the business.
Track all your Sales KPIs in one place
Sign up for free and start making decisions for your business with confidence.
Metrics are vital performance measurements for any organization and for learning more about a team’s productivity.
Key Performance Indicators (KPIs) are measures that help evaluate the performance of your sales team by studying the efficacy of sales funnels. KPIs are also instrumental in assessing the effectiveness of outreach strategy. One such KPI is the Sales Win Rate.
Win rate is an easy-to-apply sales performance management metric that helps manage all aspects of your sales force and improve performance. The metric investigates your best sales tactics, areas that require improvement, and products attracting the most sales.
The blog provides a comprehensive understanding of win rate in sales, how to calculate it, and its significance in your business. Read on for multiple strategies and tools that can help improve the win rate, common challenges, and best practices.
What Is Win Rate in Sales?
Win rate is the north star sales metric for measuring the success of your sales team. Sometimes known as win percentages, the metric is a percentage representation of all deals you close in the business. You can use the win rate to assess the performance of your sales team over a specific reporting period.
What Are the Benefits of Tracking Win Rate?
Tracking sales win rate is a tedious but necessary activity. The process will help you save time and devote more resources to expanding operations.
Following are more reasons why tracking win rate is critical for business operators, marketers, analysts, and SaaS teams.
Improve Sales Performance
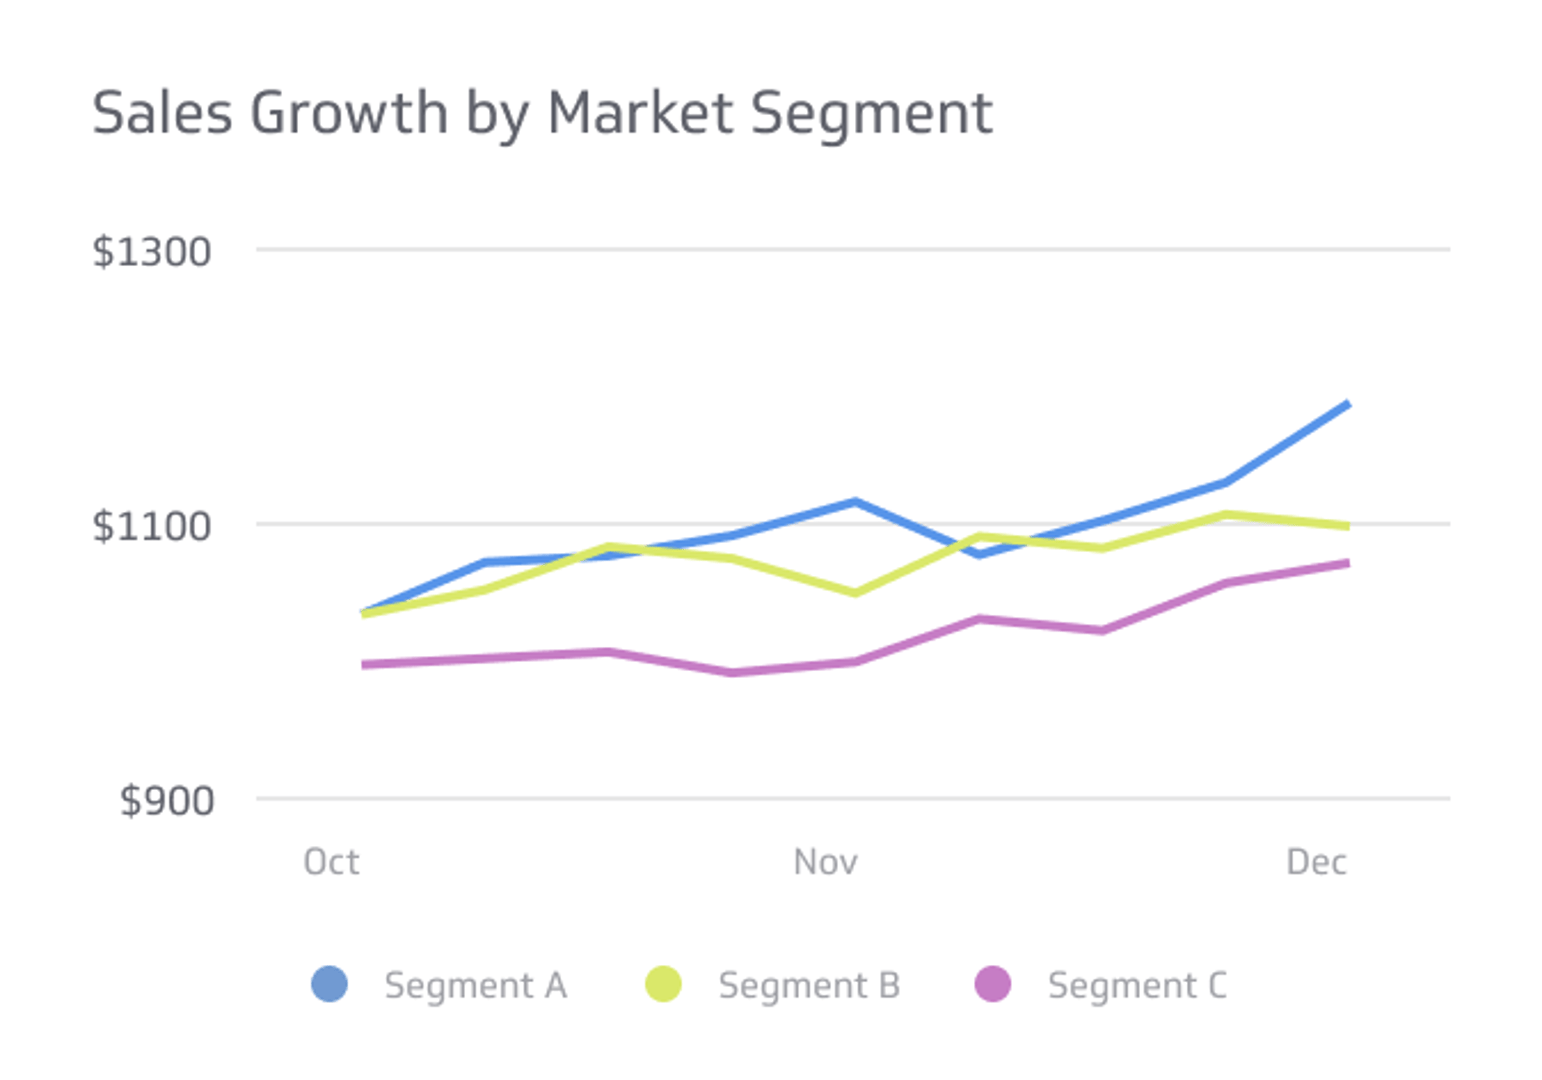
Analyzing your conversion rate data lets you identify areas where your sales team excels and those areas that require improvement. The information is pivotal for optimizing the sales process and increasing the win rate.
For instance, the sales team might struggle to close deals in a specific market segment. Analysis lets you allocate more resources to the area and offer extra training to the sales team.
Helps Forecast
Tracking your win rate also helps you forecast sales income more accurately. Knowing the rate lets you estimate the number of deals you win in a specific period and the associated revenue.
The information will help you plan for future growth while allocating resources more effectively. Stakeholders and investors also gain valuable insight into the prospects of a company. Accurate forecasting also leads to better decision-making and resource allocation.
Helps You Identify Cause and Effect
Identifying cause-and-effect relationships in a process can be difficult because you are never sure how one variable affects others. However, tracking the win rate can help you do that and underscore the relationships between variables and results.
The ready data makes it easier to ask questions and find answers. The data offers answers to questions such as:
- What outreach channel is performing the worst or best?
- What percentage of prospects are signing on after a brief introduction to a service or product?
- What are the most relevant products or services in my business?
- What season is the business performing at its best and worst?
- How much does it cost to acquire a single customer?
- What percentage of prospects is the business losing to a competitor, and why?
Helps You Benchmark
Win rate tracking allows benchmarking performance against industry competitors and standards. The insight lets you compare your performance to others in the same industry and identify areas where you lag.
Use the information to adjust your sales tactics and strategies to compete better.
How To Calculate Win Rate
The win rate is the percentage of won contracts against the total number of deals you pursue.
The formula is:
Win Rate% = (Number of deals you win / Number of deals you pursue) x 100%
For example, your business pursued 50 deals last month and won 10. Calculating the win rate is:
(10/50) x 100% = 20%
Your sales win rate for the business in that month is 20%.
The interpretation of the numerator and denominator can make things complicated. Here are the most common calculations of win rate in the industry.
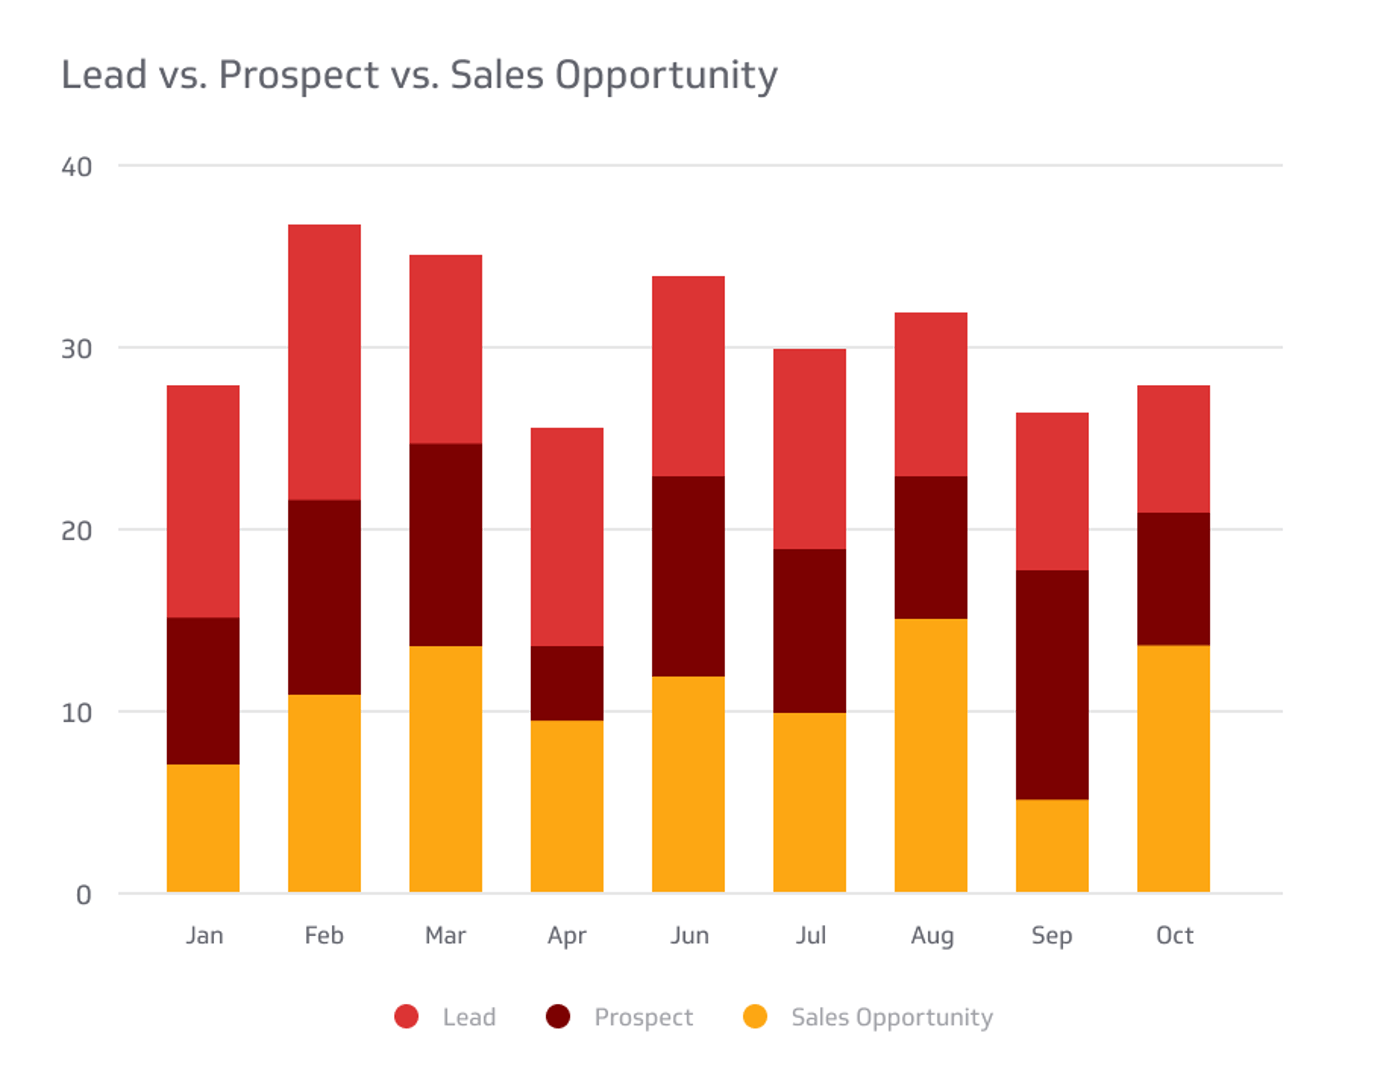
Sales Qualified Leads (SQLs) to Opportunities Won
Win rate % = (Total opportunities you win / SQLs) * 100%
The win rate (or close rate) calculates successful deals out of the qualified sales leads within a specific time. This win rate type is critical for identifying conversion issues or finding out how to improve the sales process.
Use this method when you have “solid” qualification criteria that are specific, understood by most of the sales team, clearly defined, and widely used. A weak qualification criterion can penalize the win rate by inflating the denominate with unreal opportunities.
Opportunities Won to Opportunities Closed
Win rate % = Opportunities you won / (Opportunities won + Opportunities lost) * 100%
The strategy removes the number of leads from the formula and focuses on the closed deals that are opportunities you win. Unfortunately, sales team members who do not update the pipeline Customer Relationship Management (CRM) can easily skew the results.
For example, a team member might want to increase their win rate for the quarter. One way of doing this is by leaving CRM opportunities open and artificially inflating them to hide deeper process issues. The effect is skewed data that creates an artificial bottleneck.
However, calculating the win ratio is beneficial when team members are honest. The formula lets you calculate the loss ratio and analyze the opportunities lost. This is an excellent way to improve the sales process.
Use the method when you are aggressively moving deals to the closed-lost lot. However, carry out pipeline reviews weekly to move the stalled opportunities to the closed-lot department.
Remember to scrutinize opportunities in the pipeline three times longer than the average sales cycle and with over 30 days of inactivity. Run regular audits to find such stalled deals.
Closed Cash Against Cash in Pipeline
Win rate % = (Total amount of cash closed / Total amount of money in the pipeline) * 100%
The formula helps add context to the pipeline potential and focuses only on the relevant metrics. This approach will not tell you much unless you consider other factors, including lead sources and sales reps. Instead, use aggregate measurements for a detailed picture.
Use the formula when calculating the win rate for a small subset of your sales team. The teams usually work with larger deal amounts and longer sales cycles. So, know how much cash is in the pipeline.
What’s a “Good” Win Rate?
Defining a good win rate depends on your company, niche market, and product. However, a rate of over 60% is considered a strong indicator that you have efficient and effective sales strategies.
Some industries might have lower success rate expectations because of the size and complexity of the target market.
It is, ultimately, critical to have realistic goals depending on available resources and marketplace competition. Implementing effective strategies and well-defined sales processes can help improve your win rate and sales performance.
Best Practices for Measuring and Improving Win Rate
Measuring and improving win rates is critical for the success of a business. Here are the best practices to help you achieve sales goals and improve overall performance.
Define and Standardize the Sales Process
Defining and standardizing your sales process involves implementing clear and consistent steps for selling a service or product. Always document the process and communicate with your sales team. Regular reviews and updates will also help improve it.
A standardized sales process ensures each sales team member follows the same steps, and tracking and measuring performance is easy. Standardization also helps identify components that require improvement for better results.
Set Realistic Goals and KPIs
Your goals should be specific, measurable, achievable, relevant, and time-bound. Align your KPIs to the sales process and overall business objectives.
Regular goal and KPI reviews and analysis ensure they are achievable and relevant. However, create room for adjustments so your sales team stays on track and motivated to achieve the objectives.
Provide the Sales Team With Regular Feedback
Consider offering ongoing and personalized coaching to each member of the sales team. Focus on skills development and addressing performance or knowledge gaps.
Create an environment that allows for real-time feedback rather than waiting for a performance review. Ensure feedback is specific, actionable, and focuses on changeable behaviors. Regular coaching and feedback will help motivate your team and improve their confidence in the sales process.
Encourage Collaboration and Knowledge Sharing
The collaboration will help team members learn from each other and identify the best practices. It will also help them with areas in your sales process that require changing.
Training sessions, mentorship programs, and team meetings are part of knowledge sharing. A culture of collaboration and knowledge sharing is an excellent way to build a motivated and strong sales team.
Analyze and Optimize the Sales Process Continuously
Continual sales process analysis and optimization help identify the weak areas and institute measures that lead to better results. Analyze the sales data to identify trends and patterns.
Optimizing your process will help increase efficiency, improve performance, and improve your win rate.
Nurture Your Leads
The race to respond starts once a lead engages with your marketing campaign. A five-minute delay can lead to a whopping 80% drop in the conversion rate. This is why you require an effective inbound lead workflow.
The workflow will help your team focus their time on developing profitable customer relationships instead of allowing leads to slip through the cracks. Ensure your leads are aware of the product and ready to purchase.
So, offer the right content at each stage, answer questions, and adopt a customer-centric approach. The strategy will help your customers envision a brighter future with your brand.
Differentiate Yourself
The entire organization must understand the primary tenets of why your service or product is unique on the market. This is what defines your business and distinguishes you from the competitors.
Document the target customer personas, competitor strengths and weaknesses, and key competitive themes. These are all things that make you the better choice. The strategy will help you craft specific messages that address the pain points of prospects.
It’s also an opportunity to clarify the business value proposition. Inform the sales team when you find a specific value statement that resonates with the target market.
Common Challenges When Measuring Win Rate
Many companies realize success after implementing win rate measurements. However, some struggle to move past the setup challenges. If you’re struggling with the calculations or results, anticipating the obstacles can help create a path of least resistance.
Here’s a list of the biggest challenges businesses experience as they measure win rates.
Not Identifying a Single Source of Truth
Difficulty accessing data and technology systems within your process can make it difficult to trust your data. This may slow down or even derail your efforts to track win rates.
For instance, your organization may have critical data on multiple platforms, complicating your truth source. How can you determine the points to focus on?
Larger companies have many points of data interaction. Ensure you have access to a single truth source by looking at the current state of your sales process and mapping the data you require for win rate metrics.
A single source of truth also makes it easier to identify incorrect or missing data points. Align the metrics to the source or determine a single location to send your data.
Failing To Engage Upper Management
Middle managers may fear that changing how they measure might change the success they see. An accurate way of measuring success will reveal discrepancies between your past performance and what the new system shows. The differences may deter stakeholders from getting accurate measures when the old metrics show the sales performance in a better light.
Increasing the alignment and understanding across the team, especially with seniors, will help the entire organization understand when a change is coming and what it means to them. Stay upfront with the leadership to achieve transparency when the first performance dip occurs.
Eventually, the win rate measurement process will take shape along these goals.
The TakeAway
Understanding your win rate is a critical component in the win-against-loss analysis. The metric tells what is happening, how you got there, and what you can do to improve the sales process.
However, the key to accurate win rate measurements is identifying questions to ask and applying appropriate tools to uncover data that matters.