Pingdom Checks Metrics Metric
Track server uptime and performance with Pingdom Checks metrics to ensure website reliability.
Track all your DevOps KPIs in one place
Sign up for free and start making decisions for your business with confidence.
Overview
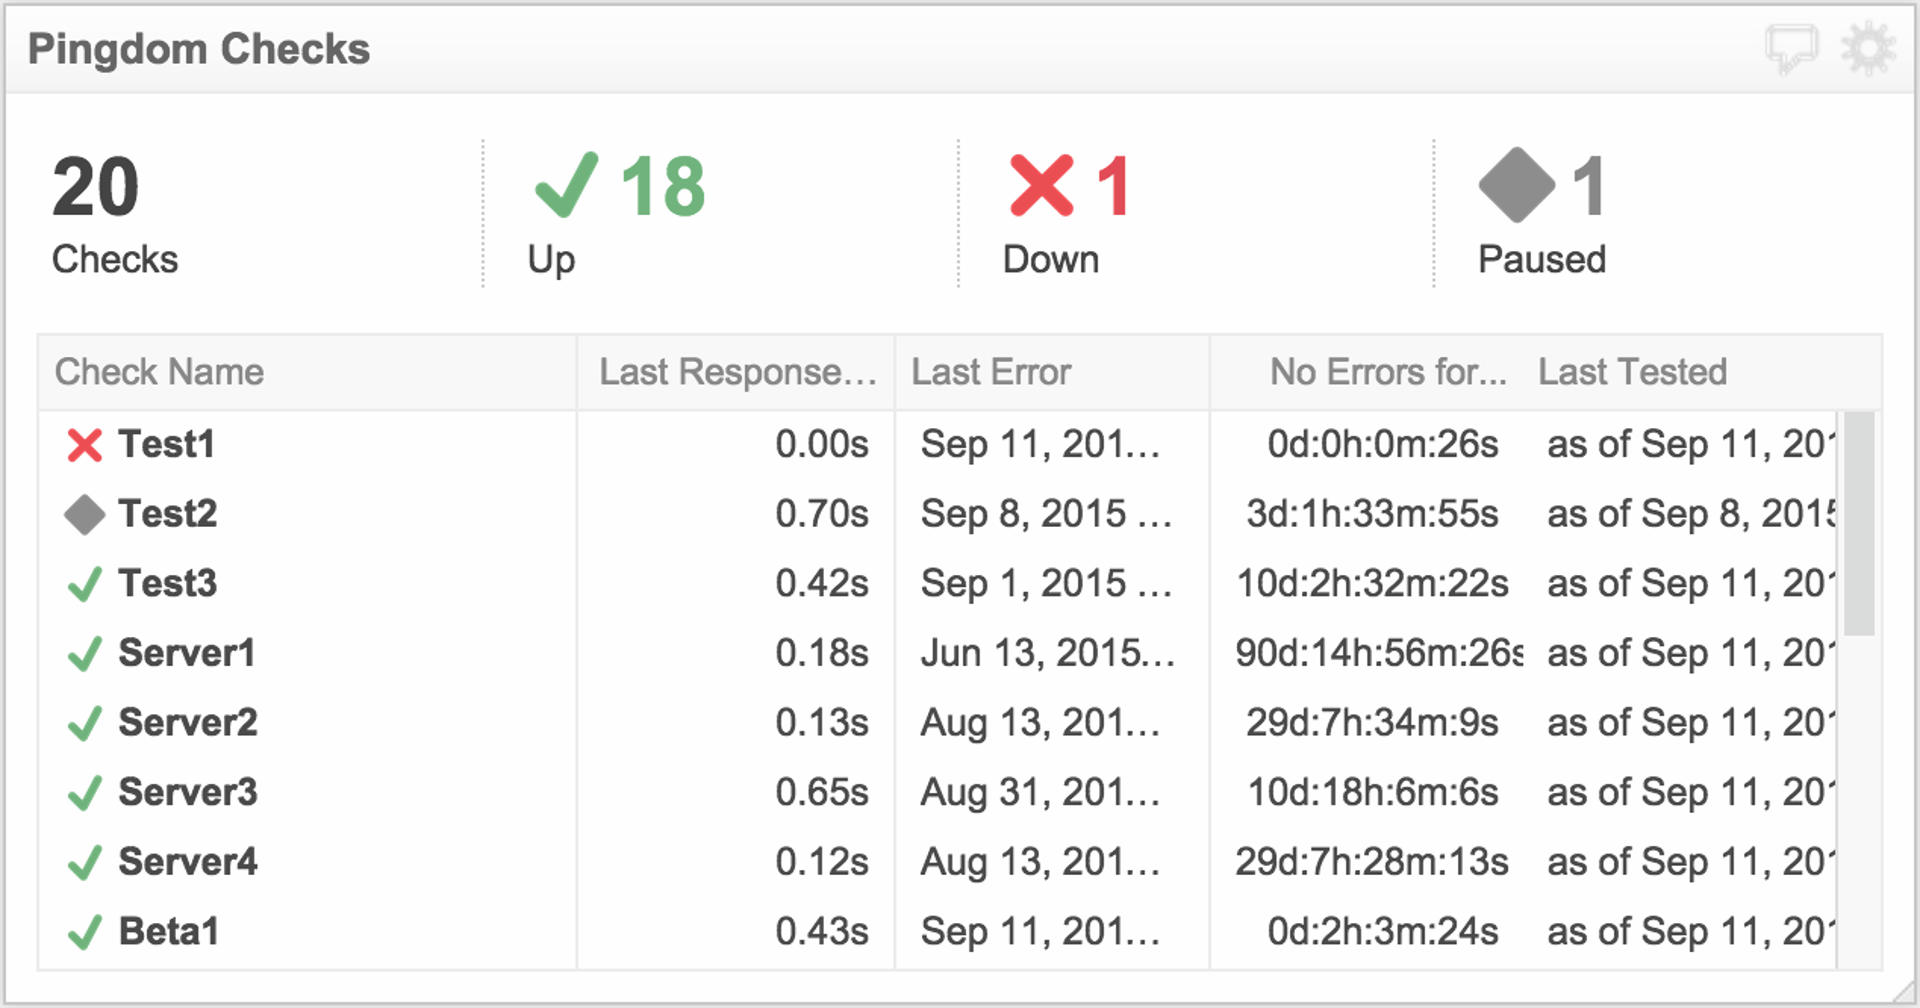
Pingdom Checks is a metric that tracks the number of server checks performed and their status: up, down, or paused. It gives your DevOps team and wider organization real-time visibility into website performance, helping you ensure users experience fast, reliable access.
What Pingdom Checks measures
This metric breaks down into four components:
- Checks: The total number of server checks performed during a given period.
- Up: Servers that passed their checks and are functioning properly.
- Down: Servers that failed their checks and are unavailable or experiencing issues.
- Paused: Servers that have been intentionally paused and are not currently being monitored.
Why Pingdom Checks matters
Website downtime costs money—lost sales, damaged reputation, and frustrated customers. By monitoring Pingdom Checks, you catch performance issues before they escalate. A high "Up" count relative to total checks signals healthy infrastructure. Frequent "Down" statuses alert you to problems that need immediate attention.
This metric is especially valuable for DevOps teams and technical leaders who need to demonstrate system reliability to stakeholders and respond quickly to outages.
How to interpret Pingdom Checks
Healthy state: The number of checks and the number of servers up are the same (or very close). This means all monitored servers are performing as expected.
Warning signs: A growing number of "Down" checks indicates infrastructure problems. Unexpected "Paused" checks might signal misconfiguration or maintenance issues.
Track Pingdom Checks on a dashboard
Once you've set benchmarks and targets for Pingdom Checks, establish a monitoring process. A dashboard centralizes this metric alongside other DevOps KPIs, making it easy to spot trends and respond to issues faster. Explore DevOps dashboard examples to see how teams visualize server health in real time.
Related Metrics & KPIs