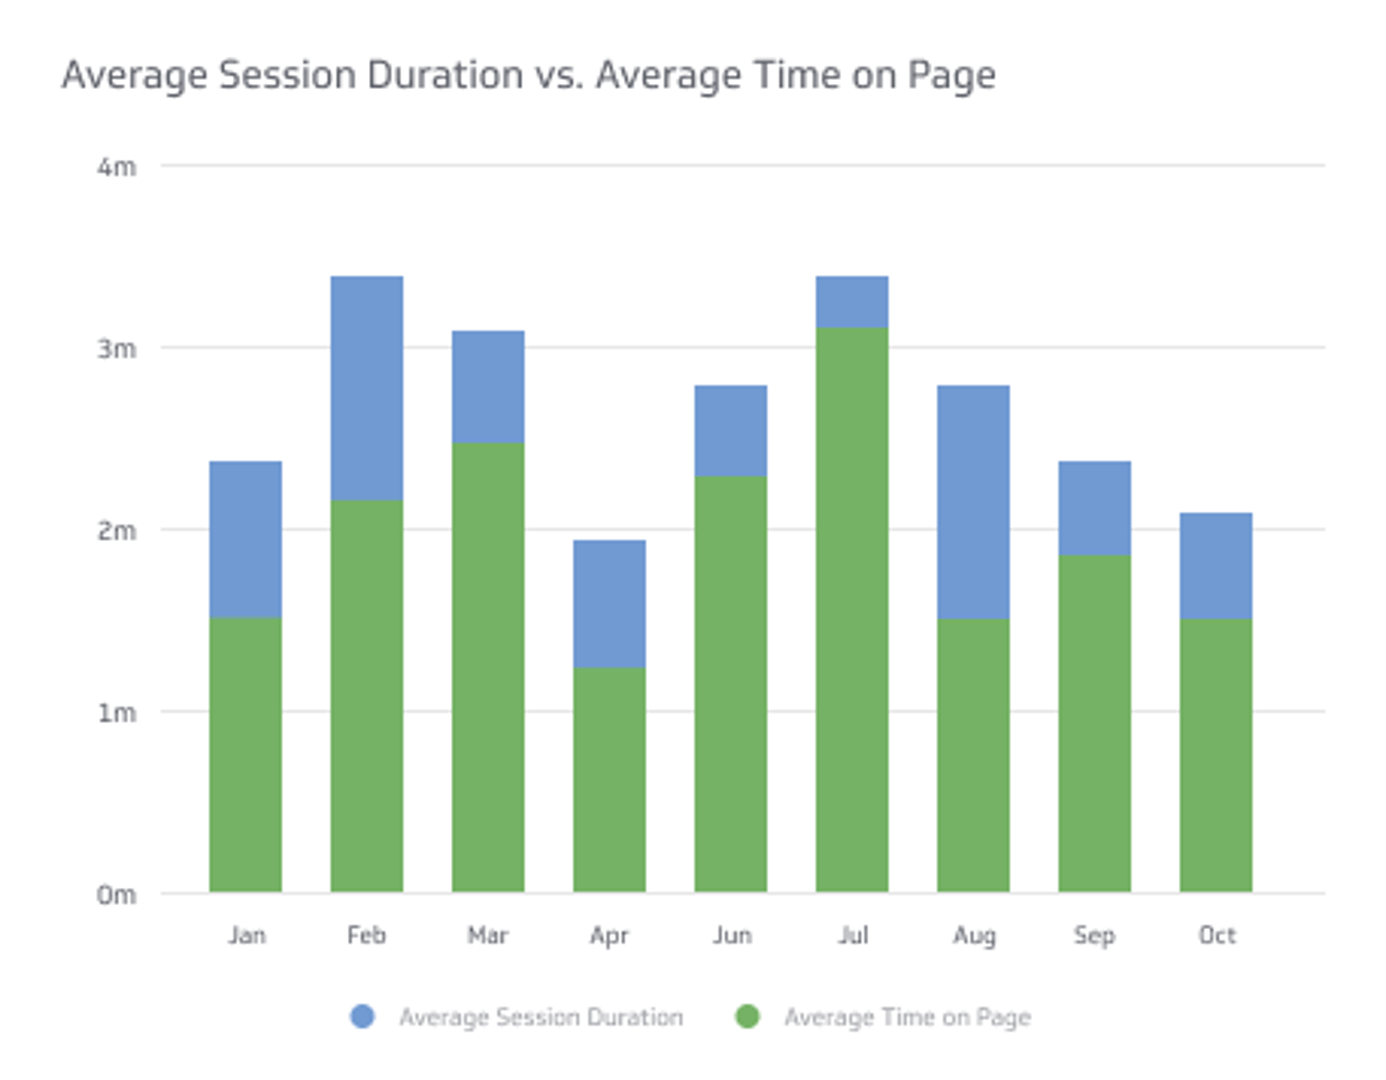
Avg. Session Duration vs. Avg. Time On Page
These metrics can provide insight into how long visitors are spending on a website and how engaged they are with the content.
Track all your Digital Marketing KPIs in one place
Sign up for free and start making decisions for your business with confidence.
When it comes to measuring the effectiveness of a website, two metrics that are commonly used are "Average Session Duration" and "Average Time On Page."
These metrics can provide insight into how long visitors are spending on a website and how engaged they are with the content. However, these metrics are not the same and have different implications.
Keep reading to explore the differences between average session duration vs average time on page and why they're both important in website analytics.
What Is Average Session Duration (ASD)?
Average session duration is a benchmark that measures the average length of time that visitors spend on a website. You calculate it by taking the total amount of time visitors spend on a website during a session and then dividing it by the number of sessions.
A session is a period of time when a visitor is actively engaged with a website. The session ends when the visitor closes the browser or is inactive on the website for a certain amount of time.
So, if your website experienced 10,000 sessions in March, and those sessions equated to 34,000 minutes, that means that the average session duration would be 3.4 minutes that month.
What Does ASD Tell You?
Average session duration provides a more comprehensive view of user engagement on a website than the average time on page does. It takes into account not only the time that users spend on individual pages but also the amount of time that they spend navigating between pages and engaging with the website as a whole.
A high average session duration can indicate that users are finding the website engaging and are spending a significant amount of time exploring its content.
However, it's important to keep in mind that average session duration can also be influenced by factors outside of user engagement, such as the amount of time that users spend reading or watching videos on the website.
Additionally, if a user spends a long time on a single page without interacting with the website in any other way, the time they spend on that particular page will count toward their session duration. However, that doesn't necessarily indicate that there was a high level of engagement.
If visitors are spending a long time on a website but they're not taking any action or engaging with the content, it could mean that they're having difficulty finding what they're looking for or they don't think the content is valuable.
How To Track Average Session Duration
Here are some steps you can take to track the Average Session Duration:
Install Google Analytics: Google Analytics is a free tool that provides valuable data about your website's traffic, including the average session duration. To use Google Analytics, you have to add the tracking code to your site after you sign up for an account.
Set up session tracking: For this step, you'll have to set up session tracking in Google Analytics.
Calculate the ASD: After you set up session tracking, you can calculate the Average Session Duration. To do this, go to the "Audience" section, and then "Overview Report" in Google Analytics. This report will show you the average session duration for your website.
Analyze the data: After you calculate the Average Session Duration, you can analyze the data to get a better understanding of user engagement on your site. For example, if you notice that visitors are spending very little time on your website, you might want to re-evaluate the content to make it more engaging.
How To Improve Average Session Duration
Improving the Average Session Duration can lead to increased conversions, higher engagement, and a better user experience.
Here's how you can increase the ASD on your website:
High-quality content: The quality and relevance of your content are some of the most important factors in keeping visitors engaged with your website. Make sure your content is well-written, informative, and adds value to your visitors. Consider using visuals such as images, videos, and infographics to make your content more engaging.
Optimize your website for speed: A slow-loading website can be frustrating for visitors and cause them to leave your website quickly. Optimize your website by minimizing the size of your images, enabling caching, and using a content delivery network (CDN) to improve loading speed.
Improve website navigation: Guests are more likely to stay on your website for longer periods if they can easily find the information they're looking for. Use clear and concise navigation menus, and make sure your website's structure is easy to follow.
Encourage website exploration: Include internal links to related content on your website to encourage visitors to explore more. You can also use related posts, categories, and tags to help them find relevant content.
Use interactive content: Interactive content such as quizzes, surveys, and games can be a fun way to keep visitors engaged with your website. Interactive content can also be an effective way to collect information such as visitor preferences.
Make your website mobile-friendly: More and more people are accessing websites on their mobile devices, so it's essential to ensure your site is optimized for mobile devices. A mobile-friendly website is more likely to keep visitors engaged and improve the Average Session Duration.
Use social proof: Social proof, such as customer reviews and testimonials, can be a powerful way to keep people engaged with your website. Displaying social proof can help to build trust and credibility with your visitors, encouraging them to stay on your website for longer periods.
What Is Average Time on Page (ATP)?
Average Time on Page (ATP) is a standard that measures the average amount of time that users spend on a single page of a website. This digital marketing metric is calculated by dividing the total amount of time that all users spent on a page by the number of users who viewed that page.
For example, if 100 users viewed a page and their total time spent on the page was 700 seconds, the average time on page for that page would be seven seconds.
Average Time On Page can provide insights into the quality and relevance of individual pages on a website. If users are spending a lot of time on a particular page, it could indicate that the content on that page is engaging and useful.
On the other hand, if they're quickly leaving a page after only a few seconds, it might mean the content is not meeting their needs or expectations.
However, remember that Average Time On Page can be misleading in certain situations. For example, if a user spends a long time on a page but then closes their browser without visiting any other pages on the website, their time spent on that page will not be counted towards their session duration.
Additionally, if a user leaves a page open in their browser and then goes to do something else, their time spent on the page will continue to accumulate even though they are not actively engaging with the page.
ATP can be affected by factors such as the length of the content on the page, the readability of the content, and the layout of the page.
How To Track Average Time on Page
Here are some steps you can take to track the Average Time On Page:
Install Google Analytics: To use Google Analytics, you will need to sign up for an account and add the tracking code to your website.
Set up events: In order to track the ATP, you have to set up events in Google Analytics. Events are actions that users take on your website, such as clicking a link or filling out a form. By setting up events, you can track the time that users spend on each page.
Calculate the ATP: Once you set up events in Google Analytics, you can calculate the ATP. Go to the "Behavior" tab, then "Site Content" and "All Pages" report in Google Analytics. This report will show you the Average Time On Page for every page on your website.
Analyze the data: After you have calculated the Average Time On Page, you can analyze the data to understand the behaviors of your visitors.
For example, if you notice that visitors are spending very little time on a particular page, you might want to change the content on that page to make it more engaging.
How to Improve Average Time on Page
It's critical to improve the Average Time On Page for better engagement and to reduce bounce rates.
Here's how you can improve the ATP for your website:
Create high-quality content: This step is the same despite trying to understand Average Session Duration vs Average Time On Page. Relevant and engaging content will always reign supreme when you're searching for excellent engagement results.
Easy site navigation: A website that's easy to navigate makes it more likely for visitors to stay on your website longer. Use clear and concise navigation menus and include a search bar to help visitors find what they're looking for.
Use images and videos: Including images and videos on your website can help to break up text and make your content more engaging. Videos, in particular, can be very effective in keeping visitors on your website for longer.
Add internal links: Including internal links to other pages on your website can help to keep visitors engaged for longer by directing them to different places on the same site. Internal links can also help people find related content and improve the overall user experience.
Improve page load speed: Slow loading speeds can be annoying. Visitors are more likely to leave if they feel like they're waiting too long to see the content. Optimize your website for speed by using a CDN, making your images smaller, and enabling cache.
Use clear and concise headlines: Clear and concise headlines can help people understand what your page is about and encourage them to read more. Use headlines that accurately describe the content on the page, and make sure they're visually distinct from the body text.
By implementing these tips, you can improve the ATP of your website, keeping people not only on your site but they'll come back for more, which increases the chances of conversion.
Differences: Average Session Duration vs. Average Time on Page
While both Average Session Duration and Average Time On Page tell the website host about user engagement, they're different metrics that measure different aspects of the user's behavior.
ASD measures the length of time that people spend on a website as a whole. It provides an overall view of user engagement and how well a website meets the needs of its visitors.
ATP measures the length of time that visitors spend on a specific page of a website. It tells you how engaging a particular page is, and whether visitors are finding the content in that section valuable.
One primary difference between the two metrics is that ATP is only calculated for single-page visits, while ASD is calculated for all visits.
This means that Average Time On Page might not be reliable for websites that have a high bounce rate, where users often stop viewing after just one page.
In contrast, Average Session Duration takes into account all user sessions, regardless of how many pages were visited, providing a more well-rounded picture of user engagement.
Another crucial difference is that Average Session Duration can be affected by external factors outside the website owner's control.
The Importance of Measuring Engagement
Measuring visitor engagement is vital for understanding how well a website is performing and whether users find the content intriguing. By measuring Average Session Duration and Average Time On Page, website owners and marketers can learn visitor behavior and make data-driven decisions to improve the user experience.
However, keep in mind that these metrics should not be viewed in isolation. They should be used in conjunction with one another and other analytics results as well.
Both ASD and ATP have their limitations. For example, Average Session Duration can be skewed by users who leave a page open in their browser without actively engaging with it. Similarly, Average Time On Page can be affected by users who navigate away from a page without actually reading its content.
Final Thoughts: Which Metric Should I Use?
Regarding Average Session Duration vs Average Time On Page, you can choose either component to learn more about your website.
If you want to understand how people perceive the quality and relevance of individual pages on your website, then Average Time On Page can be more useful to you. You can use it to identify pages that are performing well and pages that might need improvement.
If you want to learn more about overall user engagement and the effectiveness of your website in keeping people interested in what you have to offer, then Average Session Duration can give you a better idea about your users.
Ultimately, it depends on your website's goals and the type of content you're producing. If you have a website with multiple pages and your goal is to keep users engaged throughout their entire visit, then Average Session Duration may be the more relevant metric.
On the other hand, if you're producing content that's meant to be consumed on a single page (such as a blog post), then Average Time On Page may be a better indicator.
Both Average Session Duration and Average Time On Page are critical to track when it comes to understanding how people engage with your website. However, remember that they both have limitations.
Related Metrics & KPIs