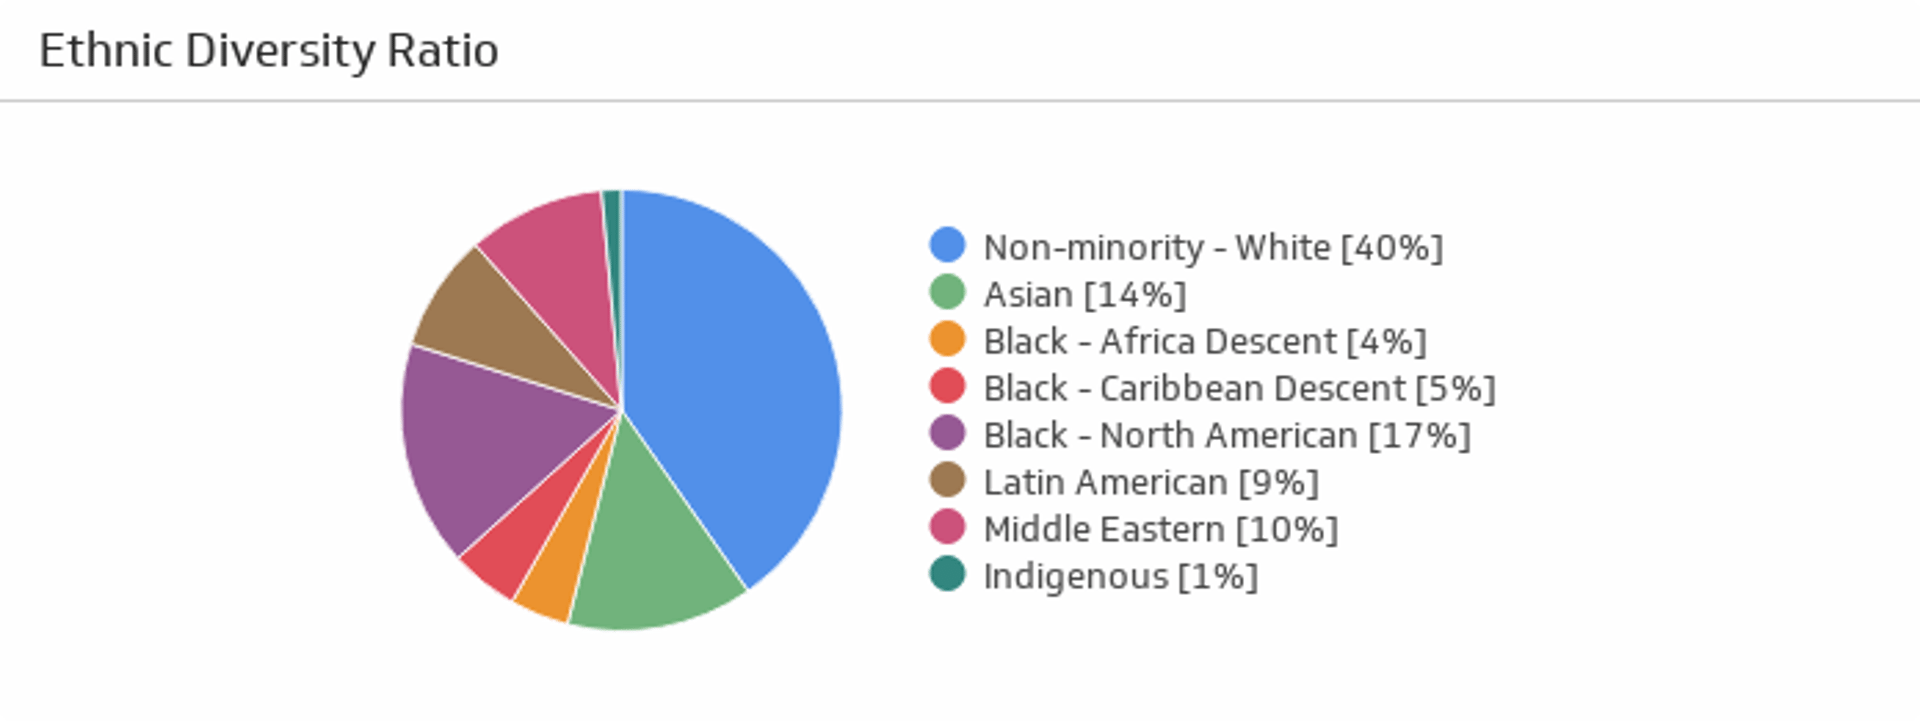
Ethnic Diversity Ratio Metric
Track the diversity of your company’s workforce.
Track all your HR KPIs in one place
Sign up for free and start making decisions for your business with confidence.
Overview
The Ethnic Diversity Ratio metric gives you valuable insight into a major aspect of your company. Ethnic diversity brings in multiple different perspectives to improve business ideas and processes, and strengthens your company’s branding.
Formula
Number of minority employees/Total number of employees
Reporting frequency
Quarterly
Example of KPI target
40% minorities
Audience
CEO, HR Head, Recruiters
Variations
Organizational ethnic diversity ratio
Important considerations
Define terms carefully and use self-identified, voluntary data collection. Follow local laws and respect privacy. Focus on representation across levels, not just company-wide totals.
How to calculate it correctly
- Use self-identification. Do not infer or guess. Allow employees to select multiple identities or “prefer not to say.”
- Compute representation. Calculate the share of under-represented groups overall and by level, function, and location.
- Track hiring and promotion flows. Report candidate slate mix, offer acceptance, and promotion rates.
Data you need
- Voluntary self-ID data with clear categories and definitions
- Employee master data with level, function, and location
- Recruiting funnel data for pipeline analysis
How to improve representation
- Broaden sourcing. Partner with communities and programmes that expand access.
- Structure hiring. Standardize interviews and rubrics to reduce bias.
- Invest in growth. Provide sponsorship and equitable access to stretch roles.
- Measure progress. Publish goals and show quarterly movement.
Track diversity in Klips
- Connect HRIS and ATS. Bring in employee and candidate data with appropriate access controls.
- Model metrics. Calculate representation by level and function, plus hiring and promotion flows.
- Visualize. Add a composition chart, a funnel for recruiting, and a trend line for progress.
- Govern access. Restrict PII and share only aggregated views where appropriate.
Common pitfalls
- Company-wide only views. Aggregates can hide gaps at leadership levels.
- Small sample noise. Suppress or roll up categories when counts are very low.
- Unclear definitions. Publish category definitions and update when regulations change.
Related metrics
- Gender representation
- Promotion rate by level
- Offer acceptance rate
Track these KPIs in Klips. Build a secure dashboard with limited access for leaders who need it.
Related Metrics & KPIs