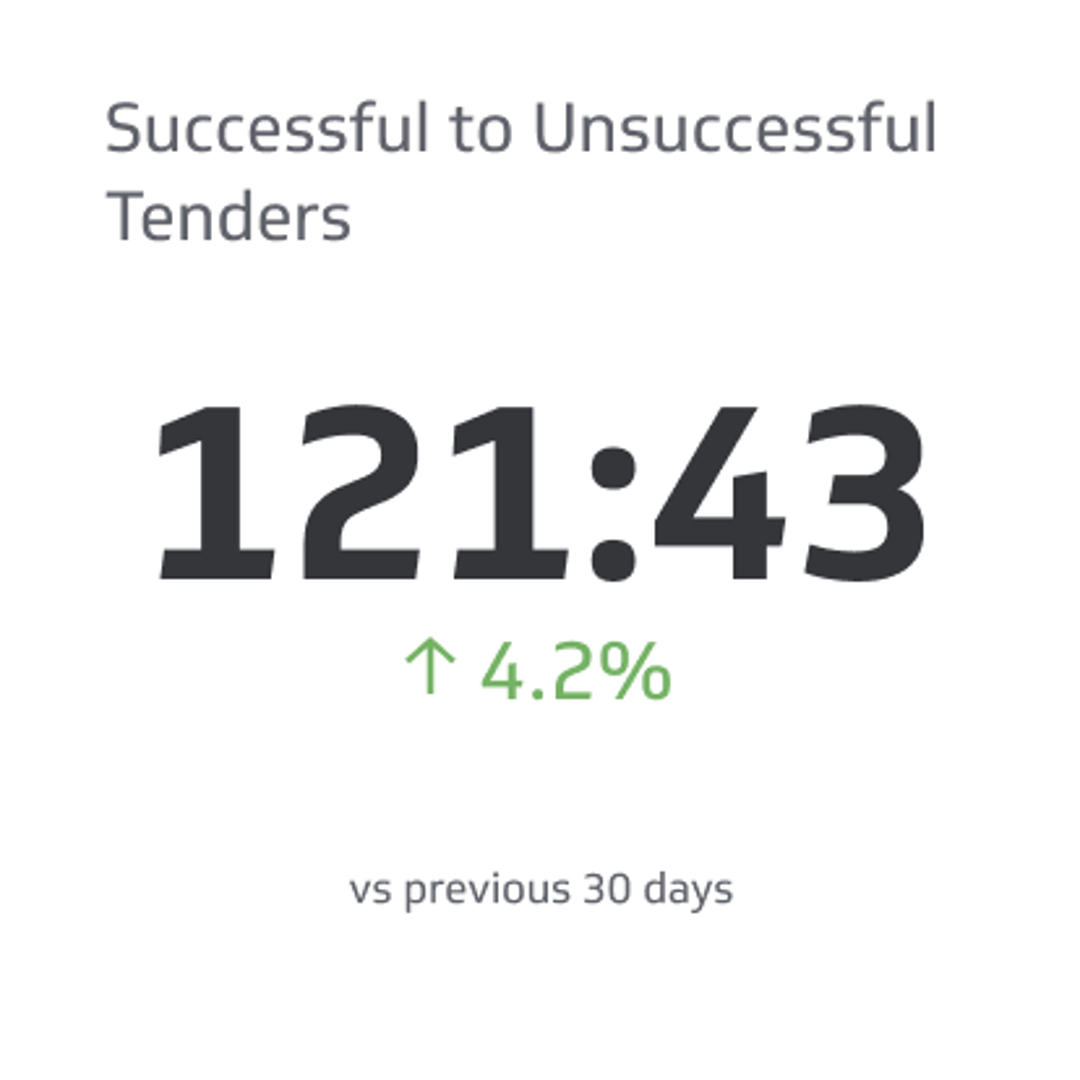
Tender Win Rate Metric
Measure the ratio of successful bids or offers to unsuccessful bids or offers.
Track all your Sales KPIs in one place
Sign up for free and start making decisions for your business with confidence.
Overview
A Successful to Unsuccessful Tenders ratio measures how many bids or proposals your business wins compared to those you lose. This KPI reveals the health of your sales pipeline and the effectiveness of your tendering process.
For professional services firms—accounting, legal, consulting, and construction companies—tracking this ratio is essential. It shows whether your proposals are competitive, your pricing is aligned with market expectations, and your team is pitching effectively.
Why this metric matters
Your tender success rate directly impacts revenue predictability. A low ratio signals problems: weak proposals, poor qualification of opportunities, or pricing misalignment. A high ratio suggests strong market positioning and effective sales execution.
When you monitor this metric regularly, you can:
- Identify trends in which types of projects or clients you win most often
- Spot weaknesses in your proposal process or pricing strategy
- Forecast revenue more accurately based on pipeline activity
- Allocate resources to the most promising opportunities
- Benchmark performance against your own historical data and industry standards
How to calculate Successful to Unsuccessful Tenders
The calculation is straightforward:
Successful to Unsuccessful Tenders Ratio = Tenders Won / Tenders Lost
Or, express it as a percentage:
Win Rate (%) = (Tenders Won / Total Tenders Submitted) × 100
Example: If your firm submitted 50 tenders in a quarter and won 16 of them, your win rate is (16 / 50) × 100 = 32%.
You can also track the inverse—your loss rate—to understand where opportunities are slipping away.
What's a good target?
Industry benchmarks vary widely by sector. A 25–35% win rate is typical for professional services and construction. However, your own baseline matters most. If your historical win rate is 20%, improving to 25% represents meaningful progress.
Set targets based on:
- Your company's historical performance
- Competitor benchmarks (if available)
- Your growth ambitions and pipeline capacity
- The complexity and value of tenders you pursue
Key factors that influence this ratio
Proposal quality: Clear, tailored proposals that address the client's specific needs win more often than generic submissions.
Pricing strategy: Underpricing wins deals but erodes margins. Overpricing loses them. Test your pricing against wins and losses to find the sweet spot.
Team expertise: Demonstrating relevant experience and case studies builds confidence in your ability to deliver.
Qualification discipline: Pursuing only tenders where you have a genuine competitive advantage improves your win rate faster than chasing every opportunity.
Bid process efficiency: A streamlined process ensures proposals go out on time and reflect your best work.
Market conditions: Economic downturns, seasonal patterns, and competitive intensity all affect win rates.
How to improve your ratio
Review lost tenders: Ask clients why you didn't win. Was it price, capability, timeline, or trust? Use this feedback to strengthen future proposals.
Strengthen your proposal process: Develop templates, refine your messaging, and ensure every proposal is reviewed before submission.
Focus on qualification: Pursue fewer opportunities with higher win probability rather than submitting to every tender.
Build case studies: Document your successes and use them to demonstrate capability to prospective clients.
Track metrics by type: Win rates often vary by project size, industry, or service line. Identify your strengths and double down.
Invest in relationships: Pre-tender relationship building increases win rates. Engage with prospects before they issue formal tenders.
Reporting frequency and audience
Reporting frequency: Monthly or quarterly, depending on tender volume.
Key stakeholders: CFO, Sales Manager, Business Development Lead, Practice Manager.
Related metrics: You should also monitor average tender value, proposal turnaround time, and cost-to-bid ratio to understand the full picture of your tendering effectiveness.
Variations of this metric
- Win rate by service line: Track success separately for each service you offer.
- Win rate by client type: Compare performance across different industries or company sizes.
- Average time to win: Measure how long the sales cycle typically takes from tender issue to contract signature.
- Tender pipeline value: Calculate the total value of active tenders in your pipeline, weighted by win probability.
Tracking this metric with dashboards
Manual tracking of tender data—spreadsheets, email archives, or disconnected systems—makes it easy to miss trends and slows decision-making. A centralized dashboard automatically aggregates tender data from your CRM or project management system, giving you real-time visibility into your win rate, pipeline health, and performance trends.
With the right dashboard, you can:
- View win rates by service line, client type, or sales rep at a glance
- Set targets and track progress toward quarterly or annual goals
- Identify which proposal strategies correlate with wins
- Share performance data with stakeholders in a format that drives action
Whether you use Klipfolio or another analytics platform, the key is consistency: define what counts as a tender, track outcomes consistently, and review the data regularly with your team.