

Summary - Parcero is a leading marketing agency that turned to Klipfolio Klips to automate client reporting and save hours of manual work.
Case: Parcero Marketing Agency
Automation of repetitive tasks helps agencies stay competitive. It frees time for higher-value work like analyzing data and improving ad campaigns based on real insight.
There are 3 different key report types:
- Ad-hoc analyses
a) Used to improve week-to-week ad campaigns
b) Data collection can be automated; interpretation cannot - Summary reports
a) Summaries of marketing efforts on a monthly basis
b) 100% automation is achievable here - Insight reports
a) Information that supports strategic decision-making
b) Data collection can be automated; interpretation cannot
Ad-hoc analyses are created on demand and tend to vary. They are also harder to automate. Examples include ad performance analyses and keyword-level performance analyses.
Summary reports can include campaign reports or monthly channel performance reports.
Insight reports are created on demand, for example, yearly marketing reviews, product performance reports, and yearly marketing channel performance reports.
Dynamic real-time dashboards complement static PDF reports. In digital marketing, teams expect real-time dashboards.
Real-time dashboards let clients and agencies track campaign performance daily and spot issues quickly.
Why Parcero selected Klipfolio Klips
Klipfolio Klips dashboard and reporting software shines when there are many data sources, channels, and ad campaigns, each with different monitoring needs.
Parcero evaluated three dashboard tools: Tableau, Klipfolio Klips, and Looker Studio. The team used 12 criteria to compare them.
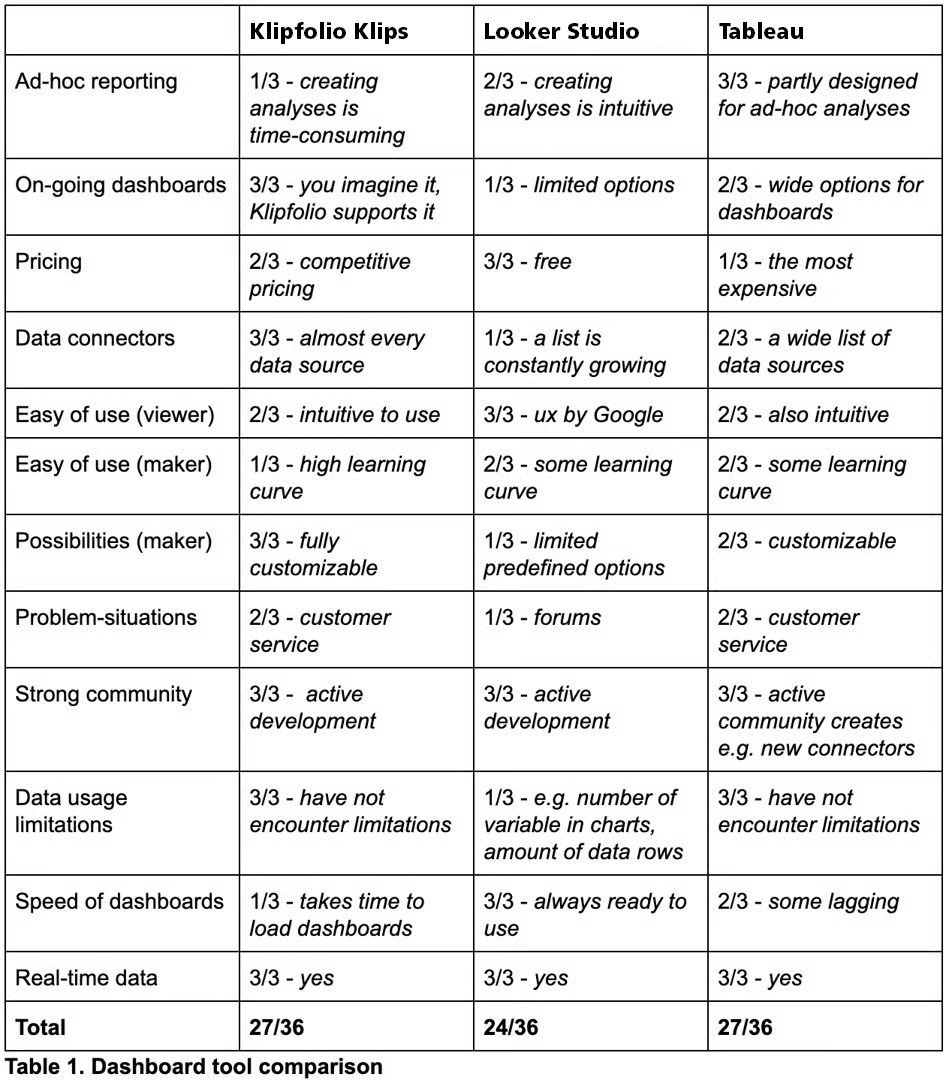
The results were close.
The primary requirement was to create ongoing reporting dashboards for multiple clients that could be fully customized if a customer had special requests. Klipfolio Klips matched that need.
Why relying only on Google Analytics isn’t enough
Several clients focused on building a presence on social media. Google Analytics alone wasn’t the best tool for that. Also:
- Not every client has a website or prioritizes a social presence.
- Google Analytics only supports click attribution.
Built-in social media analytics also support view attribution. Sometimes viewing an ad is as important as clicking it (read more about click vs. view attribution). - Google Analytics is developed by Google, so it may not represent competitors’ data in the same way.
Google Analytics samples data, which means you don’t own the clickstream data that enables deeper analysis (read more about clickstream data).
“One dashboard to rule them all”
Different clients have different reporting needs. Klipfolio Klips enabled Parcero to build fully customized reporting dashboards based on each client’s goals.
Advantage #1: client-specific metrics
A crucial first step in any reporting project is selecting relevant metrics. A good rule of thumb for key performance indicators (KPIs) is that changes in these metrics should trigger a specific action.
When building a dashboard across multiple marketing channels, use cross-channel metrics. That lets you compare performance between channels, for example, impressions, CPM, clicks, CPC, CTR, and spend.
Advantage #2: situation overview
Companies use several marketing channels and tools like CMSs, Google Analytics, and Meta reporting. When data sits in multiple places, it’s hard to get an all-in-one view of the current situation.
Klipfolio Klips dashboards provided a clear, centralized picture.
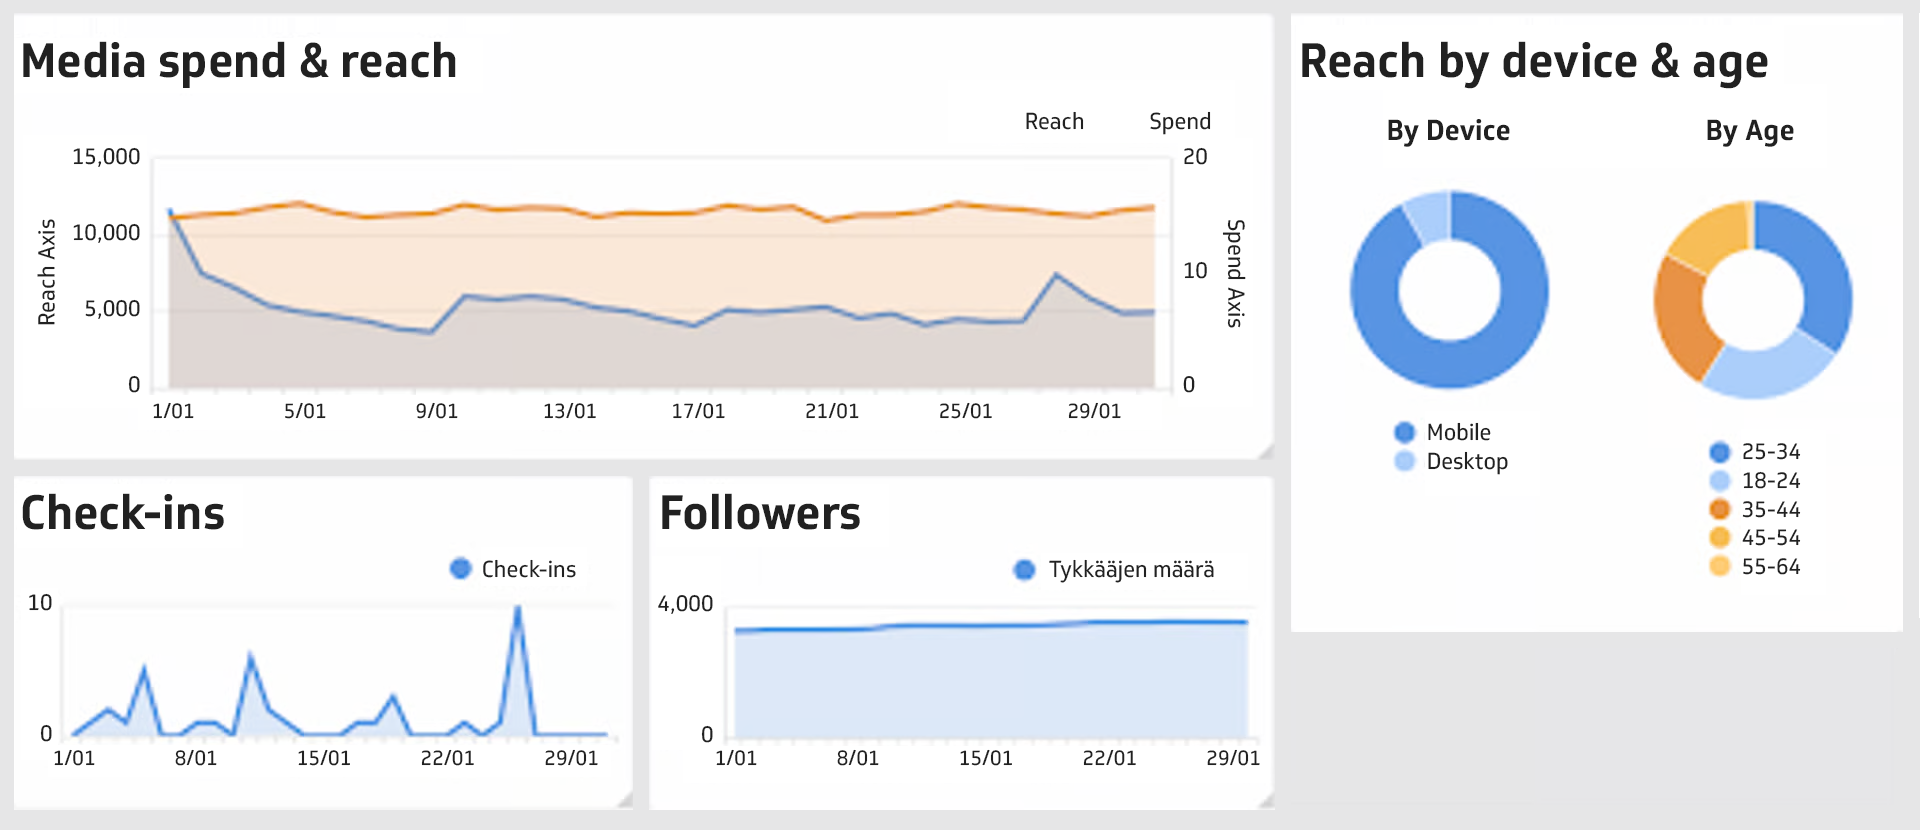
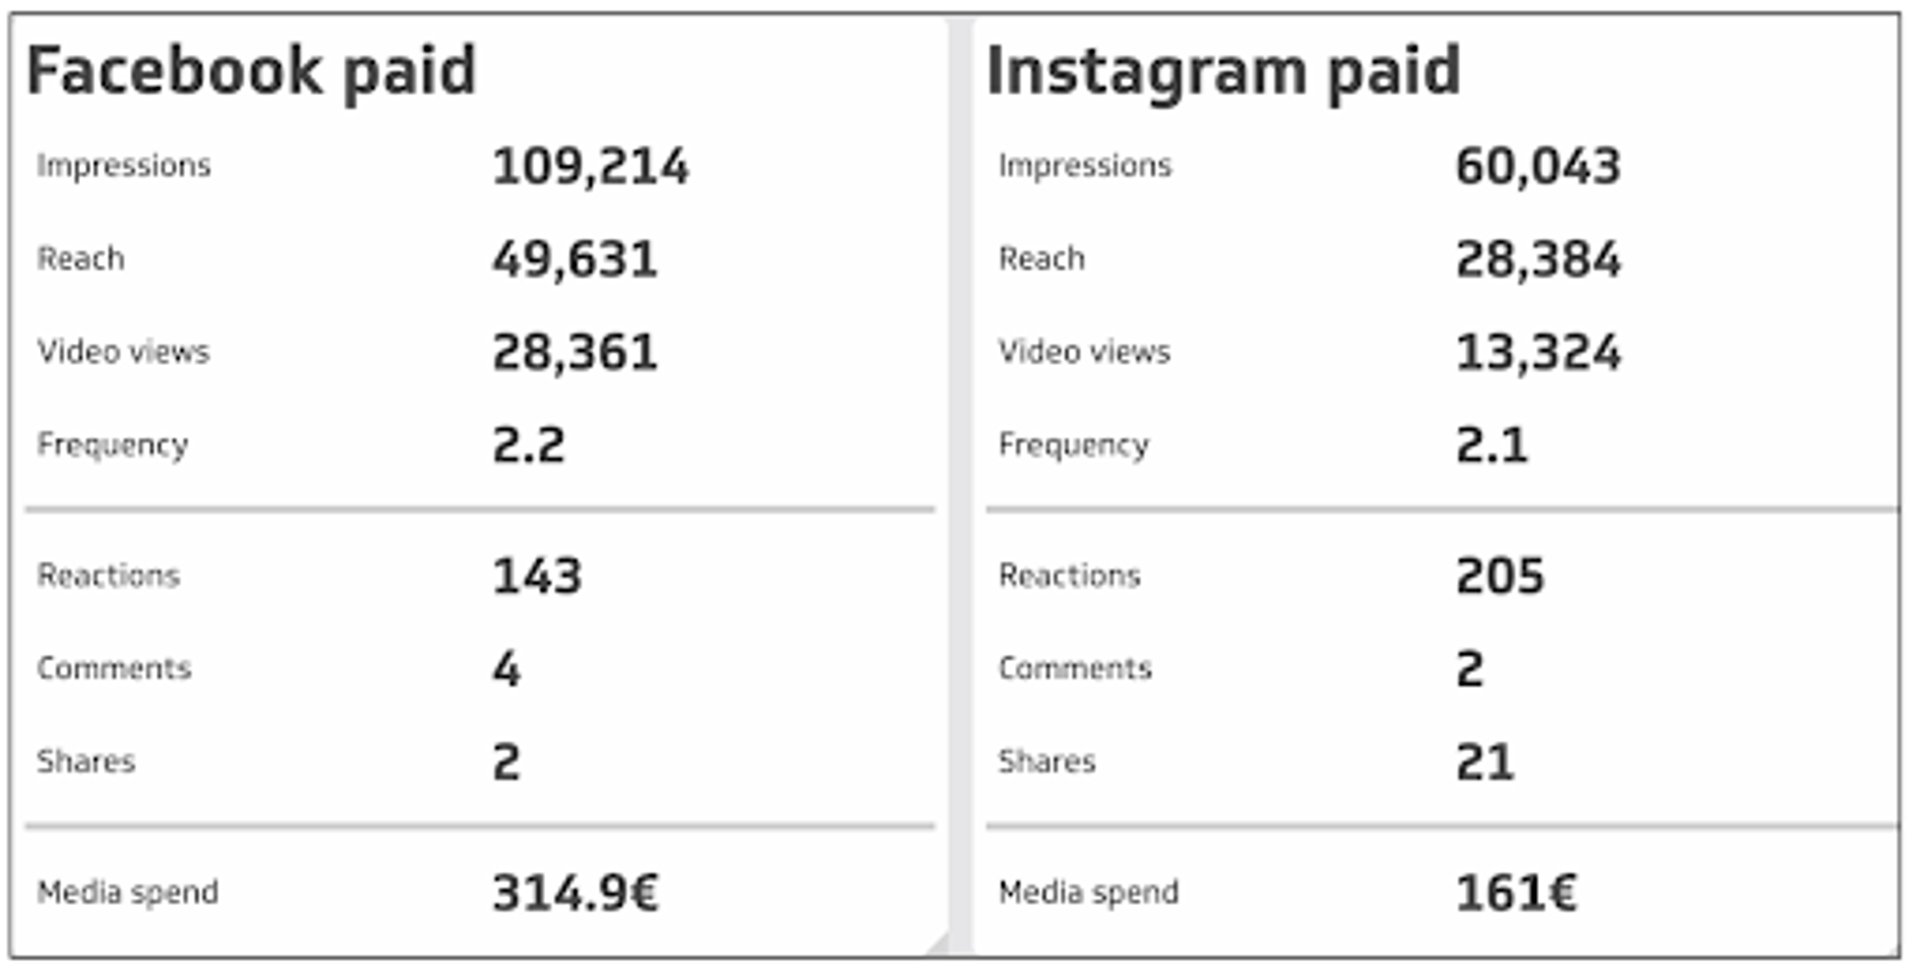
The dashboard example above is from the restaurant industry. The main requirement was to track social media performance.
Within social media reporting, focus on:
- How content reaches the target group
- Whether the target group is reacting by visiting the restaurant
- Whether long-term interest is growing (follower count)
For eCommerce, needs differ. eCommerce metrics often include total conversions, conversions by channel, and cost-per-conversion.
Align the dashboard with each customer’s specific needs.
Advantage #3: customized visualizations
Klipfolio Klips lets you create customized graphs and charts. Multiple data sources can be aggregated and presented in one visualization.
Below is an example of a Klip that shows two conversion types as columns and spend as a trend line.
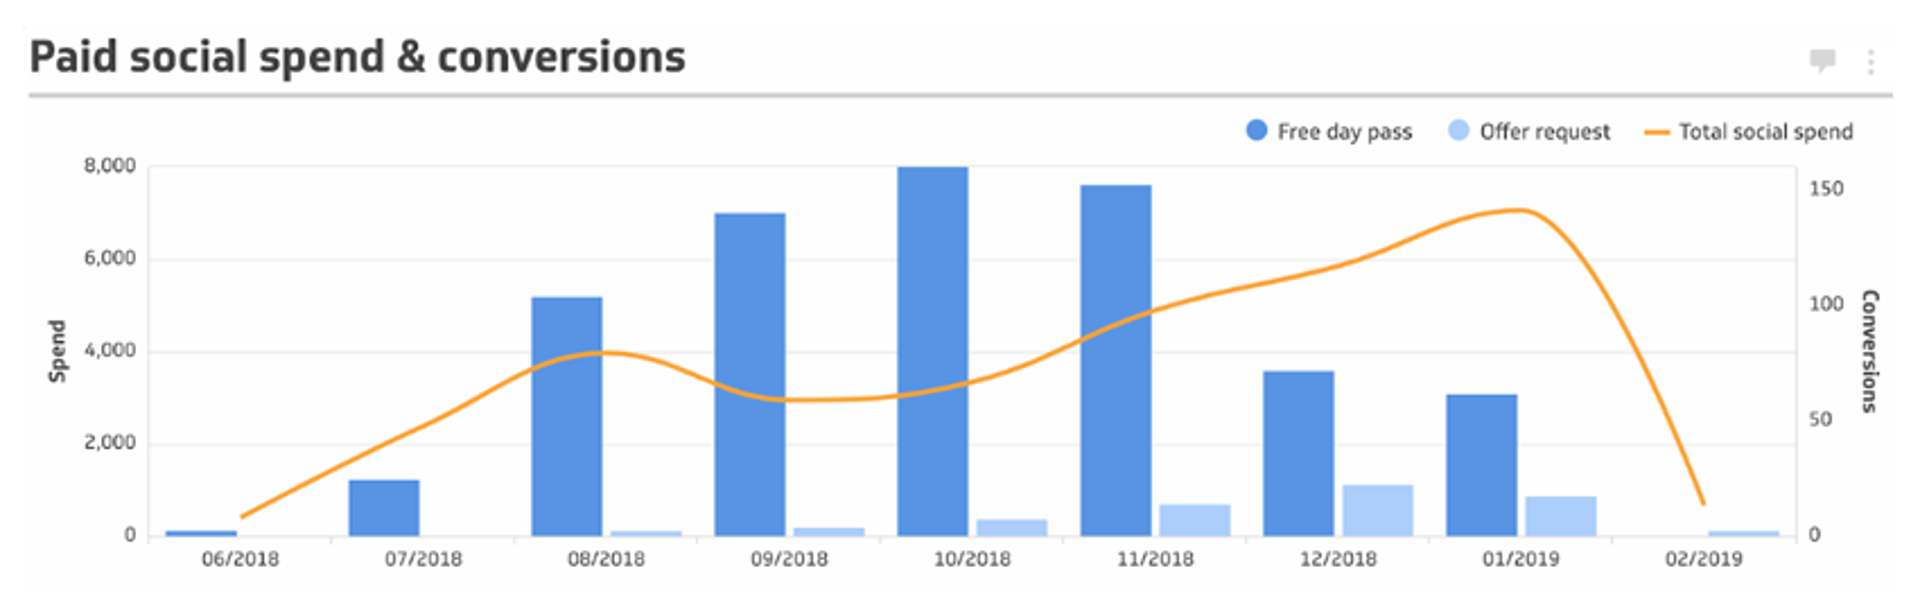
Unique visualizations take time, and the payoff is clear. Strong visuals show how the situation is developing and how to respond.
Advantage #4: real-time results
Real-time results let you monitor performance daily instead of only weekly or monthly. In fast-moving eCommerce, that matters.
Use real-time data to make agile decisions, for example, how to allocate budget across marketing channels.
A data-driven mindset across clients and agencies improves communication and outcomes.
Focusing on dashboard reporting can influence the whole business by helping people make better decisions.
Key Result: 40% time savings on repetitive tasks
In a study, 82% of respondents said that marketing automation could be done more efficiently. Aligned with this, Parcero launched a reporting automation initiative. Strategist Heikki Kyllönen put it this way:
“We need to take this automation talk and put it into practise. It is the only way to stay competitive in the field of digital marketing in the future.”
Previously, after a client briefing, target groups were chosen based on the briefing and expert opinion. Marketer intuition carried a lot of weight.
After automating reporting, the team changed how it uses data. The image below shows the before-and-after shift:
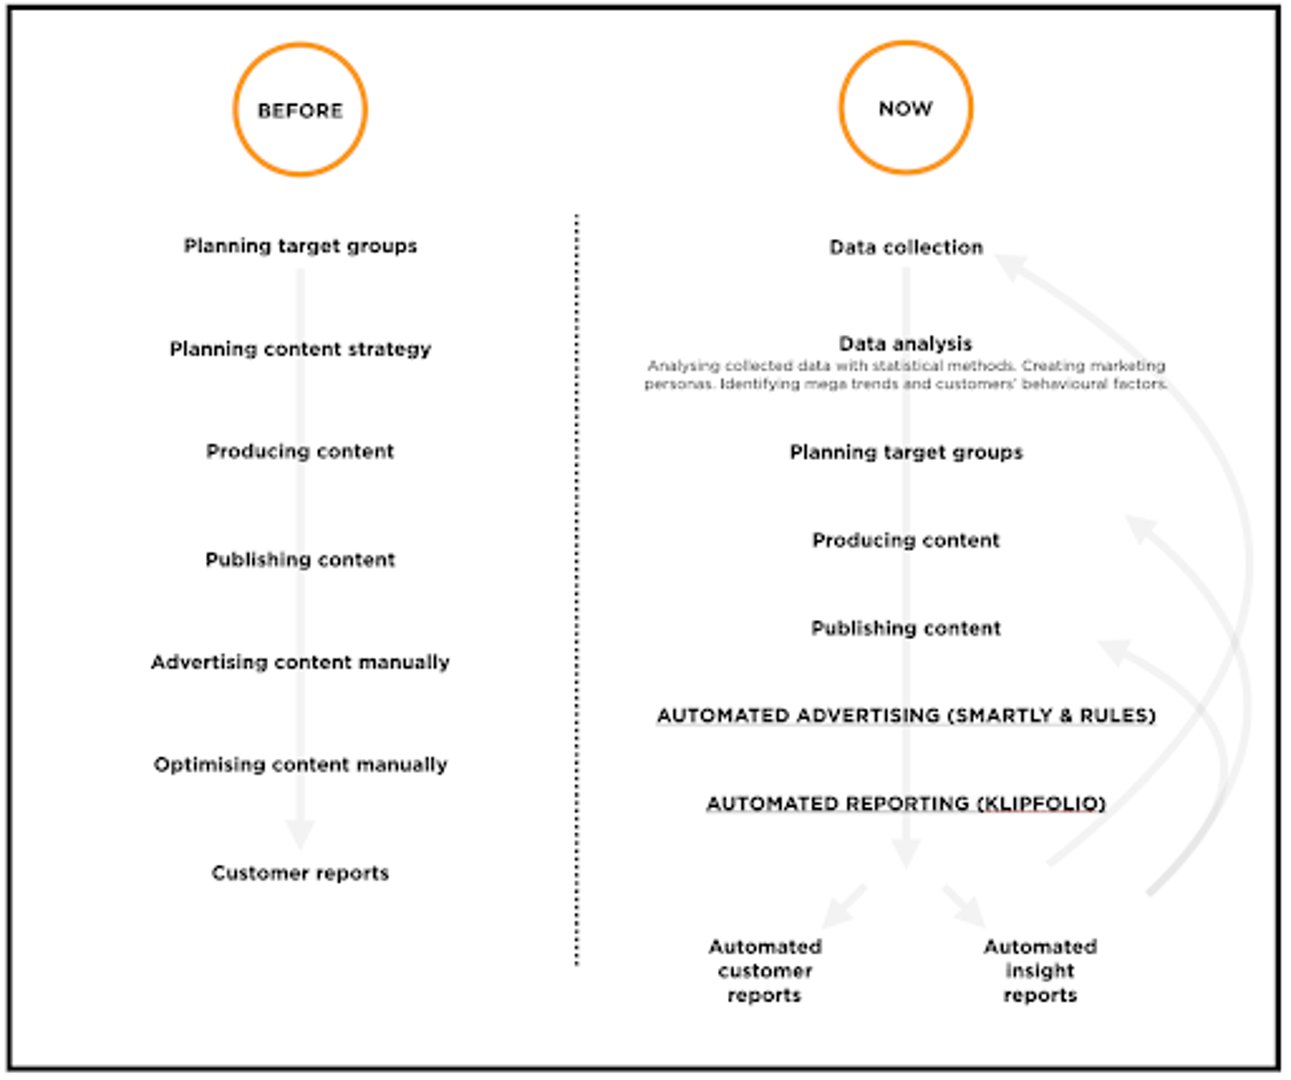
Here are the numbers:
- 33% time savings in repetitive advertising tasks
- 73% time savings in repetitive reporting tasks
- 2x time spent on data analysis and planning
Automation improved work quality. The additional time spent on planning and communication shows up in the results.
Economies of scale also apply. Parcero serves 50+ clients, so automating small repetitive tasks across all accounts led to major time savings.
5 key takeaways
Reporting automation frees time for more productive tasks. Not everything can be automated, and human judgement still matters.
Benefits observed:
- Full transparency: clients can check 24/7 how campaigns are performing.
- Open communication: poor results aren’t hidden because the same KPIs are tracked each month.
- Goal orientation: business-critical metrics are used to improve marketing campaigns.
- Overall picture: all data is in one place, which makes the full picture clear at a glance.
- Data-driven mindset: everyone in the organization considers data before making decisions.
Related Articles
6 Facebook ads reports every agency needs to attract and retain high-ticket clients
By Tanya Brody — April 10th, 2026
Klipfolio Partner How-To #1: Duplicating dashboards across client accounts
By Stef Reid — November 27th, 2025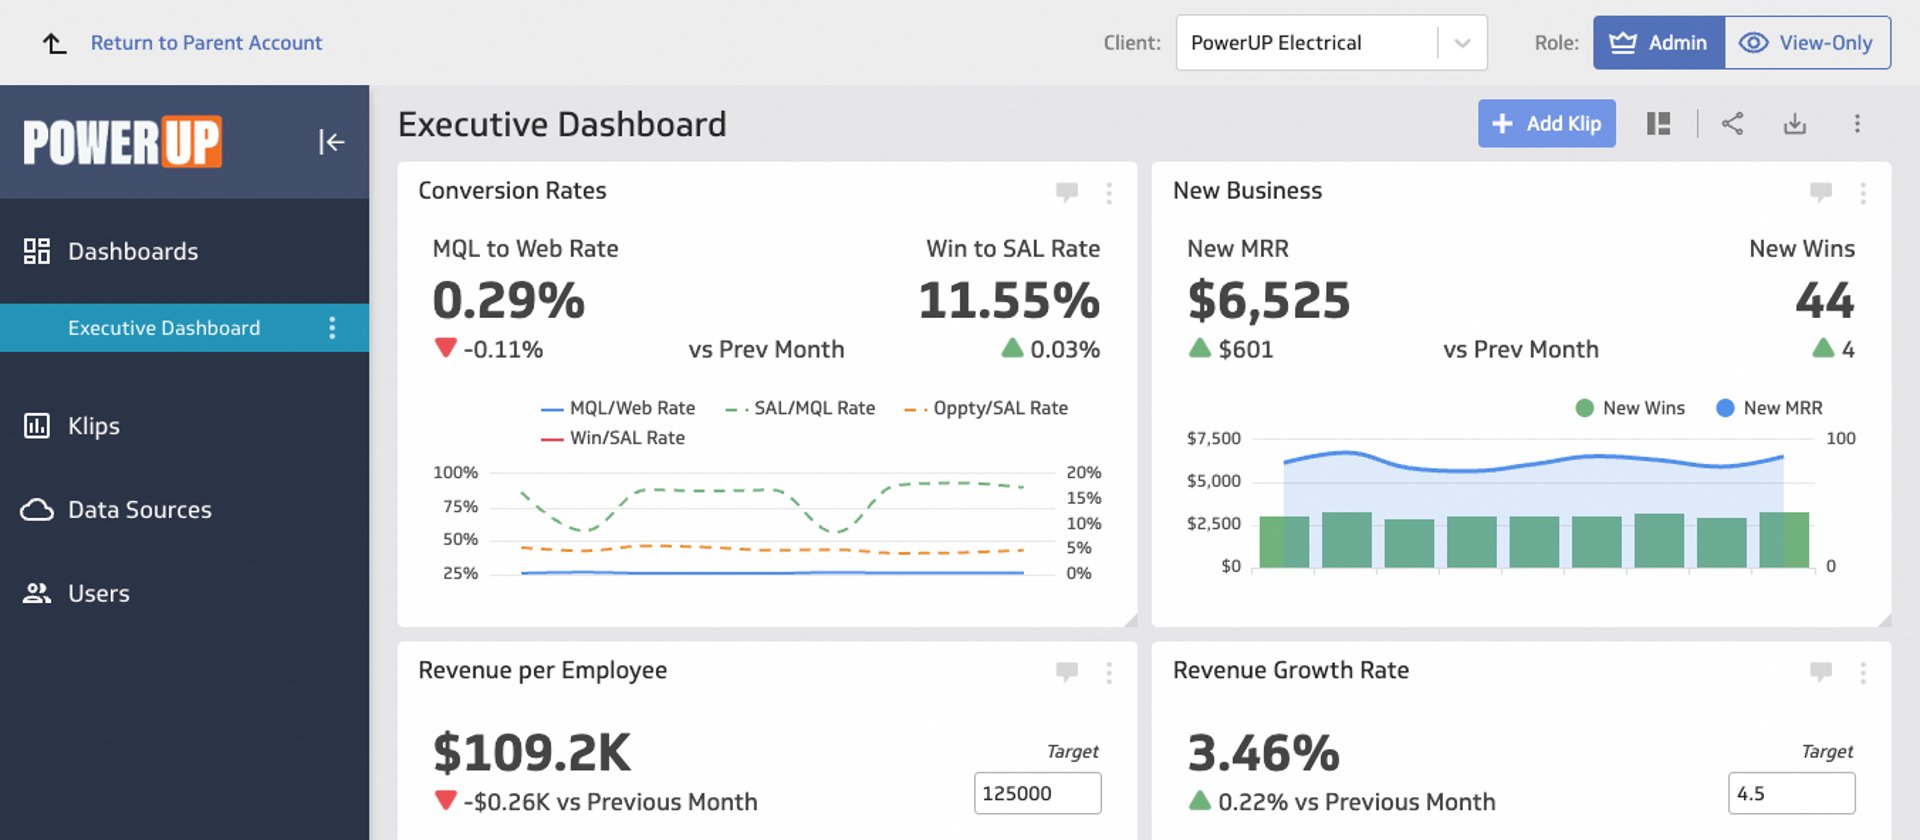
Client management in 5 steps
By Jonathan Taylor — November 26th, 2025