

Summary - Like all things, measuring email effectiveness involves identifying the right metrics. And, according to research from Demand Metric and Return Path, poorly defined metrics are one of the greatest challenges facing marketers today. Perhaps that’s because most default to tracking high-level metrics like open and click-through rates (CTRs)…
Like all things, measuring email effectiveness means picking the right metrics. According to research from Demand Metric and Return Path, poorly defined metrics are a major challenge for marketers. Many teams default to high-level indicators like open rate and click-through rate (CTR).
When you measure both copy and performance, open rate helps you assess subject lines, body copy, and, for inboxes like Gmail and Apple Mail, how your company logo renders.
Similarly, studying CTRs is a useful way to judge the quality of your email content. After all, the purpose of an email is to persuade the reader to take the action you suggest. The problem: not every team calculates click-through rate in a way that produces reliable insight. HubSpot made this point in a 2016 post…
Irrelevant data points
Let’s look at the common, but misleading, CTR formula.
Bottom line: only recipients who open your message can click. Period. Including recipients who didn’t open in your CTR calculation muddies the result.
How marketers incorrectly calculate unique click-through rate
Unique recipients who clicked ÷ Total recipients
In a recent engagement, a client calculated CTR against a list of more than 100k contacts. It was a re-engagement campaign sent to recipients who hadn’t opened an email in 18 months, and only 1,423 recipients opened the first email. The campaign performed well overall, but the CTR math didn’t reflect that reality.
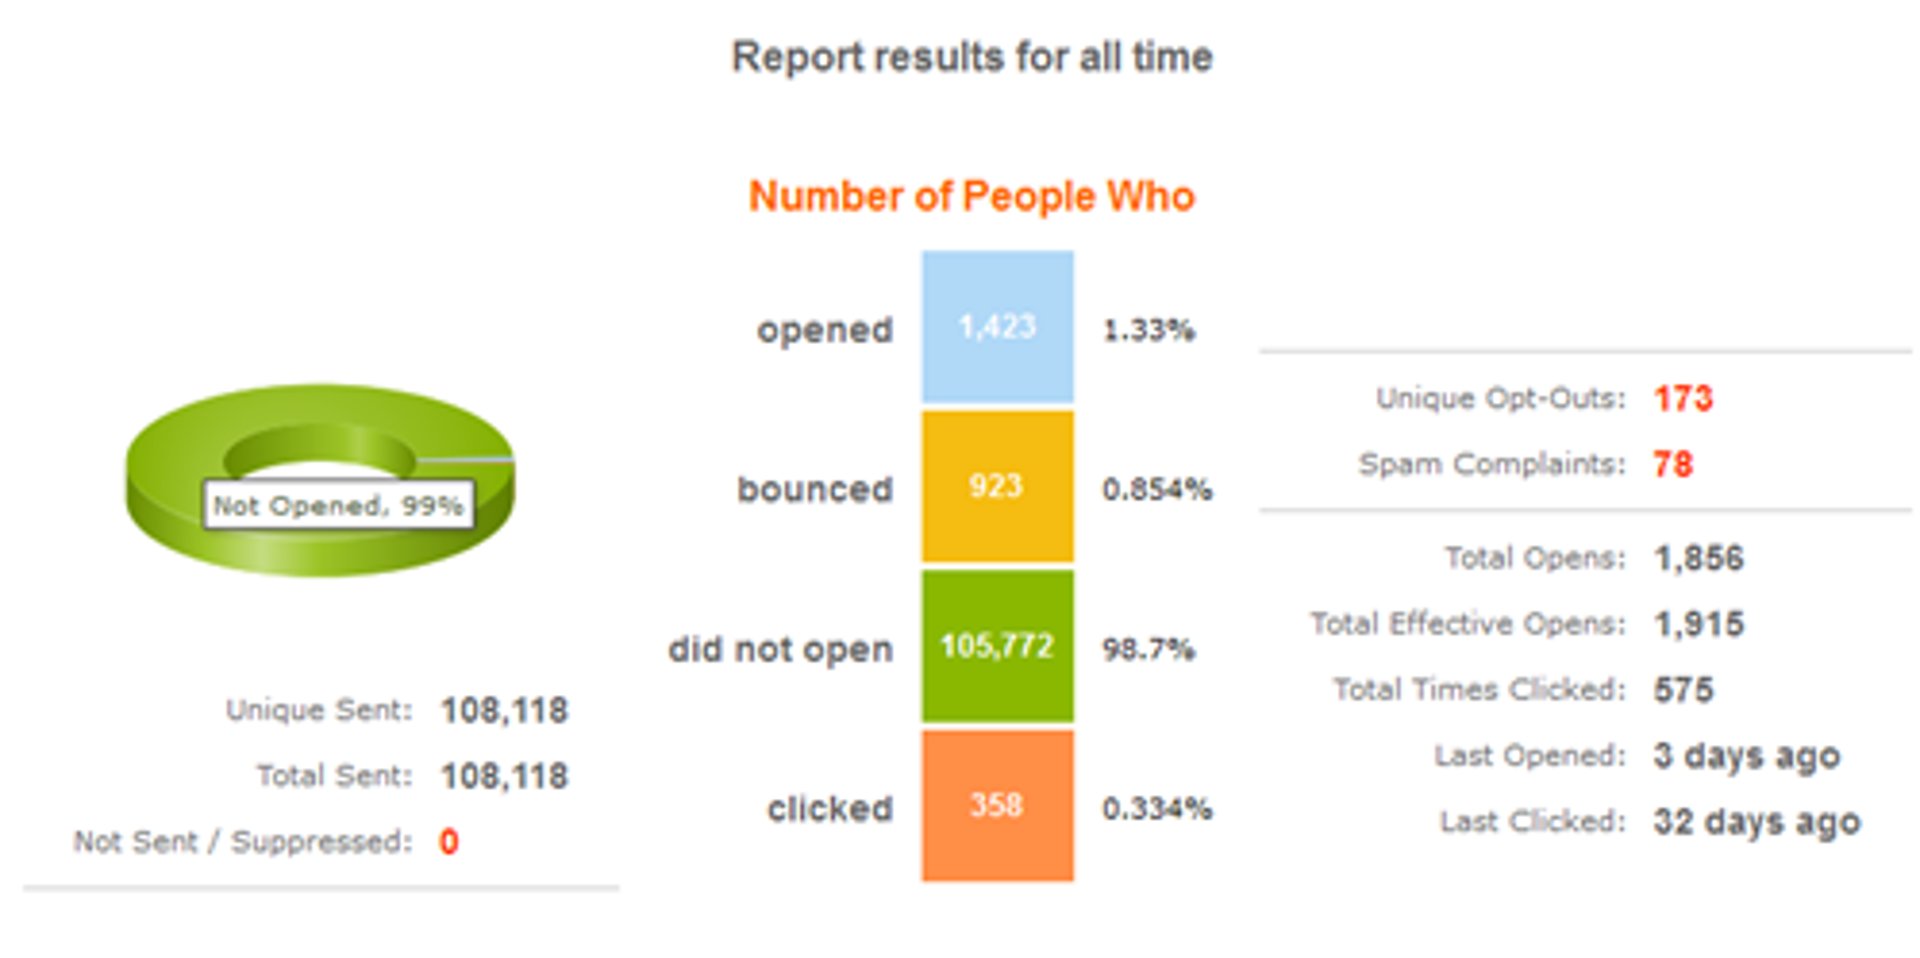
The click-through rate was calculated at 0.334%, which is correct if you divide by total recipients. But is that an accurate picture of content performance when only 1,423 recipients opened the email?
Calculate a true click-through rate
When you evaluate email content, ask yourself, “If a recipient didn’t open the message, should they be part of my unique click-through rate calculation?” You may find your content is doing a better job of generating traffic and engagement than you thought.
Let’s focus on the unique click-through rate metric. Unnecessary data points, like non-openers, should be excluded. It’s as simple as this:
True unique click-through rate
Unique recipients who clicked ÷ Unique recipients who opened
Using the example above, the client’s true click-through rate was 25.2%. Benchmarks vary by audience and campaign type, but that’s a strong result for a re-engagement send.
Critically evaluate your email data
When you take a few extra steps to calculate more accurate, useful data, you can:
- Determine the overall effectiveness of your emails
- Identify which elements of your email program need attention
- Segment your lists by engagement and send relevant messages proven to work
Why this matters
Say you send a prospect newsletter to 100,000 people.
Using the traditional method (clicks ÷ sends), you might see 3.1%, 2.9%, 3.2%, 3.5% month to month. Was the first email really 0.2% better than the second?
Now calculate CTR as clicks ÷ opens. You might see 23.4%, 19.5%, 27.3%, 33.3%. The picture becomes clearer. The last email performed at least 21% higher than the rest. Now you have numbers you can act on.
“I find this method not only a great way to quantify our program successes,” said Brandon Palmer, digital marketing specialist at Access Marketing Company, “but also a great starting point when digging deeper into what caused the increase in engagement.”
Dave Moll is the digital marketing manager at Access Marketing Company. For more than 15 years, he’s designed and implemented tracking pipelines for countless B2B companies across a wide range of platforms, including Facebook, LinkedIn, X, Act-On, HubSpot, Google Ads, AdRoll, and more. When he’s not building custom dashboards in Klipfolio Klips, he’s fronting one of Denver’s hottest cover bands or watching Arsenal FC slip, yet again, to the middle of the English Premier League table.
Related Articles

5 tips to understand (and organize) your restaurant data
By Saleem Khatri — June 9th, 2026
6 Facebook ads reports every agency needs to attract and retain high-ticket clients
By Tanya Brody — April 10th, 2026
The 5 ways to make your business partnership last a lifetime
By Shaughn Finnerty — April 10th, 2026
